Article citation information:
Nguyen Huy, C., Pham Huu, T., Dinh Xuan, T. Simulation
to determine the appropriate urea injection angle in a selective catalytic
reduction system. Scientific Journal of
Silesian University of Technology. Series Transport. 2026, 131, 151-164. ISSN: 0209-3324. DOI: https://doi.org/10.20858/sjsutst.2026.131.9
Chien NGUYEN HUY[1],
Tuyen PHAM HUU[2],
Thanh DINH XUAN[3]
SIMULATION TO DETERMINE THE APPROPRIATE UREA INJECTION ANGLE IN A
SELECTIVE CATALYTIC REDUCTION SYSTEM
Summary. The selective catalytic reduction (SCR) system is the
most effective approach to reducing nitrogen oxide (NOx) emissions
in diesel engine exhaust gases. The NOx conversion efficiency of SCR
systems depends on several factors, including exhaust gas temperature, urea
injection and evaporation characteristics, NH3/NOx
distribution uniformity, exhaust gas flow rate, and urea consumption. This
paper evaluates the effect of urea injection angle (β) on the wall spray behavior, the exhaust gas temperature, and gas mixture
uniformity at the inlet of the SCR catalyst. The study used ANSYS Fluent CFD
(computational fluid dynamics) simulation software with angles β = 20°,
30°, 45°, 90°, and 135°. The research results show that urea injection angles
β = 20° and 30° reduce the amount of urea solution sprayed and adhered to
the exhaust pipe wall. The gas mixture temperature distribution at the SCR
catalyst inlet ranges from 444.28 K to 677.21 K, which corresponds to the
effective operating temperature range of the SCR catalyst. At a urea
injection angle of β = 30° at the SCR catalyst inlet, the NH3/gas
mixture is mixed most uniformly (UI = 0.826) at an engine rotation of 2000 rpm
and a load of 100%.
Keywords: urea
injection angle, SCR technology, NOx emission reduction, diesel
engine, engine exhaust gases
1. INTRODUCTION
In the SCR system, a urea solution is injected into
the heated engine exhaust gas, where it is hydrolyzed to ammonia (NH3), which serves as a
reducing agent, reacting with NOx to form N2 and H2O
on the catalyst surface before being released into the environment [1]. The urea injection system is an essential component of the catalyst NOx
reduction system, with its primary purpose being to atomize the urea solution
into fine droplets and ensure uniform distribution throughout the exhaust gas
stream. However, when spraying the urea solution into the exhaust pipe, the
phenomenon of incomplete evaporation of the urea solution or the contact of the
urea stream with the exhaust pipe wall may occur [2]. During
urea hydrolysis, while NH3 is the desired product for the SCR
catalyst, undesirable solid by - products, such as biuret, cyanuric acid can
also be formed within the liquid film [3], [4]. These
solid by-products negatively affect the NOx reduction performance,
hinder the flow of the exhaust gas mixture with NH3, and reduce the
uniformity of the NH3 concentration distribution in the gas mixture.
The fundamental prerequisite for effective SCR performance is a uniform
distribution of NH3 in the exhaust gas upstream of the SCR
unit. Lack of uniformity can cause excess NH3, poor NOx
conversion, and catalyst degradation.
Parameters
of working modes and installation positions of the injector, such as urea
injection pressure, urea injection angle, and urea injection position in the SCR system, have a
significant influence on the urea hydrolysis reaction and the uniformity of NH3
concentration distribution [5], [6]. Suppose the urea injection installation position or spray angle is
unreasonable. In that case, urea spraying and hydrolysis will be poor,
affecting the NOx conversion rate, NH3 distribution
uniformity, and urea film or residue on the exhaust pipe wall [7]. In research [8], the authors showed that when the
urea injection pressure increased, the average size of urea droplets (Sauter
Mean Diameter – SMD) decreased significantly. The decrease in droplet size
helped improve the atomization process and increase the evaporation rate of
urea, thereby improving the efficiency of NH3 formation for the
selective catalytic reduction reaction (SCR). A CFD study [9] examined urea - SCR spray behavior at low exhaust temperatures. At 180°C, evaporation
and pyrolysis are limited, causing stronger wall impingement, uneven NH₃
distribution, and incomplete films. Higher injection pressure and smaller spray
angles improve evaporation and droplet uniformity. In study [10], it was found that although
injection pressure predominantly governs droplet size, exhaust gas temperature
also exerts a significant influence on droplet formation and evaporation. The
atomization spray injection induces local cooling, necessitating a higher
exhaust gas temperature to achieve complete urea decomposition. Shi et al. [11] reported that proper injection
pressure helps prevent wall impingement. At lower pressures, the mixing
distance decreases, resulting in a more uniform axial distribution of Urea
Water Solution (UWS) droplets. Jeong et al. [12] investigated how injection angle,
position, and injector hole number affect ammonia distribution uniformity and
conversion efficiency under varying engine loads. The best efficiency occurred
with injection perpendicular to the exhaust flow, while 6 - hole and 8 - hole
nozzles showed similar performance, both achieving about 95% local evaporation
at the monolith face.
Thus, the parameters of the injection process
influence the evaporation and hydrolysis of urea solution and the mixing
process with the exhaust gas stream, thereby affecting the NOx
reduction efficiency of the NOx reduction catalyst system. Therefore, the author conducted a study on the
influence of urea solution nozzle placement angles (β) on the impact of urea injection with the opposite wall in the exhaust
pipe, exhaust gas temperature, and gas mixture uniformity at the SCR catalyst
inlet. The simulation is performed on specialized ANSYS Fluent CFD
(Computational Fluid Dynamics) software. In which the injection pressure is 0.7
MPa, the urea injector position is kept fixed, and the injection angle (β) compared to the exhaust pipe centerline is changed in 05 cases: β=20o, β=30o, β=45o, β=90o, β=135o.
2. METHODOLOGY
2.1. Theoretical basis of simulation in ANSYS
Fluent applied to SCR system
This
study uses ANSYS Fluent CFD software to simulate the SCR system. The following
equations are used:
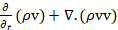
The mass conservation equation (Continuity equation):
|
|
(1) |


In equation (1): v represents the velocity of the
gas flow (m/s), ρ denotes the density of the gas flow
(kg/m³).
The equation of conservation of momentum (momentum equation):
|
|
(2) |
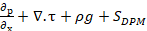
In equation (2): p denotes the
pressure of the gas flow (Pa),  is the
gravitational force,
is the
gravitational force,  represents the
source term arising from the interaction with the dispersed phase (in the case
of droplets, it corresponds to the reaction force exerted by the droplets on
the gas flow) (N/m³), τ denotes the viscous stress tensor of the gas
flow (Pa), determined in equation (3):
represents the
source term arising from the interaction with the dispersed phase (in the case
of droplets, it corresponds to the reaction force exerted by the droplets on
the gas flow) (N/m³), τ denotes the viscous stress tensor of the gas
flow (Pa), determined in equation (3):
|
τ |
(3) |

In equation (3):  is effective viscosity (Pa.s),
  is the coefficient acting on the “main cross”
components (xx, yy, zz), when i = j then = 1 and when i ≠ j then = 0.
is the coefficient acting on the “main cross”
components (xx, yy, zz), when i = j then = 1 and when i ≠ j then = 0.
The energy conservation equation
(energy equation):
|
|
(4) |


In equation (4):  denotes the density of the gas flow (kg/m3),
 is specific energy of gas flow (J/kg) can be
calculated by the formula:
is specific energy of gas flow (J/kg) can be
calculated by the formula:  , h is enthalpy of gas flow
(J/kg),
, h is enthalpy of gas flow
(J/kg),  is the velocity of the gas flow (m/s), p is
the pressure of the gas flow (Pa),
is the velocity of the gas flow (m/s), p is
the pressure of the gas flow (Pa),  is the temperature of the gas flow (K),
  is effective thermal conductivity (W/mK), Sh
is additional energy source (W/m3). To describe the turbulent
characteristics of the gas flow, the RNG k–ε (Re-Normalization Group k–ε) model is applied [13].
is effective thermal conductivity (W/mK), Sh
is additional energy source (W/m3). To describe the turbulent
characteristics of the gas flow, the RNG k–ε (Re-Normalization Group k–ε) model is applied [13].
The convection - diffusion equation
of the iᵗʰ gas can be expressed as [14]:
|
|
(5) |

In
equation (5):  denotes the
mass fraction of the
denotes the
mass fraction of the  gas species in the gas mixture, for example ammonia
(NH3) or other gases involved in the mixing process,
gas species in the gas mixture, for example ammonia
(NH3) or other gases involved in the mixing process,  is the density
of the gas flow,
is the density
of the gas flow,  is the velocity vector of the gas flow,
  denotes the
diffusion flux vector of the gas species and 𝑆𝑖 represents the rate of gas generation due to mass
transfer from the dispersed phase and other defined source terms. When these
parameters are combined, they describe the overall transport process –
including convection and diffusion – of the gases within the computational
domain. As a result, the distribution and uniformity of ammonia in the SCR
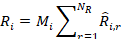
catalyst can be accurately predicted. 𝑅𝑖 represents denotes the overall generation rate of gas
species i resulting from all chemical reactions. This
rate is obtained by summing the products of the molecular weight
denotes the
diffusion flux vector of the gas species and 𝑆𝑖 represents the rate of gas generation due to mass
transfer from the dispersed phase and other defined source terms. When these
parameters are combined, they describe the overall transport process –
including convection and diffusion – of the gases within the computational
domain. As a result, the distribution and uniformity of ammonia in the SCR
catalyst can be accurately predicted. 𝑅𝑖 represents denotes the overall generation rate of gas
species i resulting from all chemical reactions. This
rate is obtained by summing the products of the molecular weight  of species i
and the molar rate of its formation or consumption
of species i
and the molar rate of its formation or consumption which is
determined based on the Arrhenius expression for each reaction r, as expressed
by:
which is
determined based on the Arrhenius expression for each reaction r, as expressed
by:
|
|
(6) |
In
this work, only irreversible reactions were taken into account. Accordingly,
the molar rate of formation or depletion of a gaseous species in a specific
reaction can be expressed as [14]:
|
|
(7) |

As
expressed in equation (7), N indicates the total chemical species
within the system, while  ,
,  correspond to
the stoichiometric coefficients related to reactants and products in reaction r.
The term
correspond to
the stoichiometric coefficients related to reactants and products in reaction r.
The term  denotes the
rate constant of the forward reaction, and
denotes the
rate constant of the forward reaction, and  [kmol/m3]
gives the molar concentration of species j involved. The
parameters
[kmol/m3]
gives the molar concentration of species j involved. The
parameters  and
and  refer to the
reaction order exponents for the reactant and product sides, respectively. The
forward rate constant is determined based on the Arrhenius expression [14]:
refer to the
reaction order exponents for the reactant and product sides, respectively. The
forward rate constant is determined based on the Arrhenius expression [14]:
|
|
(8) |
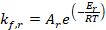
In equation (8), Ar refers to the
pre-exponential factor and T [K] denotes the absolute temperature. The
term  [J/kmol] represents the
reaction’s activation energy, with R
being the gas constant having a value of 8314.34 [J/(kmol.K)].
[J/kmol] represents the
reaction’s activation energy, with R
being the gas constant having a value of 8314.34 [J/(kmol.K)].
The droplets of the urea solution were tracked in a Lagrangian reference frame using the Discrete Phase Model (DPM) implemented in ANSYS Fluent. After evaporation, the urea decomposes and hydrolyzes:
|
(NH2)2CO
→ HNCO + NH3 |
(9) |
|
HNCO + H2O → NH3
+ CO2 |
(10) |
These reactions provide a source of
NH3 for the SCR reaction [15].
Biuret is a common byproduct of urea
decomposition, especially when urea is incompletely decomposed under high
temperatures:
|
(NH2)2CO +
HNCO → (NH2CO)2NH |
(11) |
Generation of cyanuric acid:
|
(NH2CO)2NH + HNCO → C3H3N3O3
+NH3 |
(12) |
The uniformity index (UI) is
used to quantify the ammonia (NH3) concentration distribution at the
inlet of the SCR catalyst. The UI value close to 1 indicates that NH₃ is
uniformly dispersed over the cross-sectional area at the catalyst entrance.
This parameter is derived from a correlation that relates the local and mean NH3
concentrations near the catalyst surface [16]:
|
|
(13) |
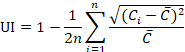
In equation (13) n represents the total number of
computational cells across the evaluated cross-section,  indicates the NH3 concentration
(mass fraction) at the ith cell, while
indicates the NH3 concentration
(mass fraction) at the ith cell, while  denotes the mean NH3 concentration
(mass fraction) obtained over the entire cross-sectional area. In ANSYS Fluent,
the NH3 concentration at each cell and the average NH3
concentration over the entire cross-section are output, where NH3
concentration is expressed as a mass fraction. To export the NH₃
concentration for each cell using the Field Functions tool in Fluent. First,
open ANSYS Fluent and load the project that has been created. Then, go to the
Reports menu and select Surface Integrals to export the results for each cell.
Choose Mass Species Fraction, and select NH3. This data can be
exported as a table or a CSV file. To calculate the average NH3
concentration (
denotes the mean NH3 concentration
(mass fraction) obtained over the entire cross-sectional area. In ANSYS Fluent,
the NH3 concentration at each cell and the average NH3
concentration over the entire cross-section are output, where NH3
concentration is expressed as a mass fraction. To export the NH₃
concentration for each cell using the Field Functions tool in Fluent. First,
open ANSYS Fluent and load the project that has been created. Then, go to the
Reports menu and select Surface Integrals to export the results for each cell.
Choose Mass Species Fraction, and select NH3. This data can be
exported as a table or a CSV file. To calculate the average NH3
concentration ( ) over the entire cross-section
(area-weighted integral method) using the Surface Integrals tool and calculate
the total mass of NH3 over the cross-section, then divide by the
cross - sectional area to get the average value. The formula for calculating
the average is
) over the entire cross-section
(area-weighted integral method) using the Surface Integrals tool and calculate
the total mass of NH3 over the cross-section, then divide by the
cross - sectional area to get the average value. The formula for calculating
the average is  , where A is the cross-sectional
area. Finally, after calculating and displaying the NH₃ concentration at
the cells and averaging it over the cross-section, the results can be saved as
a .csv or .txt file for further analysis or calculations.
, where A is the cross-sectional
area. Finally, after calculating and displaying the NH₃ concentration at
the cells and averaging it over the cross-section, the results can be saved as
a .csv or .txt file for further analysis or calculations.
2.2. Simulation model and input parameters
The exhaust pipe section containing the
urea injector and the SCR catalyst with the structure shown in Figure 1 is
simulated.
Previous studies
have shown that, for the urea solution to have enough time to completely
hydrolyze into NH3 before reaching the catalyst, the reasonable
length of the exhaust pipe from the injector installation position to the SCR
catalyst inlet (cross section A-A in Fig. 1) should be in the range of 200-400
mm [17]. In this study, the length of the exhaust
pipe selected is 350 mm (Fig. 1). The parameters of the injector are shown in
Table 1.
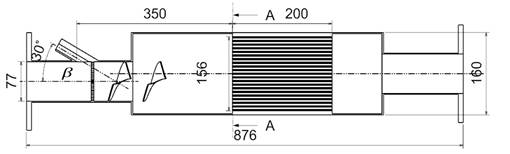
Fig. 1. SCR design model
Tab.
1
Parameters of the injector
|
Value |
Unit |
References |
|
|
Injection type |
Surface
DPM injection collimated jet |
- |
[14] |
|
Spray cone angle |
25
± 5 |
Degree |
Manufactured |
|
Mean droplet
diameter – SMD |
70 |
μm |
Manufactured |
|
Rosin-Rammler spread parameter |
3.0 |
- |
[14] |
|
Number of injector
holes |
6 |
- |
Manufactured |
|
Injector hole
diameter |
0.2 |
mm |
[18] |
To obtain the characteristic
parameters of the exhaust gas flow and urea injection as input data for
simulation purposes, a diesel engine was tested on an engine test bench at the
Research Center for Propulsion Systems and Autonomous Vehicles, School of Mechanical
Engineering, Hanoi University of Science and Technology. The parameters
measured included exhaust gas temperature and flow rate, urea injection
velocity and urea injection pressure. Figure 2 illustrates the layout of the test system.
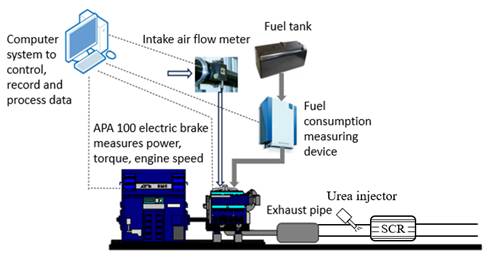
Fig. 2. Layout of engine test bench
These parameters taken from
the experiments on a D4BB diesel engine at 50% load, 75% load, 100% load at
speed of 2000 rpm are shown in Table 2.
Tab.
2
|
Parameters |
Value at 50% load |
Value at 75% load |
Value at 100% load |
Unit |
|
Exhaust gas inlet temperature |
511 |
627 |
735 |
K |
|
Urea solution
temperature |
300 |
300 |
300 |
K |
|
Exhaust gas velocity
inlet |
6.77 |
6.83 |
7.03 |
m/s |
|
Urea injection
velocity |
32.54 |
32.54 |
32.54 |
m/s |
|
Pressure at exhaust inlet |
0.12 |
0.125 |
0.13 |
MPa |
|
Urea injection
pressure |
0.7 |
0.7 |
0.7 |
MPa |
|
Pressure at the exhaust
outlet |
0.1 |
0.1 |
0.1 |
MPa |
|
Urea solution
density [19] |
1090 |
1090 |
1090 |
kg/m3 |
|
Exhaust gas density
[20] |
1.2943 |
1.2943 |
1.2943 |
kg/m3 |
|
Thermal conductivity
(Urea solution) |
0.0242 |
0.0242 |
0.0242 |
W/m.K |
|
Thermal conductivity
(Exhaust gas) |
0.0626 |
0.0626 |
0.0626 |
W/m.K |
|
Urea injection
angle |
20 |
20 |
20 |
Degree |
|
Urea injection
angle |
30 |
30 |
30 |
Degree |
|
Urea injection
angle |
45 |
45 |
45 |
Degree |
|
Urea injection
angle |
90 |
90 |
90 |
Degree |
|
Urea injection
angle |
135 |
135 |
135 |
Degree |
2.3. Model meshing
The 3D model and meshing model
are shown in Figure 3. In this study, the mesh was generated using an
unstructured hybrid mesh with structured quadrilateral and triangular mesh
elements – a popular choice in heat transfer problems, turbulence, and complex
flow simulations, which helps to improve computational accuracy and increase
the convergence speed of the solution.
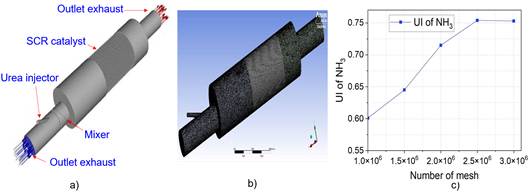
Fig. 3. 3D model meshing a) 3D model, b) 3D model meshing, c)
Comparison of UI of NH3 with a different number of meshes
The mesh element size of the model
surface is set in the range of 2-8 mm at different positions throughout the
entire exhaust pipe section. To evaluate the impact of grid resolution on the
ammonia uniformity index, four computational meshes containing 1.0, 1.5, 2.0,
2.5, and 3.0 million elements were tested. The problem was simulated for 600
steps. The results showed that when using a mesh of 2.5 million elements, the
UI of NH3 did not change significantly and reached the highest value
of 0.754 (Figure 3c).
The skewness metric was evaluated
for three element types: Tet4, Hex8, and Wed6. As shown in Figure 4, most
elements have low skewness values. The majority of Hex8 elements exhibit
skewness below 0.1, while Tet4 elements are mainly concentrated in the range of
0.1-0.3. The fraction of elements with skewness greater than 0.5 is tiny, and
no aspect exceeds 0.8. These values lie well within the recommended limits in
ANSYS Fluent (skewness < 0.85), indicating a low level of element distortion
and thereby supporting good accuracy of the CFD solution.
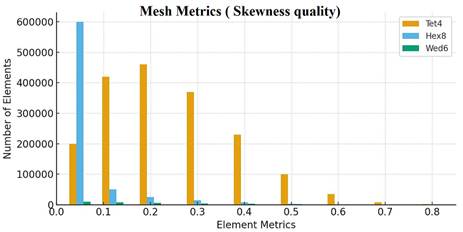
Fig. 4. Skewness quality distribution for 2.5
million mesh elements
To assess the orthogonality of
the mesh, the orthogonal quality metric was also calculated. As illustrated in
Figure 5, its values range from about 0.2 to nearly 1, with an average of
approximately 0.84. In particular, most Hex8 elements have orthogonal quality
values close to 1, demonstrating perfect orthogonality of the mesh. Only a
small number of Tet4 elements exhibit lower orthogonal quality, but they remain
within the acceptable range. With all elements above the minimum threshold of
0.15, the mesh exhibits good orthogonality, ensuring reliability and stability
for both flow and heat transfer simulations.
Based on this analysis,
approximately 2.5 million mesh elements were employed in the simulation domain.
3. RESULTS AND DISCUSSION
3.1. Effect of urea injection angle on urea
impingement on the exhaust pipe wall
To evaluate the possibility of urea
injection hitting the opposite wall in the exhaust pipe, five exhaust pipe
models with urea injection angles of 20o, 30o, 45o,
90o, 135o were simulated (Figure 6). Simulation results
show that when the urea injection angles β = 20o, 30o the injection
jet is directed nearly parallel to the movement of the exhaust flow, helping
the urea and NH3 particles to disperse along the length of the pipe,
limiting the phenomenon of impact on the pipe wall, and creating conditions for
more even mixing with the exhaust flow. In addition, arranging the injection
jet to move in the same direction as the exhaust flow will help reduce fluid
loss and improve the mixing process between the spray solution and the exhaust
flow throughout the pipeline. When the urea injection angles β = 45o, 90o and
135o the injection solution will directly collide with the opposite
wall of the exhaust pipe. This will cause the solid by-products, such as
biuret, cyanuric acid, to form from the liquid film and deposit on the pipe
wall. The deposited urea is difficult to evaporate and mix with the exhaust
flow. Therefore, it reduces the amount of urea participating in the hydrolysis
reaction, thereby reducing the efficiency of NOx reduction in the
exhaust flow.
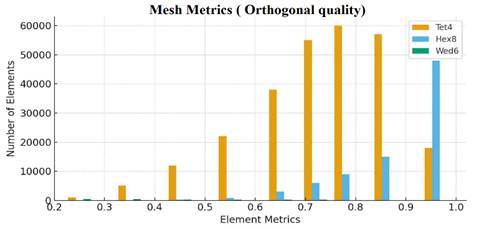
Fig. 5. Orthogonal quality distribution for 2.5
million mesh elements

Fig. 6. Influence of urea injection angle on
wall impingement in the exhaust pipe
3.2. Influence of urea injection angle on the
temperature of the gas mixture at the SCR catalyst inlet
Figure 7 illustrates the
temperature distribution of the exhaust gas and urea combination at the intake
of the SCR catalyst. It was observed that the exhaust temperature at the inlet
of the SCR catalyst rises progressively as the engine load increases. For
example, at 2000rpm with β
= 30o, the temperature is about 452.13K at 50% load, rises to
568.11K at 75% load, and reaches 676.23K at 100% load.
Gas mixture
temperature at the SCR catalyst inlet in all cases is in the range of
444.28K÷677.21K, which is within the effective working range of the SCR
catalyst [21]. Figure 7 also
shows that with the injection angle β = 20o, the temperature of
the gas mixture at the SCR catalyst inlet reaches the highest value 677.21K at
2000 rpm, 100% load mode. When the injection angle β = 20° produces a
spray that is more aligned with the main exhaust flow, resulting in weaker spray
– wall impingement and reduced lateral penetration. Consequently, the droplets
experience a shorter residence time near the wall and a smaller liquid – gas
contact area. These factors lead to less evaporative cooling, allowing the hot
core flow to be better preserved at the SCR inlet. Sufficiently high and evenly
distributed temperature at the SCR catalyst inlet will promote the pyrolysis
and hydrolysis of urea, helping to generate more NH3 evenly, thereby
improving the NOx reduction efficiency. As the injection angle is
increased, the radial velocity component of droplets increases, enhancing the
probability of collision and rebound with the pipe wall [22]. These zones trap
evaporatively cooled gas and mix it back into the main stream, resulting in
greater cooling and a lower area-averaged temperature at the SCR inlet.
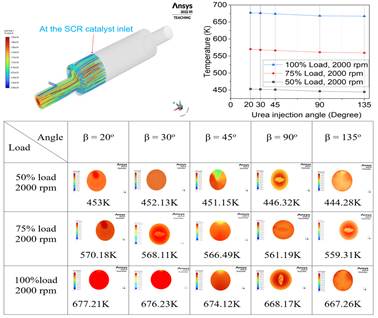
Fig. 7. Temperature of the gas mixture at the
SCR inlet for various urea injection angles
3.3. Effect of urea
injection angle on the uniformity of NH3/gas mixture at the SCR
catalyst inlet
In the SCR system, the NOx conversion efficiency is strongly
influenced by the uniformity of the NH3 in the gas mixture before
entering the catalyst. When NH3 is evenly distributed, the entire
catalyst surface receives the necessary amount of reductant; thereby the
reaction with NOx takes place effectively, the reduction efficiency
reaches near the maximum value, and the phenomenon of NH3 slip is
limited. On the contrary, if NH3 is unevenly distributed, areas
lacking NH3 will not completely reduce NOx, while regions
with excess NH3 will increase the risk of NH3 slippage,
causing secondary emissions. Therefore, the more uniform the NH3
distribution in the gas mixture is, the higher and more stable the NOx
conversion efficiency of the SCR system will be.
Figure
8 illustrates the variation in the NH3 uniformity index (UI) with
respect to urea injection angle across three load conditions of 50%, 75%, and
100% at 2000 rpm. As the engine load increases, the NH3 uniformity
index (UI) shows a clear upward trend, reaching its maximum at full load
(100%), followed by 75% and 50%. This is explained by the fact that when the
load increases, the temperature and exhaust gas flow increase, helping the
evaporation and mixing of NH3 in the gas stream to take place more
strongly, increasing the uniformity of the mixture. Regarding spray angle, UI
increases rapidly from 20° to 30° and reaches a maximum value at a urea
injection angle of 30°, then gradually decreases as the spray angle continues
to increase. The reason is that when the spray angle is too slight, the spray
is concentrated and the coverage area is narrow; while when the angle is too
large, the spray collides with the pipe wall earlier, reducing the mixing
efficiency. Thus, the urea injection angle β = 30° is considered optimal
to achieve the highest uniformity of NH3 at the investigated urea
injection angles β and the investigated loading mode. In addition, in the
study of S. Jeong et al. [17], with the distance from the injector to the front
cross-section of the SCR being 400 mm and the exhaust gas velocity from 6 to 12
m/s, corresponding to the residence time ranging from 0.03 s to 0.06 s, with a
UI value of 0.733. In our study, this distance was shortened to 350 mm, with an
exhaust gas velocity from 6 to 7 m/s, resulting in a residence time of about
0.05 s and a maximum UI value of 0.826, showing a significant improvement in
the efficiency of mixing and dispersing the exhaust gas flow while improving
the accuracy of the simulation model.
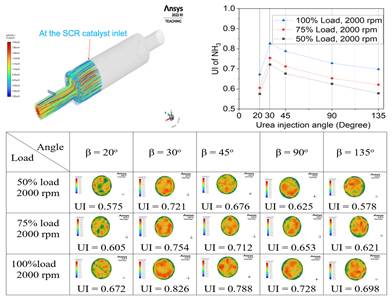
Fig. 8. Uniformity Index of NH3 at the SCR Catalyst inlet for
different urea injection angles
4. CONCLUSIONS
In this study, an SCR design model was developed in which the length
from the urea injector to the SCR catalyst inlet was chosen to be 350 mm based
on the recommendation that 200-400 mm would be sufficient for complete
hydrolysis of the urea solution in NH3 at a similar exhaust gas flow
rate, as published in [17]. Based on this model, a SCR 3D
model was constructed in ANSYS Fluent using a 2.5 million-element mesh to
ensure a stable UI value. The first novelty of this research was that exhaust
gas temperatures, pressures, density, velocities, and flow rates; urea solution
temperature and density; urea injection velocity, pressure, and urea injection
angles for the D4BB engine were measured on an engine test bench under load
characteristics at 2000 rpm to provide input data for the ANSYS Fluent
simulation model.
The second novelty is that when the urea injection angle β is 20o and 30o, the amount of sprayed solution
colliding and sticking to the
exhaust pipe wall is reduced, thereby reducing the amount of urea sticking
and decomposing on the pipe wall surface; simulations and comparisons
were carried out for five different angles, including 20o, 30o,
45o, 90o, 135o.
The third novelty is the provision of a data set on the temperature
distribution of the exhaust gas and urea mixture at the inlet of the SCR
catalyst, which varies depending on the engine's operating characteristics. In
this case, the temperature of
the gas mixture at the inlet of the SCR catalyst is in all cases within the
range of 444.28 K - 677.21 K, which corresponds to the effective
operating range of the SCR catalyst recommended in [21].
Experimentally determining the homogeneity of NH3 in the gas
mixture before entering the catalyst requires expensive measurement equipment,
complex experiments, and is often impossible. Therefore, the use of modeling tools such as CFD is an effective solution, which
has been implemented in published work by other authors [10], [12], [17] and [22] as well as in this study. The
final novelty is that at an ure injection angle β = 30°, the NH3 distribution at the SCR catalyst inlet is
more uniform compared to the other injection angles, thereby enhancing the
homogeneity of NH3 and exhaust gas mixture upon entering the
catalyst and improving the catalyst's NOx conversion efficiency.
In future studies, the obtained results will serve as a basis for
designing and manufacturing an exhaust pipe section for installing a urea
solution injector, specifically, and an SCR system, generally, for in-use
diesel engines without SCR systems.
Acknowledgement:
The authors express gratitude to the Research Center
for Propulsion Systems and Autonomous Vehicles, School of Mechanical
Engineering, Hanoi University of Science and Technology, and Hanoi University
of Industry for their support of this research.
References:
1.
Kurzydym Damian, Zbigniew Zmudk, Diego Perrone,
Adam Klimanek. 2022.
„Experimental and numerical investigation of nitrogen oxides reduction in
diesel engine selective catalytic reduction system”. Fuel 313. No.
122971. DOI:
https://doi.org/10.1016/j.fuel.2021.122971.
2.
Börnhorst M.,
O. Deutschmann. 2018. „Single droplet
impingement of urea-water solution on a heated substrate”. International
Journal of Heat and Fluid Flow 69: 55-61. DOI:
https://doi.org/10.1016/j.ijheatfluidflow.2017.10.007.
3.
Brack W., B. Heine, F. Birkhold, M. Kruse,
O. Deutschmann. 2016. „Formation of urea-based deposits in an exhaust system:
numerical predictions and experimental observations on a hot gas test bench”. Emission
Control Science and Technology 2: 115-123. DOI: https://doi.org/10.1007/s40825-016-0042-2.
4.
Börnhorst M., S. Langheck, H.
Weickenmeier, C. Dem, R. Suntz, O. Deutschmann. 2019. „Characterization of
solid deposits from urea-water solution injected into a hot gas test rig”. Chemical
Engineering Journal 377. No. 119855. DOI:
https://doi.org/10.1016/j.cej.2018.09.016.
5.
Prabhu S. Sadashiva, N.S. Nayak, N.
Kapilan, V. Hindasageri. 2017. „An Experimental and Numerical Study on Effects
of Exhaust Gas Temperature and Flow Rate on Deposit Formation in Urea-Selective
Catalytic Reduction (SCR) System of Modern Automobiles”. Applied Thermal
Engineering 111: 1211-1231. DOI:
https://doi.org/10.1016/j.applthermaleng.2016.09.134.
6.
Lee C. 2018. „Numerical and Experimental
Investigation of Evaporation and Mixture Uniformity of Urea-Water Solution in
Selective Catalytic Reduction System”. Transportation Research Part D:
Transport and Environment 60: 210-224. DOI:
https://doi.org/10.1016/j.trd.2017.04.015.
8.
Kim D., D. Yang, J. Lee. 2013. „Effect of
injection pressure on the atomization characteristics of a liquid sheet-type
swirl injector for Urea-SCR system”. Journal of the Korean Society of Marine
Engineering 37(5): 510-519. DOI:
https://doi.org/10.5916/jkosme.2013.37.5.510.
9.
Jia H., Z. Zhou, B. Yin, Z. Liu, S. Wen.
2021. „Effects of SCR injection system parameters on UWS atomization and mixing
characteristics at low exhaust temperature”.
Sādhanā 46(238). DOI:
https://doi.org/10.1007/s12046-021-01745-7.
10.
Shahariar G.M.H., O.T. Lim. 2018.
„Investigation of urea aqueous solution injection, droplet breakup and urea
decomposition of selective catalytic reduction systems”. Journal of
Mechanical Science and Technology 32: 3473-3481. DOI:
https://doi.org/10.1007/s12206-018-0651-5.
11.
Shi X., J. Deng, Z. Wu. 2013. „Effect of
Injection Parameter on Spray Characteristics of Urea-SCR System”. SAE
International Journal of Engines 6(2): 873-881. DOI:
https://doi.org/10.4271/2013-01-1067.
12.
Jeong S., S. Lee, W. Kim, C. Lee. 2005. „Simulation on the
Optimum Shape and Location of Urea Injector for Urea-SCR System of Heavy-duty
Diesel Engine to Prevent NH3 Slip”. SAE Technical Paper. No. 2005-01-3886. DOI:
https://doi.org/10.4271/2005-01-3886.
13.
Sarosh A., A. Hussain, E. Pervaiz, M.
Ahsan. 2018. „Computational Fluid Dynamics (CFD) Analysis of Phthalic
Anhydride’s Yield Using Lab Synthesized and Commercially Available (V2O5/TiO2)
Catalyst”. Engineering
Technology and Applied Science
Research 8(2):
2821-2826. DOI:
https://doi.org/10.48084/etasr.1954.
14.
ANSYS Fluent 2024 R2. Ansys Fluent
Theory guide. Available at: https://ansyshelp.ansys.com/public/account/secured?returnurl=/Views/Secured/corp/v242/en/flu_th/flu_th_sec_turb_les_filt_ns_eq.html.
15.
Nova I., E. Tronconi. 2014. Urea-SCR
Technology for DeNOx After Treatment of Diesel Exhausts. Springer New York,
NY. Available at: https://link.springer.com/book/10.1007/978-1-4899-8071-7.
16.
McKinley T.L., A.G. Alleyne, C.F. Lee
2010. „Mixture non-uniformity in SCR systems: Modeling and uniformity index
requirements for steady-state and transient operation”. SAE International
Journal of Fuels and Lubricants 3(1): 486-499. DOI:
https://doi.org/10.4271/2010-01-0883.
17.
Jeong S., H. Kim, H. Kim, O. Kwon, E. Park, J. Kang. 2021. „Optimization
of the Urea Injection Angle and Direction: Maximizing the Uniformity Index of a
Selective Catalytic Reduction System”. Energies 14(1). DOI:
https://doi.org/10.3390/en14010157.
18.
Fault diagnosis and situation analysis.
Weichai electronic injection vehicle engine. Weichai Power Co., Ltd., Apr. 2018.
19.
„Aqueous Urea Solution 32.5%”. Crownoil.
2025. Available at: https://cdn.crownoil.co.uk/wp-content/uploads/2025/04/AdBlue.pdf.
20.
Uniform provisions concerning the measures
to be taken against the emission of gaseous and particulate pollutants from
compression-ignition engines and positive ignition engines for use in vehicles. UN Regulation No 49, 2023. Available at: https://www.stradalex.eu/en/se_src_publ_leg_eur_jo/toc/leg_eur_jo_3_20230116_14/doc/ojeu_2023.014.01.0001.01.
21.
Nie X., Y. Bi, L. Shen, S. Liu, J. Yan, S.
Zhang. 2024. „Study on transient temperature characteristics of SCR under
different post-injection strategies”. Fuel 366. No. 131312. DOI:
https://doi.org/10.1016/j.fuel.2024.131312.
22.
Nishad K., F. Ries, J. Janicka, A. Sadiki.
2018. „Analysis of spray dynamics of urea–water-solution jets in a SCR-DeNOx
system: an LES-based study”. International Journal of Heat and Fluid Flow
70: 247-258. DOI:
https://doi.org/10.1016/j.ijheatfluidflow.2018.02.017.
Received 19.12.2025; accepted in
revised form 23.04.2026

Scientific
Journal of Silesian University of Technology. Series Transport is licensed
under a Creative Commons Attribution 4.0 International License