Article
citation information:
Kubielas-Walasek,
J., Świrska-Perkowska, J., Pawlik, K. Dependence between the
values of pavement friction coefficients determined by the stationary and
continuous methods. Scientific Journal of
Silesian University of Technology. Series Transport. 2026, 131, 103-119. ISSN: 0209-3324. DOI: https://doi.org/10.20858/sjsutst.2026.131.6
Joanna KUBIELAS-WALASEK[1],
Jadwiga ŚWIRSKA-PERKOWSKA[2], Kamil PAWLIK[3]
DEPENDENCE BETWEEN
THE VALUES OF PAVEMENT FRICTION COEFFICIENTS DETERMINED BY THE STATIONARY AND
CONTINUOUS METHODS
Summary. The paper presents the results of pavement friction
coefficient measurements carried out using the ViaFriction
device ( ) and the British Pendulum Tester
(PTV), along with Mean Profile Depth (MPD) tests on asphalt pavements. Six road
sections, each approximately 1 km long, were selected for the study, all paved
with asphalt mixtures: four sections with SMA11, one with SMA8, and one with
AC11. Correlations between datasets obtained from each device were then analyzed. It was found that friction coefficients and PTV exhibited strong
correlation when only SMA11 pavements were considered, and moderate correlation
when all pavement types were included. The correlation between
and the MPD parameter was accordingly moderate or weak. Furthermore,
multiple regression analysis was employed to determine the relationship between
the friction coefficient and the PTV and MPD
values. In each case, an improvement in the fit of such a model to the
measurement data was observed compared with the model describing a linear
relationship between the coefficients and PTV.
) and the British Pendulum Tester
(PTV), along with Mean Profile Depth (MPD) tests on asphalt pavements. Six road
sections, each approximately 1 km long, were selected for the study, all paved
with asphalt mixtures: four sections with SMA11, one with SMA8, and one with
AC11. Correlations between datasets obtained from each device were then analyzed. It was found that friction coefficients and PTV exhibited strong
correlation when only SMA11 pavements were considered, and moderate correlation
when all pavement types were included. The correlation between
and the MPD parameter was accordingly moderate or weak. Furthermore,
multiple regression analysis was employed to determine the relationship between
the friction coefficient and the PTV and MPD
values. In each case, an improvement in the fit of such a model to the
measurement data was observed compared with the model describing a linear
relationship between the coefficients and PTV.
Keywords: road pavement, friction coefficient, British Pendulum Tester, ViaFriction, MPD, correlation
1. INTRODUCTION
One of the key parameters determining road safety is
skid resistance [1,2]. This has been confirmed by numerous experimental
studies, which indicate that approximately 30% of all accidents are related to
deterioration of pavement condition and its skid resistance properties [3,4].
In road engineering, skid resistance is most commonly defined as the force
generated between a tire and the pavement when a locked (non-rotating) wheel
slides along the road surface [5]. This force is associated with the coefficient
of dynamic friction [6], which depends, among other factors, on the pavement
material, its condition and contamination, as well as the construction and
material of a tire [6,7]. However, in vehicle dynamics, a key parameter is the
peak value of the friction coefficient, which occurs at a slip ratio of a tire
equal to or below 0.2 that is, under partial wheel lock. In such conditions,
the force generated at the tire-pavement interface results from both static and
dynamic friction. The peak friction coefficient exceeds the value observed
under full wheel lock (slip ratio of 1.0) by more than 1.2 times [6].
So far, two distinct friction mechanisms have been
identified, arising respectively from adhesion and hysteresis phenomena. The
first is related to weak molecular interactions between the substrate and the
rubber and plays a significant role at low vehicle speeds [8]. The adhesion
phenomenon depends on microtexture of the pavement,
that is, the shape of aggregate grains used for its construction. The
hysteresis component results from internal friction within the rubber: as the
rubber moves over rough surfaces, it is subjected to oscillatory forces that
cause cyclic deformations of the rubber and energy dissipation through internal
damping [8,9]. Hysteresis friction is a dominant mechanism at high vehicle
speeds, and its magnitude mainly depends on pavement macrotexture. For example,
local variations in road roughness can contribute to changes in the predicted
friction force by more than 50% [8].
It should be noted that the concept of tire adhesion
to the road surface is closely related to the coefficient of friction of the
surface. Accurate determination of adhesion is of crucial importance for road
traffic safety, particularly for the operation of active safety systems such as
ABS, ESP, and electronic brake-force distribution systems. In practice, the
problem is complex because the adhesion depends on numerous factors, including
road pavement type, tire condition, wheel slip, vertical load, and weather
conditions [10]. The paper [10] analyses several well-known mathematical models
describing the relationship between wheel slip and adhesion force. It is noted
that different models accurately reproduce only selected operating ranges of
the wheel, for example during acceleration or braking, whereas not all models
correctly represent the entire range of motion from free rolling to wheel
lock-up.
Due to immense importance of
skid resistance of road pavements, continuous efforts have been made for
many years to improve both laboratory and field methods for measuring the
friction coefficient [3], as well as to identify relationships between results
obtained using these methods. Existing measurement techniques can be broadly
divided into two main groups. The first group involves indirect tests based on
measurements of characteristics describing the microtexture
and macrotexture of the pavement surface and predicting the pavement friction
coefficient using appropriate models. This approach is addressed, for example,
in studies [11-13]. The second group consists of direct tests, during which the
friction coefficient of the pavement (field tests) or samples (laboratory
tests) is measured directly [3]. Friction measurement devices can be
categorized as devices for longitudinal friction measurement (LFC), devices for
measuring lateral force coefficient (SFC), and stationary devices such as the
British Pendulum Tester (BPT) [3,5]. The research method employing the BPT,
used to measure the dynamic friction coefficient, was developed in the 1960s
[14] and remains one of the most commonly applied measurement methods in this
field [3]. The BPT is a pendulum-style tester with a standard rubber slider set
at an angle to ensure minimal contact with the surface of the tested pavement.
Many researchers consider that results obtained using the BPT are related
solely to microtexture of the pavement [15]; however,
detailed analysis of the BPT’s operation also confirms the existence of
correlation between BPN results and pavement macrotexture [16].
As mentioned earlier, the efforts of many researchers
have been focused on finding relationships between skid resistance measurement
results obtained using different testing devices. For example, the study [15]
presented the results of skid resistance tests carried out on ten selected road
sections differing in asphalt mixture used in the wearing course. Friction
coefficient measurements were conducted using the mobile TWO device, which
consists of a pair of wheels (a measuring wheel and a reference wheel) connected
by a chain drive. The measuring wheel is partially locked (slip ratio of 17.8%)
and loaded with a force of 60 kg. Additionally, for the analyzed road sections,
dynamic friction coefficient measurements were performed using the British
Pendulum Tester (BPT) and Mean Texture Depth (MTD) was measured using the
volumetric method (sand patch method). The friction coefficient obtained using
the TWO device showed good correlation with values obtained from the BPT (determination coefficient R² greater than 0.8) as well as with MPD values (R² greater than 0.7).
In the study [3], skid resistance was examined on
three test tracks with SMA11S asphalt pavements constructed using three
different mineral aggregates (diabase, rhyolite, and basalt). Measurements were
carried out for over four years, with a frequency of three times per year,
using five different devices: the BPT test, Mean Texture Depth (MTD) test
(optical profilometer), Outflow Meter (OFM) test, Wehner/Schulze (W/S) test,
and longitudinal friction coefficient test (ViaFriction
device). The ViaFriction device is a single-wheel
friction measurement instrument with variable slip ratio ranging from 1% to 75%
(standard slip ratio is set at 18%), performing continuous measurements. Low
correlation was found between friction coefficient values obtained using the ViaFriction device and the BPT. The ViaFriction
test results also showed no correlation with the Mean Texture Depth (MTD) index
values. Additionally, it was confirmed that the type of aggregate significantly
affects skid resistance of the asphalt pavement.
The authors of the study [17] described various
devices used for measuring skid resistance properties of pavements and analyzed
correlation between friction results obtained from stationary devices such as
the California Skid Tester (CST) with slip ratio  and test speed
  km/h, the British Pendulum Tester (BPT) with and
  km/h, and the
Dynamic Friction Tester (DFT) with and
km/h, and the
Dynamic Friction Tester (DFT) with and  ranging from 0 to 90 km/h, as well as
continuous measurement devices: the Locked-Wheel Skid Trailer with i
ranging from 0 to 90 km/h, as well as
continuous measurement devices: the Locked-Wheel Skid Trailer with i  km/h, the Mu-Meter with
  i
i  km/h, and the GripTester with
  i
i  km/h. Good
correlation (determination coefficient R2>0.8)
was found between the measurement results obtained with the BPT and those from
the CST, DFT, and GripTester.
km/h. Good
correlation (determination coefficient R2>0.8)
was found between the measurement results obtained with the BPT and those from
the CST, DFT, and GripTester.
The aim of the study [18] is to attempt to develop a
model linking friction coefficient with parameters describing the pavement
texture. Roads with pavements made of mineral-asphalt mixtures differing in
aggregate grading were selected for the study, including two highly porous
mixtures, two mixtures with dense aggregate gradation, and one mixture of
mastic asphalt. The texture of pavement samples was tested using a linear laser
scanner. Field measurements were conducted using the BPT, DFT, and micro-GripTester. Statistical analysis of the experimental
results using linear regression showed no universal relationship between
texture and friction. Although statistically significant, this relationship
takes a different form for each type of pavement. Furthermore, the authors
concluded that MPD is the most important pavement texture parameter for
describing various friction measurements.
The paper presents the results of friction coefficient
measurements on six different roads with pavements made of mineral-asphalt
mixtures having maximum aggregate sizes of 11 or 8 mm. All tested road sections
were approximately 1 km long. The friction coefficient was measured
continuously using the ViaFriction (VF) device at
slip ratio  and test speed
  km/h, as well as by a stationary method using
the British Pendulum Tester (BPT) with measurement points spaced every 100 m.
Simultaneously, the Mean Profile Depth (MPD) of pavements was measured using a
laser profilometer attached to the VF device in front of the test wheel. The
study investigated the correlation between friction coefficient values obtained
by continuous and stationary methods. Additionally, assuming that BPT readings
correspond to pavement microtexture and MPD values represent the macrotexture
[15], a linear regression method was used to determine the relationship between
ViaFriction readings and the PTV values (BPT
readings) and MPD of the tested road sections. The friction coefficient
predicted in this way showed very good agreement with the friction coefficient
determined using ViaFriction.
km/h, as well as by a stationary method using
the British Pendulum Tester (BPT) with measurement points spaced every 100 m.
Simultaneously, the Mean Profile Depth (MPD) of pavements was measured using a
laser profilometer attached to the VF device in front of the test wheel. The
study investigated the correlation between friction coefficient values obtained
by continuous and stationary methods. Additionally, assuming that BPT readings
correspond to pavement microtexture and MPD values represent the macrotexture
[15], a linear regression method was used to determine the relationship between
ViaFriction readings and the PTV values (BPT
readings) and MPD of the tested road sections. The friction coefficient
predicted in this way showed very good agreement with the friction coefficient
determined using ViaFriction.
2. SKID RESISTANCE PROPERTIES OF ROAD PAVEMENTS
2.1. Coefficient of Friction and Road Surface
Texture
Frictional properties between a tire and road pavement
are a key factor that must be taken into account in the design of safe
transport infrastructure. Friction generated at the tire-road interface arises
from two primary mechanisms: adhesion and hysteresis of rubber. Adhesion
results from molecular interactions between vehicle tire rubber and the surface
of the pavement. Microtexture plays a significant
role due to contact with coarse aggregate particles in the mixture. Adhesion is
primarily responsible for friction on dry and smooth surfaces. Hysteresis, on
the other hand, stems from energy losses caused by deformation of a tire. It
dominates on wet and rough pavements and is mainly influenced by the
macrotexture of the surface [19].
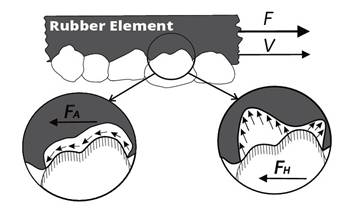
Fig. 1. Key mechanisms of pavement-tire friction [20]
Skid resistance of pavements
can be described using the friction coefficient (μ), a dimensionless parameter defined as the ratio of
frictional force to regular force acting at a tire-pavement contact area. It is
a fundamental parameter for road safety, influencing, among other things,
braking distance and vehicle behavior on curves or during maneuvers [21]:

where: µ – friction
coefficient [–], F – friction
force [N],  – vertical load [N].
The frictional performance of
road pavements is influenced by various factors, which may be categorized into
four main groups: pavement characteristics, vehicle operating parameters, tire
properties, and environmental conditions. Pavement characteristics are
primarily described by surface texture. The World Road Association (PIARC)
defines texture in terms of wavelength as deviation of surface ordinates from a
theoretically flat surface, and distinguishes three primary scales of texture: microtexture, macrotexture, and megatexture.
Microtexture corresponds to wavelengths in the range
of 0 to 0.5 mm. It is directly associated with mineralogical composition of
aggregate and is dependent on the resistance of coarse aggregate to polishing. Microtexture is critical in enabling the disruption of a
water film present at the tire-pavement interface.
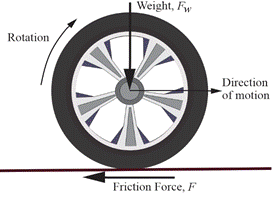
Fig. 2. Simplified diagram of
forces acting on a rotating wheel [20]
Macrotexture is determined by
the type of asphalt mixture and, in case of concrete pavements, by a texturing
technique applied. The wavelength of macrotexture falls within the range of 0.5
mm to 50 mm. It is responsible for facilitating water drainage from the
pavement surface, thereby reducing the likelihood of aquaplaning [22].
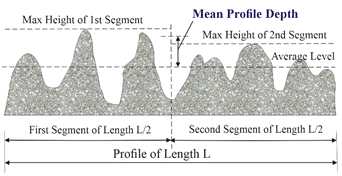
Fig. 3. Average value of the
profile depth of the tested section [23,24]
The assessment of pavement skid resistance is not solely based on
measurement of the friction coefficient. It requires knowledge of both
macrotexture and microtexture. Macrotexture can be
determined using the volumetric method as Mean Texture Depth (MTD), or by a
profilometric approach as Mean Profile Depth (MPD), calculated as the average
value across individual surface segments [23]. The microtexture
of the road surface may be assessed indirectly by specifying the corresponding
BPN value, since the measurement results obtained using the BPT depend
primarily on the microtexture of the tested surface
[15,18].
2.2. Devices for Testing the Coefficient of
Friction
To evaluate skid resistance under real-world conditions, four primary groups of
measurement devices are distinguished [25]:
·
Side-force testers, which measure frictional forces
acting perpendicular to the plane of the test wheel, inclined at an angle of
7.5° to 20° relative to the movement direction (e.g., SCRIM, Mu-Meter, Stradograf);
·
Fixed slip devices, which measure frictional forces
acting on a test wheel aligned with the movement direction at constant slip
ratio (e.g., GripTester, TWO);
·
Variable slip devices, which measure frictional forces
acting on a test wheel aligned with the movement direction with variable slip
ratio (e.g., ROAR, Petra, ViaFriction);
·
Locked-wheel testers, which measure frictional forces
acting on a fully locked test wheel aligned with the movement direction (e.g., Adhera, SRT-3).
Under European practice, the most commonly used devices belong to
the “side-force” and “fixed slip” categories. These systems allow for
continuous measurement of the friction coefficient while the test wheel moves
across the pavement surface at defined slip ratio. Moreover, devices operating
with fixed slip between 12% and 20% are particularly well-suited for simulating
real braking conditions of vehicles equipped with ABS (Anti-lock Braking
Systems) [20]. Due to a wide variety of measurement devices, ongoing efforts
are focused on identifying correlations between results obtained using
different systems and on harmonizing measurement procedures.
3.
RESEARCH PROGRAMME
3.1. Device
The British Pendulum Tester (BPT) is the most widely
recognized device in the world for measuring pavement skid resistance
properties. It simulates friction measurement with a fully locked wheel at a
slip speed close to 10 km/h [18]. The test is conducted in accordance with
international standards ASTM E303 [26] and EN 13036-4 [27]. The result is
expressed as the Pendulum Test Value (PTV), which is the average of five tests
and quantifies the energy loss as a rubber slider edge is drawn over a 126 mm
test surface. Prior to testing, the surface must be cleaned and wetted.
Stationary pendulum testing under real-world conditions is time-consuming due
to the need to calibrate the device at each measurement point, which requires
occupying a traffic lane.
The method for assessing skid resistance of road
pavement using the ViaFriction device is based on
evaluating road pavement resistance to slip in wet conditions by measuring
longitudinal friction coefficient number (LFCN). Measurements are conducted
using an electrically braked test wheel, which moves along the road
surface at a controlled speed. The test wheel is aligned parallel to the
direction of travel and perpendicular to the road surface [28]. Additionally,
the ViaFriction system is equipped with a laser
module for measuring macrotexture of the pavement. This module is mounted in
front of the test wheel and enables measurement of mean profile depth (MPD) on
dry pavement, within the same track where friction measurement is performed.
This procedure complies with the requirements set out in EN ISO 13473-1
standard [24].
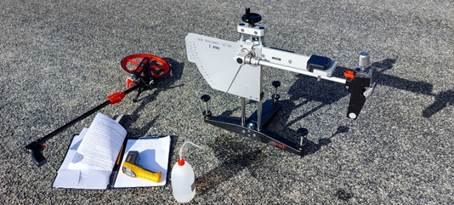
Fig. 4. British Pendulum Tester
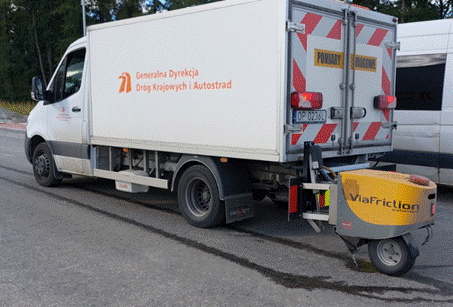
Fig. 5. ViaFriction
In contrast to point sampling methods, which carry the
risk of overlooking local areas with low skid resistance, the ViaFriction system enables continuous measurement of the
friction coefficient. This allows for obtaining a detailed skid-resistance
profile across the entire road network and effectively identifying sections
with increased risk of skidding.
Tab.
1
Comparison of the
British Pendulum Tester and ViaFriction
|
Feature |
BPT |
ViaFriction |
|
Operational
mode |
stationary |
continuous |
|
Slip
ratio |
total
(100%) |
fixed
(~17.8%) |
|
Travel
speed |
0
km/h |
60
km/h |
|
Slip
speed at the contact |
~10
km/h |
~10.7
km/h |
|
Section
length |
local
measurements |
kilometers |
|
Costs |
low |
high |
|
Operation |
manual |
specialist |
|
Standard |
ASTM
E303, PN-EN 13036-4 |
ASTM
E2340 |
|
Application |
pavement,
passage, points |
roads,
road networks |
3.2. Test
Sections
At present,
Poland lacks dedicated test tracks, which has necessitated conducting
comparative measurements on roads with actual vehicular traffic. Measurement
sections are located on national roads managed by the General Directorate of
National Roads and Motorways, Opole Division. These sections have been selected
to represent technological diversity. The most commonly used asphalt mixture
for wearing courses of roads with medium to high traffic volumes is SMA (Stone
Mastic Asphalt). Conversely, the asphalt mixture AC (Asphalt Concrete) is
predominantly applied to pavements subject to lower traffic volumes.
Table 2
summarizes road sections selected for the study, including their locations,
lengths of measurement segments, and a number of measurement points in case of
tests conducted using the BPT. Table 3 presents pavement material
characteristics of the tested road sections.
Tab.
2
List of road sections used for tests
|
No. |
No. of road |
Description of the section |
Location on road [km+m] |
No. of measure-ment
points |
Dis-tance [m] |
Symbol |
|
|
beginning |
end |
||||||
|
1 |
DK 94 |
Brzeg - Łosiów |
146+800 |
147+900 |
12 |
1100 |
Brz–Los |
|
2 |
DK 46k |
Niemodlin Bypass, right side, slow lane |
6+400 |
7+500 |
12 |
1100 |
Nie_byp |
|
3 |
DK 46 |
Nysa - Pakosławice,
right side, slow lane |
56+850 |
57+650 |
9 |
800 |
Nys–Pak_sl |
|
4 |
DK 46 |
Nysa - Pakosławice,
left side, fast lane |
57+650 |
56+850 |
9 |
800 |
Nys–Pak_fa |
|
5 |
DK 46j |
Myślina Bypass |
1+400 |
2+300 |
10 |
900 |
Mys_byp |
|
6 |
DK 39 |
Lubsza - Rogalice |
61+000 |
62+000 |
11 |
1000 |
Lub–Rog |
Tab.
3
Pavement characteristics of the tested road sections
|
Symbol |
Technology |
Traffic category |
||
|
pavement mix type |
type of asphalt |
type of aggregate |
||
|
Brz–Los |
SMA 11 |
PMB 45/80-55 |
gabbro with graywacke/basalt |
KR 5-6 |
|
Nie_byp |
SMA 11 |
PMB 45/80-65 |
amphibolite, basalt, granite |
KR 5-6 |
|
Nys–Pak_sl |
SMA 11 |
PMB 45/80-65 |
gabbro |
KR 5-6 |
|
Nys–Pak_fa |
SMA 11 |
PMB 45/80-65 |
gabbro |
KR 5-6 |
|
Mys_byp |
SMA 8 |
PMB 45/80-55 |
gabbro |
KR 5 |
|
Lub–Rog |
AC 11 |
50/70 |
gabbro |
KR 3-4 |
4. RESULTS
The conducted study aimed to determine the
relationship between the measured values of PTV and MPD, and the friction
coefficient obtained using the ViaFriction (VF)
device. In order to assess the correlation between the obtained results, they
were presented in pairs in graphical form and Pearson correlation coefficients
( ) were determined for them. The strength of the
relationship between the analysed variables was interpreted according to the
following thresholds:
) were determined for them. The strength of the
relationship between the analysed variables was interpreted according to the
following thresholds:
·
| | ≥ 0.9 – very strong correlation,
·
0.9 > | | ≥ 0.7 – strong correlation,
·
0.7 > | | ≥ 0.5 – moderate correlation,
·
0.5 > | | ≥ 0.3 – weak correlation,
·
| | < 0.3 – negligible correlation.
As mentioned earlier, all the tested road sections had
pavements made of asphalt mixtures, but only four of them were of the same
type, featuring stone mastic asphalt (SMA11) pavement. Therefore, the analysis
of the results was conducted in two stages: first, correlations were assessed
for all tested sections, and subsequently, correlation was evaluated
exclusively for those surfaced with the SMA11 mixture. This approach aimed to
assess the influence of pavement type on the observed dependencies.
4.1.
Dependencies VF-PTV and VF-MPD
The data
points shown in Fig. 6 and Fig. 7 are plotted using different markers depending
on the road section they represent. The coordinates of these points correspond
to: the x-axis – PTV values (Fig. 6) or MPD values (Fig. 7), and the y-axis –
the friction coefficient values obtained using the VF device. Both figures also
include a line representing linear approximation of the measurement results
(solid line), described by an equation:

where: – the
friction coefficient obtained from the VF device;  – the
values of either PTV or MPD; a and b – the slope and intercept of the line,
respectively. Approximation was performed using the least squares method,
employing the Levenberg-Marquardt optimization algorithm implemented in MATLAB.
– the
values of either PTV or MPD; a and b – the slope and intercept of the line,
respectively. Approximation was performed using the least squares method,
employing the Levenberg-Marquardt optimization algorithm implemented in MATLAB.
The dashed
lines shown in the figures represent lines obtained by shifting linear
approximation lines by the value of the standard deviation  and
and  , respectively. The ranges between these lines
correspond to the areas within which ~68% and ~95% of the values of a normally
distributed random variable
, respectively. The ranges between these lines
correspond to the areas within which ~68% and ~95% of the values of a normally
distributed random variable  are
expected to fall. The standard
deviation of the residuals was determined according to the equation:
are
expected to fall. The standard
deviation of the residuals was determined according to the equation:
 (3)
(3)
Additionally, the relative standard deviation of the
residuals was calculated using the formula:
 , (4)
, (4)
where  is the mean value of the friction coefficient.
It should be noted that reporting only the correlation
coefficient r may not be sufficient
for an unequivocal assessment of the relationships’ strength, as the compared
values are subject to measurement errors. Therefore, the correlation
coefficient should be analyzed together with its confidence interval. A summary
of the Pearson coefficients, including the 95% confidence intervals for all
analyzed relationships, is presented in Table 4.
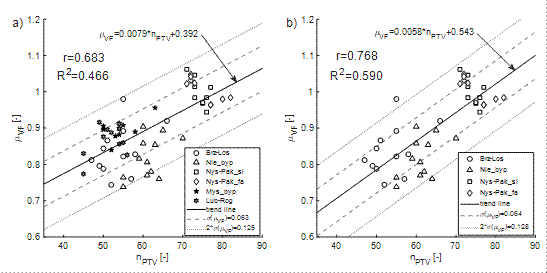
Fig. 6.
Dependence between the BPT and VF results: a) all pavements, b) SMA11 only
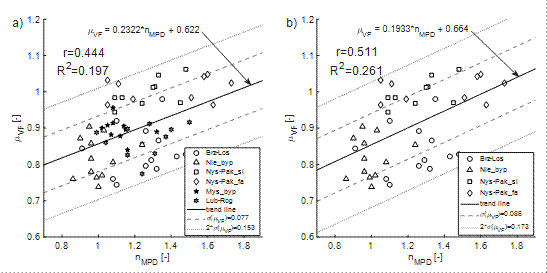
Fig. 7.
Dependence between the MPD and VF results: a) all pavements, b) SMA11 only
Tab.
4
Pearson correlation
coefficients R with 95% confidence intervals
|
Analyzed Pavement Types |
Correlation Pair |
95% CI Upper Limit |
Pearson's |
95% CI Lower Limit |
|
ALL |
PTV⟷VF |
0.796 |
0.683 |
0.523 |
|
MPD⟷VF |
0.623 |
0.444 |
0.220 |
|
|
SMA11 |
PTV⟷VF |
0.853 |
0.768 |
0.642 |
|
MPD⟷VF |
0.673 |
0.511 |
0.301 |

Comparing the Pearson correlation coefficients
presented in Tab. 4, stronger correlations can be observed from the analyses
conducted solely for SMA11 pavements ( ) than for all
the investigated road sections (
) than for all
the investigated road sections ( ). However,
the reduction in the correlations’ strength is not substantial. Greater
differences in Pearson coefficients are observed when comparing the VF-PTV and
VF-MPD correlations: while the correlation between PTV and values can be considered moderate to strong,
the correlation between MPD and
). However,
the reduction in the correlations’ strength is not substantial. Greater
differences in Pearson coefficients are observed when comparing the VF-PTV and
VF-MPD correlations: while the correlation between PTV and values can be considered moderate to strong,
the correlation between MPD and  is at best
weak. This is also reflected in the relative standard deviation values,
is at best
weak. This is also reflected in the relative standard deviation values,  , which are ~7% for the
  correlation and ~9% for the
 correlation. Additionally, when considering
the lower limit of the 95% confidence interval for the MPD-VF pairs, it can be
observed that although the Pearson correlation coefficient r indicates a moderate (SMA11) or weak (ALL) correlation, the lower
limit of the confidence interval for this data pair (equal to 0.301 and 0.220,
respectively) falls within the range corresponding to the insignificant
correlation. Whereas an analogous analysis performed for the PTV-VF pairs
indicates a moderate level of correlation strength (with the lower limit of the
confidence interval equal to 0.523 for ALL and 0.642 for SMA11).
correlation. Additionally, when considering
the lower limit of the 95% confidence interval for the MPD-VF pairs, it can be
observed that although the Pearson correlation coefficient r indicates a moderate (SMA11) or weak (ALL) correlation, the lower
limit of the confidence interval for this data pair (equal to 0.301 and 0.220,
respectively) falls within the range corresponding to the insignificant
correlation. Whereas an analogous analysis performed for the PTV-VF pairs
indicates a moderate level of correlation strength (with the lower limit of the
confidence interval equal to 0.523 for ALL and 0.642 for SMA11).
The above conclusions confirm that it is not possible
to unequivocally infer the friction coefficient values of a given pavement
based solely on MPD measurement results. However, they can provide useful
information if incorporated into the analysis of BPT test results.
4.2. Dependence
between Friction Coefficient  and MPD and PTV values
To identify
the relationship  , linear regression analysis was employed in
order to determine an expression for the friction coefficient in the following
form:
, linear regression analysis was employed in
order to determine an expression for the friction coefficient in the following
form:
 (5)
(5)
where the dependent variable  represents the fitted value of the friction
coefficient, and the independent variables
represents the fitted value of the friction
coefficient, and the independent variables  and
and  correspond to the values obtained from
measurements using the BPT (PTV) and the profilometer (MPD), respectively. The
coefficients c, d, and e denote the
regression slopes and the intercept. The results of this analysis are presented
in Fig. 8 as surfaces fitted to the measurement points for all analyzed
pavements
correspond to the values obtained from
measurements using the BPT (PTV) and the profilometer (MPD), respectively. The
coefficients c, d, and e denote the
regression slopes and the intercept. The results of this analysis are presented
in Fig. 8 as surfaces fitted to the measurement points for all analyzed
pavements  and for
the SMA11 pavement sections only
and for
the SMA11 pavement sections only  .
.
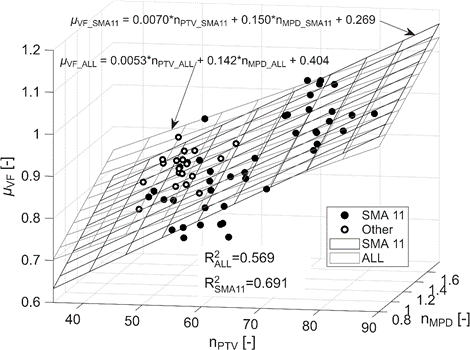
Fig. 8.
Linear regression of the test results
In the case of multiple regression, the Pearson
correlation coefficient cannot be used to assess the regression model. In such
a case, the model fit is described using the coefficient of determination  , which, for
simple linear regression with one explanatory variable (as in Section 4.1), is
equal to the square of the Pearson correlation coefficient
, which, for
simple linear regression with one explanatory variable (as in Section 4.1), is
equal to the square of the Pearson correlation coefficient  . Hereinafter,
it was assumed that the following values of the coefficient of determination
indicate the degree of model fit to the data as follows:
. Hereinafter,
it was assumed that the following values of the coefficient of determination
indicate the degree of model fit to the data as follows:
·
 – very good fit,
·
 – good fit,
·
 – moderate fit,
·
 – weak fit,
·
 – no fit.
To facilitate the analysis of the results, they have
been presented in the form of single-variable functions (Fig. 9), where the
vertical axis represents the friction coefficient values
obtained from the VF measurements, and the horizontal axis corresponds to the values derived from linear
regression. As in Fig. 6 and Fig. 7, the diagram also includes the best-fit
regression line (solid line) and standard deviations of the approximation
residuals (dashed lines). A summary of the coefficients of determination for
the individual regression models, together with the relative standard
deviations of the residuals, is presented in Tab. 5.
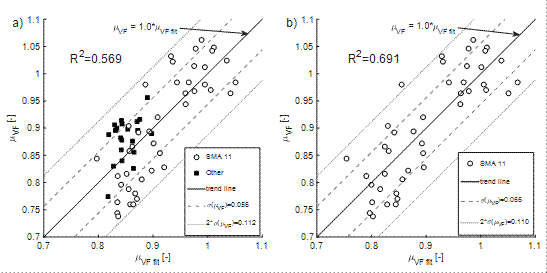
Fig. 9.
Dependence between the results from VF and the linear regression:
a) all
pavements, b) SMA11 only
Tab.
5
Coefficient of determination and relative standard deviation of residuals
|
Analyzed Pavement Types |
Regression
Model |
Pearson's
|
Coefficient of determination R 2 |
RSD of
residuals |
|
PTV⟷VF |
0.683 |
0.466 |
7.1% |
|
|
MPD⟷VF |
0.444 |
0.197 |
8.7% |
|
|
(PTV+MPD) ⟷VF |
− |
0.569 |
6.4% |
|
|
SMA11 |
PTV⟷VF |
0.768 |
0.590 |
7.3% |
|
MPD⟷VF |
0.511 |
0.261 |
9.8% |
|
|
(PTV+MPD) ⟷VF |
− |
0.691 |
6.3% |
The obtained coefficients of determination indicate an
improvement in the model fit when multiple regression, , is applied,
compared with models using a single explanatory variable,  and
and  . In the case
of simple linear regression models, their fit to the data is generally moderate
or even weak. The only exception is the model for SMA11, for which the fit may be
considered good
. In the case
of simple linear regression models, their fit to the data is generally moderate
or even weak. The only exception is the model for SMA11, for which the fit may be
considered good  . For models
including two explanatory variables, the fit is consistently good
. For models
including two explanatory variables, the fit is consistently good  , as also
evidenced by the low values of the residual standard deviation, amounting to
6.4% and 6.3%, respectively.
, as also
evidenced by the low values of the residual standard deviation, amounting to
6.4% and 6.3%, respectively.
The above analysis can be regarded as confirmation
that the PTV and MPD parameters characterize the properties of the examined
pavements at different scales
(e.g., micro and macro) [15]. Considering both parameters simultaneously allows
for a more comprehensive assessment of the influence of pavement texture on its
friction coefficient [12,18].
5.
CONCLUSIONS
The paper presents the results of studies on the
friction coefficient of road pavements, and PTV, measured respectively using
continuous measurement device (ViaFriction) and point measurements (British
Pendulum Tester), as well as the key parameter characterizing pavement texture
— MPD [18], obtained using a laser profilometer. Six road sections, each
approximately 1 km in length and surfaced with asphalt mixtures, were selected
for the study, including four sections with the SMA11 (stone mastic asphalt)
pavement, one with the SMA8 pavement, and one with AC11 (asphalt concrete)
pavement. On the selected road sections, PBT measurements were taken at points
spaced every 100 m. Subsequently, correlation analyses were conducted between
the and PTV datasets, and between the and MPD datasets, performing the analysis
twice: once for all selected road sections and once only for the SMA11 pavement
sections.
The Pearson correlation coefficients obtained in this
way indicate a strong correlation between the friction coefficients and PTV for the SMA11 pavements ( ) and a
moderately strong correlation (
) and a
moderately strong correlation ( ) between the
measurement datasets for all analysed road sections. The obtained Pearson
coefficients at this level contradict the conclusion presented in [3], which
suggested that results obtained using ViaFriction and BPT exhibit low
correlation and that different measurement methods show significant
inconsistency. Reference [17] also reported a good correlation between test
results obtained using the BPT and another continuous measurement device – the
GripTester, operating at a constant slip of .
) between the
measurement datasets for all analysed road sections. The obtained Pearson
coefficients at this level contradict the conclusion presented in [3], which
suggested that results obtained using ViaFriction and BPT exhibit low
correlation and that different measurement methods show significant
inconsistency. Reference [17] also reported a good correlation between test
results obtained using the BPT and another continuous measurement device – the
GripTester, operating at a constant slip of .
Higher Pearson correlation coefficients obtained from
the analysis of data concerning only one pavement type (SMA11) confirm the
absence of a universal relationship between pavement texture and friction
forces – this relationship has an individual character depending on the
pavement type [18]. The results also align with the assertion that the
frictional properties of asphalt pavements are largely determined by the type
and quality of the coarse aggregates used [5].
Subsequently,
using multiple regression analysis, a relationship was found between the
friction coefficient and the values of PTV and MPD. The
determination coefficients obtained from this approach indicate that including
the MPD dataset in the analysis alongside the PTV values significantly improves
the correlation between these data and the friction coefficients measured by VF
( ;
;  ), which is accompanied by a
reduction in the relative standard deviation of the residuals by approximately
1% (
), which is accompanied by a
reduction in the relative standard deviation of the residuals by approximately
1% ( ;
;  ). Since MPD
is a parameter describing the pavement’s macrotexture, while PTV is mainly
related to microtexture properties [18], it can be inferred that the friction
coefficient of a road can be accurately predicted only by models incorporating
variables describing pavement texture at both micro and macro scales. This
conclusion is consistent with the findings of other researchers [12,18].
). Since MPD
is a parameter describing the pavement’s macrotexture, while PTV is mainly
related to microtexture properties [18], it can be inferred that the friction
coefficient of a road can be accurately predicted only by models incorporating
variables describing pavement texture at both micro and macro scales. This
conclusion is consistent with the findings of other researchers [12,18].
References
1.
Kane Malal, Veronique Cerezo. 2015. „A contribution to
tire/road friction modeling: From a sim-plified dynamic frictional contact model to a „Dynamic
Friction Tester” model”. Wear
342-343: 163-171. DOI: https://doi.org/10.1016/j.wear.2015.08.007.
2.
Suhaimi Aminuddin, Abdul Rahman Baharuddin. 2019.
„Threshold value of skid resistance and texture depth for Malaysia road”. IOP Conference Series: Materials Science and
Engineering 512: 012035. DOI:
https://doi.org/10.1088/1757-899X/512/1/012035.
3.
Wei Jincheng, Zhengchao
Zhang, Yulin He, Qianwen Tan, Xiangpeng
Yang, Dawei Wang, Markus Oeser. 2022. „Study on the skid resistance
deterioration behavior of the SMA pavement”. Sustainability 14: 2864. DOI: https://doi.org/10.3390/su14052864.
4.
Wang Yan, Jingyu Hu, Fa’an
Wang, Haoxuan Dong, Yongjun Yan, Yanjun Ren, Chaobin
Zhou, Guodong Yin. 2022. „Tire road friction
coefficient estimation: Review and research perspectives”. Chinese Journal of Mechanical Engineering 35: 6. DOI:
https://doi.org/10.1186/s10033-021-00675-z.
5.
Kogbara Reginald, Eyad Masad,
Emad Kassem, Tom Scarpas, Kumar Anupam. 2016. „A state-of-the-art review
of parameters influencing measurement and modeling of skid resistance of
asphalt pavements”. Construction and
Building Materials 114: 602-617. DOI:
https://doi.org/10.1016/j.conbuildmat.2016.04.002.
6.
Kageyama Ichiro, Yukiyo Kuriyagawa, Tetsunori Haraguchi, Tetsuya Kaneko, Minoru
Nishio, Atsushi Watanabe. 2022. „Study on road friction database for traffic
safety: Construction of a road friction-measuring device”. Inventions 7(4): 90. DOI:
https://doi.org/10.3390/inventions7040090.
7.
Alamdarlo Mohsen, Saeid Hesami.
2020. „Measuring the effect of pavement porosity filling on skid resistance by
numerical model and field test”. Measurement
152: 107269. DOI: https://doi.org/10.1016/j.measurement.2019.107269.
8.
Grigoriadis Kyriakos, Georgios Mavros, James Knowles,
Antonios Pezouvanis. 2023. „Experimental investigation of tyre-road
friction considering topographical roughness variation and flash temperature”. Tribology International 181: 108294.
DOI: https://doi.org/10.1016/j.triboint.2023.108294.
9.
Persson Bo N.J. 2001. „Theory of rubber friction and
contact mechanics”. The Journal of
Chemical Physics 115(8): 3840-3861. DOI: https://doi.org/10.1063/1.1388626.
10. Leontiev
Dmytro, Smetanin German, Volodin Valerij, Malyi
Viktor, Riabushenko Oleksandr, Tovt
Bogdan. 2025. “Methods for Calculating Utilized Adhesion Between a Vehicle
Tire and the Road Surface”. Vehicle and Electronics. Innovative Technologies
28: 25-36. DOI: https://doi.org/10.30977/VEIT.2025.28.0.3.
11. Deng Qiangsheng, Zhan
You, Liu Cheng, Qiu Yanjun, Zhang Allen. 2021. „Multiscale power spectrum
analysis of 3D surface texture for prediction of asphalt pavement friction”. Construction and Building Materials 293:
123506. DOI: https://doi.org/10.1016/j.conbuildmat.2021.123506.
12. Ergun Murat, Sukriye Iyinam, Faik Iyinam.
2005. „Prediction of road surface friction coefficient using only macro- and microtexture measurements”. Journal of transportation engineering 131(4): 311-319. DOI:
https://doi.org/10.1061/(ASCE)0733-947X(2005)131:4(311).
13. Kováč Matúš, Matej Brna, Martin Decký. 2021. „Pavement friction
prediction using 3D texture parameters”. Coatings
11(10): 1180. DOI: https://doi.org/10.3390/coatings11101180.
14. Giles C.G., B.E. Sabey,
K.H.F. Cardew. 1965. „Development and performance of the portable skid
resistance tester”. Rubber Chemistry and
Technology 38(4): 840-862. DOI: https://doi.org/10.5254/1.3535703.
15. Kotek Peter, Matúš
Kováč. 2015. „Comparison of valuation of skid resistance of pavements by two
device with standard methods”. Procedia
Engineering 111: 436-443. DOI:
https://doi.org/10.1016/j.proeng.2015.07.113.
16. Jalalkamali Reza, Mohammad Mahdi Dibaee, Mohammad Hossain Jalal
Kamali, Abolfazl Hassani. 2021. „An investigation of the relationship among
skid resistance, mean texture depth and abrasion resistance for different
macrotextures of concrete pavements”. Civil
Engineering Infrastructures Journal 54(2): 301-317. DOI: https://doi.org/10.22059/ceij.2020.297661.1656.
17. eScholarship. University of California Pavement Research Center.
UC Davis Lu Qing, Steven Bruce. 2006.
„Friction testing of pavement preservation treatments: Literature review”. Available at:
https://escholarship.org/uc/item/3jn462tc.
18. Zuniga-Garcia Natalia, Jorge A. Prozzi. 2019. „High-definition field texture measurements for
predicting pavement friction”. Transportation
Research Record 2673(1): 246-260. DOI: https://doi.org/10.1177/0361198118821598.
19. Łądkiewicz-Krochmal Katarzyna. 2020.
„Współczynnik tarcia nawierzchni – analiza zagadnień, urządzenia pomiarowe”. Drogownictwo 2: 35-44. [In Polish:
„Surface friction coefficient - analysis of issues, measurement devices”. Road Engineering].
20. Hall J.W., K.L. Smith,
L. Titus-Glover, J.C. Wambold, T.J. Yager, Z. Rado. 2009. „Guide for pavement
friction”. Final Report for NCHRP Project
01-43, Washington: The National Academies Press. DOI:
https://doi.org/10.17226/23038.
21. Mohammad Diana Jumah, Mohammed
Qadir Ismael. 2021. „Evaluating the friction characteristics of pavement
surface for major arterial road”. Civil
Engineering Journal 7(12): 2011-2029. DOI: 10.28991/cej-2021-03091775.
22. Bukowski Leszek. 2017.
„Zagadnienia dotyczące współczynnika tarcia na nawierzchni jezdni”. Drogownictwo 10: 337-344. [In
Polish: „Issues concerning the coefficient of friction on the road surface”. Road Engineering].
23. Kouchaki Sareh, Hossein Roshani, Jorge A. Prozzi, Natalia Zuniga Garcia,
Joaquin Bernardo Hernandez. 2018. „Field investigation of relationship between
pavement surface texture and friction”. Transportation
Research Record 2672(8): 395-407. DOI: https://doi.org/10.1177/0361198118780955.
24.
PN-EN ISO 13473-1:2019-04. Charakterystyka tekstury nawierzchni przy użyciu profili powierzchniowych
– Część 1: Określanie średniej głębokości profilu. Warszawa: Polski Komitet Normalizacyjny. [In Polish: PN-EN ISO 13473-1:2019-04. Characterization of pavement texture using
surface profiles – Part 1: Determination of the mean profile depth. Warsaw:
Polish Committee of Standardization].
25. Wasilewska Marta, Władysław Gardziejczyk, Paweł Gierasimiuk,
Marek Motylewicz. 2015. „Przegląd urządzeń do oceny
właściwości przeciwpoślizgowych nawierzchni drogowych”. In: LVIII the
Conference „Technical Road Days”: 49-63. Association of
Communication Engineers and Technicians of the RP, National Board, Warsaw,
Poland. 18-20 November 2015, Białystok, Poland. ISBN: 978-83-7789-244-2. [In Polish: „Review of devices for
assessing the anti-skid properties of road surfaces”].
26. ASTM E303-22:2022. Standard Test Method for Measuring Surface
Frictional Properties Using the British Pendulum Tester. West Conshohocken, USA: ASTM International.
27.
PN-EN 13036-4:2011. Drogi samochodowe i lotniskowe –
Metody badań – Część 4: Metoda pomiaru oporów poślizgu/poślizgnięcia na
powierzchni: Próba wahadła. Warszawa: Polski Komitet Normalizacyjny. [In
Polish: PN-EN 13036-4:2011. Roads and
airports – Test methods – Part 4: Method of measuring the slip/skid resistance
on the surface: Pendulum test. Warsaw: Polish
Committee of Standardization].
28. CEN/TS 15901-14:2016. Road and airfield surface characteristics –
Part 14: Procedure for determining the skid resistance of a pavement surface
using a device with longitudinal controlled slip (LFCN): ViaFriction
(Road Analyser and Recorder of ViaTech
AS). Geneva: European Committee for Standardization.
Received 30.12.2025; accepted in revised form 19.05.2026

Scientific Journal of Silesian
University of Technology. Series Transport is licensed under a Creative
Commons Attribution 4.0 International License