Article
citation information:
Bąk, M., Borkowski, P., Zamojska,
A. Shifting
tracks in regional rail: unpacking stakeholder attributes and perceived
connectivity. Scientific Journal of
Silesian University of Technology. Series Transport. 2026, 131, 45-61. ISSN: 0209-3324. DOI: https://doi.org/10.20858/sjsutst.2026.131.3
Monika BĄK[1],
Przemysław BORKOWSKI[2], Anna
ZAMOJSKA[3]
SHIFTING TRACKS IN
REGIONAL RAIL: UNPACKING STAKEHOLDER ATTRIBUTES AND PERCEIVED CONNECTIVITY
Summary. This study examines how
perceptions of stakeholder salience shape user attitudes and behaviors towards the Pomeranian Metropolitan Railway (PKM)
in northern Poland, focusing on the moderating role of transportation
connectivity. Utilizing repeated cross-sectional survey data collected in 2019,
2020, and 2021, the study analyzes how user
perceptions of power, legitimacy, and urgency impact attitudes and rail usage behavior. The results highlight a significant shift in the
moderating effect of perceived connectivity, which transitioned from a positive
influence in 2020 to a negative one in 2021, indicating increasing
disillusionment with the rail system’s responsiveness to users’ expectations.
This study provides key insights into how external disruptions, such as the
COVID-19 pandemic, interact with connectivity perceptions to influence regional
rail usage patterns.
Keywords: stakeholder attributes, railway usage; connectivity, pandemic impact
1. INTRODUCTION
The
increasing demand for sustainable urban and regional mobility has prompted
cities and regions across Europe to invest in modern public transport systems
that not only reduce environmental impact but also support spatial cohesion and
economic development. One of the most prominent examples of such investment in
Poland is the Pomeranian Metropolitan Railway (PKM), launched in 2015 to
improve connectivity within the Tricity metropolitan area and the broader
Pomeranian Voivodeship. The light rail and regional rail could be considered an
alternative to road connectivity in cities and their metropolitan areas. While
infrastructure development and service integration have been key components of
PKM’s success, less attention has been paid to the behavioral
determinants influencing individual usage of this rail system over time. The
role of behavior in modal choices and travel
decisions could be investigated through the lens of the Stakeholder Salience
Theory (SST). While a more frequent approach is to apply Theory of Planned Behavior (TPB)
Few
empirical studies have demonstrated the efficacy of approaches based on behavioral models in predicting rail travel users' actions.
For instance, research in Klang Valley, Malaysia, indicated that, except for
typical TPB drivers, other external factors of trust and novelty seeking behavior significantly influenced commuters' intentions to
use the Light Rail Transit (LRT) system
Neither
of the rail-oriented studies utilizing the traditional TPB approach has looked
into the longer periods, and none has been based on the repetitive data
collection over the years.
This
paper aims to apply different Stakeholder Salience Theory (STT) based models to
assess the factors influencing passenger behavior and
usage of regional rail in a more comprehensive way. The empirical foundation of
the current study comprises three field surveys conducted in 2019, 2021, and
2023, respectively. These cross-sectional analyses utilized structured
questionnaires to gather data on passenger attitudes, intentions, and actual
use of the PKM, allowing for longitudinal insights into how behavioral
patterns evolved before, during, and after the COVID-19 pandemic. The temporal
span of the research enables the identification of both persistent and
context-sensitive behavioral trends, particularly in
response to broader socio-environmental changes such as lockdowns or rising
environmental awareness.
The
findings will contribute to a deeper understanding of the psychological
determinants of rail travel behavior. In addition,
current research looks into the broad perspective of pre-, during, and
after-COVID-19 pandemic situations. While there are some studies looking into
rail user behavior during pandemics
By
combining theoretical modeling with empirical data
from the PKM case, this study contributes to behaviorally
informed transport planning. It aims to inform decision-makers about the
psychological and contextual factors that condition rail usage and to suggest
targeted interventions for increasing user adoption in the context of expanding
rail networks in metropolitan areas.
2.
CONCEPTUAL
FRAMEWORK
In
this study, we draw on Stakeholder Salience Theory, developed by
Since
its initial formulation, SST has undergone extensive development, inspiring
hundreds of empirical and theoretical contributions. Scholars have validated
the core attributes empirically and explored their influence on decision-making
processes. Other studies have extended the theory by incorporating additional
dimensions such as contextual dynamics, emotions, and temporality
Although
SST was initially rooted in a managerial perspective—evaluating stakeholders
from the standpoint of organizational decision-makers—recent research has
increasingly explored how stakeholders perceive their salience. For instance, Boesso and Kumar examined how organizational culture
influences how managers perceive stakeholder salience, emphasizing the role of
subjective and context-specific interpretations
Our
study contributes to this evolving stream of research by applying SST in a
novel context: that of public infrastructure users, specifically commuters
using a newly launched regional rail service. We investigate how these users
view their role as stakeholders and whether such self-perceptions correlate
with their actual usage behavior. This approach
offers fresh insight for transport policy design, especially in encouraging
modal shifts from private cars to medium-range rail services, which are
integral to sustainable transport systems. We specifically ask whether users’
perceptions of power, legitimacy, and urgency influence the frequency with
which they use the rail service. More precisely, we aim to understand if these
perceptions are linked to a behavioral
transition—namely, a shift from car usage to commuting by train. While previous
studies have identified various behavioral,
organizational, and policy factors that promote sustainable transport and
reduce car dependency in urban commuting, we are unaware of research exploring
the connection between users' perceived stakeholder role in a transportation
project and their transportation behavior change. Our
study seeks to fill this gap in the literature.
Moreover,
we explore whether these stakeholder perceptions change over time. Although the
study is not longitudinal in design, data were collected across three separate
points (2019, 2020, and 2021), which span the COVID-19 pandemic period. This
design enables us to analyze temporal variations in
stakeholder self-perceptions.
Lastly,
we investigate the effect of a moderating variable. Understanding what factors
influence the relationship between stakeholder self-perception and actual behavior is crucial. In our context—a rail line connecting
small towns and suburban areas to the Tri-City metropolitan region—we identify
transport connectivity (SKOM) as a key moderator. This includes how well the
rail system is integrated with other modes of transport (e.g., buses, cycling
infrastructure) and the presence of park-and-ride or bike-and-ride facilities.
Numerous studies have shown that such integration significantly boosts public
rail usage across various global contexts
Based
on these considerations, our research hypotheses are as follows:
H1 –
Passenger attributes (power, legitimacy, and urgency) influence their attitude
(AT) toward the regional railway service (PKM).
H2 –
Attitude (AT) influences the frequency of using the regional railway service
(PKM).
H3 – The
relationship between attitude (AT) and the frequency of using PKM is moderated
by the level of intermodality between modes of
transport (SKOM).
Figure
1 presents the conceptual model that guides this study.
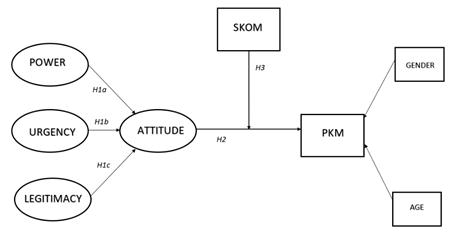
Fig. 1. Conceptual model
3.
RESEARCH METHOD
3.1.
Study Setting
The
Pomeranian Metropolitan Railway (Polish: Pomorska Kolej Metropolitalna,
PKM) represents the first new regional rail line in more than 20 years. Located
in the Pomeranian Voivodeship (Northern Poland on the Baltic coast), the PKM
was conceived to enhance regional mobility, particularly in the Gdansk
metropolitan area, and to facilitate multimodal integration with national and
international transport networks, including the Gdansk Airport. Commissioned in
September 2015, the PKM line spans approximately 20 kilometers.
The project's core objectives included relieving urban traffic congestion,
improving accessibility to peripheral areas, and providing sustainable
alternatives to road-based commuting. Notably, the railway provides direct,
high-frequency service between major cities in the region and the airport,
forming a semi-orbital connection that bypasses the traditional city-center bottlenecks. The key expected benefit of the rail
creation was to influence commuters' behavior. Like
in many metropolitan areas across the world, Gdansk witnessed the
suburbanization and commuting challenges caused by households' migration
towards the exterior.
The
PKM project was planned as a relief to the increasing daily congestion. In that
regard, PKM was rather a success. According to the Polish Railway Authority
(UTK) ridership numbers have risen from approximately 140 thousand at its
launch in 2015; it exceeded 3 million passengers by the end of 2018. The
average monthly ridership in 2019, just before the COVID-19 pandemic, was 386
thousand passengers. The year 2020 brought a pandemic and a decline in
ridership falling by more than 50%. In the following year, the slow recovery
began with the rail reaching its pre-COVID ridership in the second half of
2023. While COVID-19 had a strong impact on the ridership, the detailed
analysis of users' attitudes and actions reveals that it is a more complex set
of behavioral interactions that produced those
numbers before, during, and after the pandemic.
3.2.
Survey, Sample and Data Collection
The
study was conducted in the fall of three consecutive years: 2019, 2020, and
2021, specifically during September and October each year. This consistency in
timing allowed us to control for seasonal variation in travel behavior. The target population consisted of users of the
PKM railway service, and data were collected using the PAPI method (Paper and
Pencil Interviewing) in the vicinity of railway stations. The target sample
size each year was at least 500. After data cleaning, the final sample sizes
were N = 504 in 2019, N = 502 in 2020, and N = 500 in 2021.
It
is important to note that this study was not longitudinal in a strict sense, as
different individuals were surveyed in each wave. Therefore, it does not allow
for tracking individual-level changes over time
In
this study, we examine how perceptions of stakeholder salience shape users’
attitudes toward a regional railway service, and how these attitudes relate to
actual usage behavior. Drawing on Stakeholder
Salience Theory, we conceptualize these attributes as latent variables measured
through user self-report. Additionally, we investigate the moderating role of
transportation connectivity and control for sociodemographic characteristics.
The following table outlines the operational definitions and measurement
approaches used for each variable in the conceptual model.
Tab.
1
Operationalization of variables
|
Variable |
Type & Measurement |
Items / operational definitions |
|
Attitude |
||
|
AT1 |
Independent (latent) Likert-scale |
I had a
positive attitude toward the construction and launch of PKM |
|
AT2 |
Independent (latent) Likert-scale |
My
attitude toward the project implementation is clearly positive |
|
AT3 |
Independent (latent) Likert-scale |
Fast
implementation of the project was very important to me |
|
AT4 |
Independent (latent) Likert-scale |
Those
implementing the project could count on my support |
|
Power |
||
|
ATP1 |
Independent (latent) Likert-scale |
I had a
real influence on the project implementation |
|
ATP2 |
Independent (latent) Likert-scale |
I had the
right to be consulted about the project |
|
ATP3 |
Independent (latent) Likert-scale |
I believe
it was reasonable to consult me on the project |
|
ATP4 |
Independent (latent) Likert-scale |
Changes
to PKM (schedules/routes) depend on me |
|
Legitimacy |
||
|
ATL1 |
Independent (latent) Likert-scale |
I had the
right to be consulted on the project |
|
ATL2 |
Independent (latent) Likert-scale |
I believe
it was legitimate to consult me on the project |
|
ATL3 |
Independent (latent) Likert-scale |
Changes
to PKM (schedules/routes) depend on me |
|
Urgency |
||
|
ATU1 |
Independent (latent) Likert-scale |
In my
opinion, the project was an urgent matter |
|
ATU2 |
Independent (latent) Likert-scale |
My
attitude toward the project implementation is clearly positive |
|
SKOM (Connectivity) |
Moderator Likert-scale |
How would
you rate the level of connectivity between the PKM railway service and other
modes of transport? |
|
PKM Usage Frequency |
Dependent variable Likert-scale |
How often
do you use the PKM railway service in your daily travels? |
|
Gender |
Control
variable Binary: male/female |
|
|
Age |
Control variable Ordinal categorical |
|
3.3.
Analytical framework
The
study employed a diverse set of quantitative data analysis methods. During the
first stage of the analytical phase, variable distributions were assessed, and
proportions were calculated to capture the relative shares of individual
categories within the overall responses. To compare structural patterns between
two samples, a statistical test z, of the significance of differences between
proportions was applied. This test makes it possible to determine whether the
observed differences are statistically significant
Additionally,
the t Kendall nonparametric rank
correlation coefficient was used to evaluate ordinal and qualitative
relationships between selected variables. This method is robust to violations
of normality assumptions and particularly well-suited for analyzing
dependencies in ordinal data
The
main modeling procedure used partial least squares
structural equation modeling (PLS-SEM), implemented
with the PLS-SEM package and STATA 18 software
4.1.
Descriptive Statistics
Analyzing the data from Table 2, it is noteworthy that, according to the
established sampling scheme, the structure of respondents is equally weighted
in terms of gender. Across all studied years, the most significant number of
respondents falls within the age group of 19-25 years, followed by the age
category of 31-40 years. The age groups of 26-30 years and above 41 years are
relatively similar in size. The smallest proportion of respondents is in the
< 18 age group. Overall, the distribution of respondents across different
age groups indicates that younger age groups (< 18 years) are less
represented than older age groups.
Tab.
2
Structure
of the demographics of respondents (%)
|
Demographic |
2019 |
2020 |
2021 |
|
Gender |
|||
|
Male |
46.6 |
49.8 |
47.8 |
|
Female |
53.4 |
50.2 |
52.2 |
|
Age |
|||
|
< 18 |
5.4 |
7.3 |
3.0 |
|
19-25 |
31.1 |
24.0 |
27.4 |
|
26-30 |
14.5 |
14.7 |
11.8 |
|
31-40 |
20.9 |
23.4 |
24.0 |
|
41-50 |
13.9 |
16.3 |
18.6 |
|
>50 |
14.1 |
14.3 |
15.2 |
N = 504
for 2019, N = 502 for 2020, N =500 for 2021
4.2.
Dependent Variable PKM Comparative
Analysis for 3 Years
Analysis of the distribution of
daily travel using the Pomeranian Metropolitan Railway (PKM) is presented in
Table 3. In the first part of the comparative analysis, the shape of the
distribution was determined for the three consecutive years from 2019 to 2021.
Subsequently, using the test z for the significance of structural differences
between two populations, we examined whether significant changes occurred
between 2019 and 2021. Table 3 presents the distribution of responses and the
results of the test z. We observe a change in the case of individuals who
travelled daily on weekdays, with a decrease from 55.4% in 2019 to 41.2% in
2021, and the test z statistic confirms that this change is statistically
significant (0.002). Additionally, the category of individuals who occasionally
used PKM decreased from 14.1% to 7.6%, but this change is not statistically
significant. For the remaining categories, an increase was observed, with only
the category of individuals using PKM 3-4 times a week showing a statistically
significant increase in the structural index (0.045).
Table 3 presents the
distribution/structure of responses regarding the frequency of travel using the
Pomeranian Metropolitan Railway (PKM) between 2019 and 2021 and the results of
z-tests for structural differences between 2019 and 2021. In the first stage of
the analysis, the distributional patterns of PKM usage were identified across
the three years. Subsequently, z-tests were applied to assess whether the
observed changes between 2019 and 2021 were statistically significant. A
notable decrease was observed in the proportion of individuals commuting daily
on weekdays, from 55.4% in 2019 to 41.2% in 2021; this difference was
statistically significant (z = -3.05, p = 0.002). A statistically significant
increase was also recorded for individuals travelling 3-4 times per week,
rising from 14.1% to 26.4% (z=2.01, p=0.045). Although changes were noted in
other frequency categories, none of these differences reached statistical
significance.
Tab.
3
PKM usage in the years 2019-2021 and
the z-test results for 2019 and 2021
|
PKM variable |
Group |
2019 |
2020 |
2021 |
z-test |
p-value |
|
every weekday |
1 |
55.4 |
50.4 |
41.2 |
-3.05 |
0.002 |
|
3-4 times per week |
2 |
14.1 |
14.1 |
26.4 |
2.01 |
0.045 |
|
1-2 times per week |
3 |
6.2 |
7.1 |
14.4 |
1.16 |
0.245 |
|
less than once per week |
4 |
10.2 |
9.3 |
10.4 |
0.04 |
0.968 |
|
occasionally – less than once every two weeks |
5 |
14.1 |
19.0 |
7.6 |
0.92 |
0.357 |
An essential factor influencing the
frequency of PKM is the respondent's assessment of the degree of connectivity
(SKOM). Table 4 presents the two-dimensional distribution of respondents based
on both characteristics. For each year separately, the t Kendall coefficient was calculated
to assess the strength and direction of the distribution of these two
characteristics. Notably, Group 1, which most frequently used PKM, rated the
degree of connectivity positively before COVID-19 (32.3%). In 2020, these
ratings shifted to the "poor" category (18.1%), and this trend
continued in 2021, with 26.2% of respondents in this group rating the degree of
connectivity as "very poor." In the same year, the respondents
commuting to work 3-4 times a week also rated the degree of connectivity as
"very poor" (17.4%). Therefore, it can be indicated that the positive
correlation between frequency of use and assessment of connectivity in 2019 (t
Kendall coefficient 0.08), which slightly strengthened during the COVID year
(0.10), changed to a negative correlation post-COVID, confirmed by a
statistically significant t Kendall coefficient of -0.06.
Tab. 4
PKM
usage in the years 2019-2021 and the z-test results for 2019 and 2021
|
Year |
SKOM |
PKM (group number) |
t Kendall |
z test |
p-value |
||||
|
1 |
2 |
3 |
4 |
5 |
|||||
|
2019 |
Very good |
12.0 |
3.6 |
1.6 |
1.6 |
2.8 |
0.08 |
2.70 |
0.007 |
|
Good |
32.3 |
6.6 |
2.4 |
4.4 |
8.2 |
||||
|
Neutral |
5.8 |
2.0 |
1.2 |
1.0 |
0.2 |
||||
|
Bad |
0.6 |
0.0 |
0.0 |
0.2 |
0.0 |
||||
|
Very bad |
4.8 |
2.0 |
1.0 |
3.0 |
3.0 |
||||
|
2020 |
Very good |
8.1 |
1.8 |
0.6 |
1.4 |
1.2 |
0.10 |
3.47 |
0.001 |
|
Good |
7.3 |
1.4 |
0.8 |
1.0 |
2.8 |
||||
|
Neutral |
6.2 |
0.6 |
0.8 |
1.8 |
1.4 |
||||
|
Bad |
18.1 |
5.2 |
2.4 |
3.8 |
7.5 |
||||
|
Very bad |
10.7 |
5.2 |
2.6 |
1.4 |
6.2 |
||||
|
2021 |
Very good |
1.4 |
0.6 |
1.0 |
0.6 |
0.0 |
-0.06 |
-2.02 |
0.043 |
|
Good |
2.6 |
2.6 |
2.2 |
1.2 |
0.0 |
||||
|
Neutral |
8.2 |
3.8 |
3.2 |
3.2 |
0.4 |
||||
|
Bad |
2.8 |
2.0 |
2.0 |
2.0 |
0.6 |
||||
|
Very bad |
26.2 |
17.4 |
6.0 |
3.4 |
6.6 |
||||
4.3.
Estimation Results
The results of the measurement model
estimation, presented in Table 5, indicate a generally acceptable level of
construct validity and reliability for 2019-2021. For most latent variables,
the factor loadings (L1) exceed the recommended threshold of 0.70, confirming
convergent validity. Reliability indicators, such as Composite Reliability
(Dillon-Goldstein’s rho, DG), and Cronbach’s Alpha (Cronbach), demonstrate
stable values above 0.70, with only a few exceptions, suggesting good internal
consistency overall. Constructs such as ATTITUDE and URGENCY exhibit high
reliability across all examined years (DG above 0.82 and Cronbach’s Alphas
ranging from 0.75 to 0.89). The average variance extracted (AVE) also exceeds
the threshold of 0.50 in most cases, indicating that more than half of the
variance in each construct is explained by its indicators. However, some
decline in measurement quality is observed for the LEGITIMACY construct in
2021—both AVE (0.49) and Cronbach’s Alphas (0.61) fall below the recommended
values, which may suggest the need to revise the scale or improve the
operationalization of the variable. A similar pattern is noted for the POWER construct
in 2021, where AVE is only 0.53 and Cronbach’s Alpha drops to 0.71. Despite
these deviations, the results suggest that the measurement model fits the data
well and meets the fundamental psychometric requirements for construct validity
and reliability.
Tab.
5
Measurement
Model Estimation Results
|
Variable |
2019 |
2020 |
2021 |
|||||||||
|
Loading |
DG |
Cronbach |
AVE |
Loading |
DG |
Cronbach |
AVE |
Loading |
DG |
Cronbach |
AVE |
|
|
POWER |
|
0.89 |
0.84 |
0.67 |
|
0.89 |
0.84 |
0.66 |
|
0.82 |
0.71 |
0.53 |
|
ATP1 |
0.84 |
|
|
|
0.84 |
|
|
|
0.76 |
|
|
|
|
ATP2 |
0.85 |
|
|
|
0.85 |
|
|
|
0.82 |
|
|
|
|
ATP3 |
0.80 |
|
|
|
0.81 |
|
|
|
0.68 |
|
|
|
|
ATP4 |
0.79 |
|
|
|
0.75 |
|
|
|
0.64 |
|
|
|
|
LEGITIMACY |
|
0.82 |
0.77 |
0.62 |
|
0.79 |
0.74 |
0.58 |
|
0.71 |
0.61 |
0.49 |
|
ATL1 |
0.96 |
|
|
|
0.97 |
|
|
|
0.97 |
|
|
|
|
ATL2 |
0.83 |
|
|
|
0.79 |
|
|
|
0.67 |
|
|
|
|
ATL3 |
0.49 |
|
|
|
0.42 |
|
|
|
0.64 |
|
|
|
|
URGENCY |
|
0.89 |
0.76 |
0.80 |
|
0.89 |
0.75 |
0.79 |
|
0.84 |
0.62 |
0.72 |
|
ATU1 |
0.89 |
|
|
|
0.89 |
|
|
|
0.83 |
|
|
|
|
ATU2 |
0.90 |
|
|
|
0.89 |
|
|
|
0.87 |
|
|
|
|
ATTITUDE |
|
0.89 |
0.83 |
0.66 |
|
0.88 |
0.82 |
0.65 |
|
0.84 |
0.75 |
0.58 |
|
AT1 |
0.72 |
|
|
|
0.73 |
|
|
|
0.69 |
|
|
|
|
AT2 |
0.89 |
|
|
|
0.87 |
|
|
|
0.84 |
|
|
|
|
AT3 |
0.77 |
|
|
|
0.75 |
|
|
|
0.74 |
|
|
|
|
AT4 |
0.87 |
|
|
|
0.87 |
|
|
|
0.75 |
|
|
|
Loading
– factor loadings, DG – Dillon-Goldstein’s rho, Cronbach – Cronbach’s Alpha,
AVE – average variance extracted
The results of the structural model
estimation using the Partial Least Squares Structural Equation Modeling (PLS-SEM) approach, presented in Table 6, reveal
significant differences in the relationships between variables across the analyzed years 2019-2021. The key predictor of the
dependent variable, Attitude, remains Urgency, whose influence is strong and
statistically significant in all three periods (β = 0.79; p < 0.001 in 2019; β = 0.76; p < 0.001 in 2020; β = 0.70; p < 0.001 in 2021). In contrast, the variable Power shows a
negative and significant effect on attitudes (β ≈ -0.20; p < 0.001) each year, suggesting that a higher
perception of Power is associated with less favorable
Attitudes toward the analyzed relationship. The
effect of Legitimacy on Attitudes was only significant in 2019 (β = -0.10; p = 0.02), and disappeared in the subsequent years. An
interesting dynamic also emerges in the interaction effect SKOM × Attitude,
which was significantly positive in 2020 (β = 0.47; p = 0.01) but turned negative in 2021 (β = -0.17; p = 0.01), potentially indicating a shifting role of the
communication context in moderating attitudes. The dependent variable PKM was
best explained in 2020, when the coefficient of determination R² reached
0.66 for Attitude and 0.02 for PKM. Model fit indices (GoF)
remained at a high level throughout the period (Absolute GoF:
0.49-0.53; Relative GoF: 0.86-0.90), confirming the
adequacy of the model specification.
Tab. 6
Assessment
of the Structural Model
|
Relation |
2019 |
2020 |
2021 |
||||||
|
coefficient |
p-value |
coefficient |
p-value |
coefficient |
p-value |
||||
|
Attitude → PKM |
H2 |
-0.09 |
0.383 |
-0.18 |
0.081 |
0.06 |
0.208 |
||
|
Power → Attitude |
H1a |
-0.16 |
0.000 |
-0.19 |
0.000 |
-0.20 |
0.000 |
||
|
Legitimacy → Attitude |
H1c |
-0.10 |
0.016 |
-0.06 |
0.094 |
0.01 |
0.866 |
||
|
Urgency → Attitude |
H1b |
0.79 |
0.000 |
0.76 |
0.000 |
0.70 |
0.000 |
||
|
SKOM → PKM |
|
0.09 |
0.676 |
-0.28 |
0.088 |
0.05 |
0.325 |
||
|
Age → PKM |
|
0.07 |
0.163 |
0.07 |
0.132 |
0.11 |
0.014 |
||
|
Gender → PKM |
|
0.12 |
0.018 |
-0.01 |
0.954 |
0.02 |
0.727 |
||
|
SKOM x Attitude → PKM |
H3 |
0.09 |
0.718 |
0.47 |
0.014 |
-0.17 |
0.012 |
||
|
Model diagnostics results |
|||||||||
|
N |
384 |
504 |
500 |
||||||
|
Average
R2 |
0.38 |
0.35 |
0.30 |
||||||
|
Average
communality |
0.78 |
0.76 |
0.61 |
||||||
|
Absolute
GoF |
0.53 |
0.49 |
0.39 |
||||||
|
Relative
GoF |
0.90 |
0.87 |
0.86 |
||||||
|
Average
redundancy |
0.26 |
0.23 |
0.17 |
||||||
GoF –
Goodness of Fit measure
Figure 2 illustrates the tested
structural model along with the results for each hypothesized relationship.
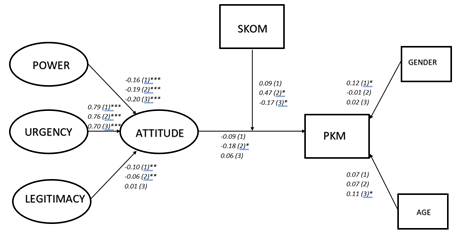
Fig. 2. Results
of the PLS-SEM structural model
Table 7 reports the HTMT (Heterotrait-Monotrait) ratios used to assess the
discriminant validity of constructs within the PL-SEM analysis. HTMT values
below the threshold of 0.85 indicate satisfactory discriminant validity. In
2019, most inter-construct correlations were relatively low, with the notable
exceptions of Legitimacy and Power (0.96), and Urgency and Attitude (1.01),
both exceeding the recommended threshold. In 2020, the correlation between
Legitimacy and Power decreased to 0.84, falling within acceptable limits, while
the correlation between Urgency and Attitude remained high at 0.99. In 2021,
the pattern persisted: the correlation between Legitimacy and Power increased
slightly to 0.89, and Urgency and Attitude rose further to 1.04. These
consistently high correlations suggest a strong and persistent association
between these variable pairs over time, potentially indicating issues with
discriminant validity.
Tab.
7
Heterotrait-monotrait
ratio of correlations (HTMT)
|
Variable |
Attitude |
Power |
Legitimacy |
Urgency |
SKOM |
PKM |
Age |
Gender |
|
2019 |
||||||||
|
Power |
0.35 |
|||||||
|
Legitimacy |
0.21 |
0.96 |
||||||
|
Urgency |
1.01 |
0.08 |
0.09 |
|||||
|
SKOM |
0.15 |
0.12 |
0.03 |
0.07 |
||||
|
PKM |
0.04 |
0.11 |
0.05 |
0.09 |
0.16 |
|||
|
Age |
0.07 |
0.17 |
0.19 |
0.03 |
0.07 |
0.04 |
||
|
Gender |
0.03 |
0.09 |
0.11 |
0.03 |
0.00 |
0.11 |
0.15 |
|
|
SKOMxAttitude |
0.55 |
0.24 |
0.09 |
0.40 |
0.92 |
0.12 |
0.09 |
0.01 |
|
2020 |
||||||||
|
Power |
0.3553 |
|||||||
|
Legitimacy |
0.1608 |
0.8402 |
||||||
|
Urgency |
0.9934 |
0.1125 |
0.1187 |
|||||
|
SKOM |
0.0763 |
0.0736 |
0.0437 |
0.0858 |
||||
|
PKM |
0.0626 |
0.0853 |
0.0209 |
0.0037 |
0.1076 |
|||
|
Age |
0.0422 |
0.1585 |
0.1671 |
0.0308 |
0.0285 |
0.0709 |
||
|
Gender |
0.0073 |
0.0519 |
0.0785 |
0.0176 |
0.0618 |
0.0157 |
0.1299 |
|
|
SKOMxAttitude |
0.6148 |
0.1686 |
0.0553 |
0.5326 |
0.8723 |
0.1377 |
0.0282 |
0.0265 |
|
2021 |
||||||||
|
Power |
0.3283 |
|||||||
|
Legitimacy |
0.1202 |
0.8851 |
||||||
|
Urgency |
1.0360 |
0.1083 |
0.0939 |
|||||
|
SKOM |
0.0120 |
0.0195 |
0.0239 |
0.0142 |
||||
|
PKM |
0.0086 |
0.0016 |
0.0375 |
0.0305 |
0.0311 |
|||
|
Age |
0.0590 |
0.1311 |
0.1329 |
0.0495 |
0.0314 |
0.1206 |
||
|
Gender |
0.0037 |
0.0241 |
0.0381 |
0.0122 |
0.0014 |
0.0027 |
0.1228 |
|
|
SKOMxAttitude |
0.6733 |
0.1793 |
0.0932 |
0.5424 |
0.8479 |
0.0132 |
0.0551 |
0.0175 |
5.
DISCUSSION
5.1.
Theoretical Implications
This study advances the theoretical
application of Stakeholder Salience Theory (SST)
Moreover, this study contributes to
the theoretical development of SST by incorporating the concept of moderation
and temporal variation into the analysis of stakeholder behavior.
Introducing intermodal connectivity as a moderating variable enriches the SST
framework, showing that stakeholder perceptions do not operate in isolation but
are shaped by the broader systemic environment. This integration acknowledges
that the influence of perceived stakeholder attributes on behavior
can be contingent upon infrastructural or contextual conditions, such as the
quality-of-service integration across transport modes. Additionally, by
examining how these relationships evolve across distinct time periods marked by
socio-environmental disruption, the study extends SST’s temporal dimension.
This offers a theoretical foundation for more nuanced stakeholder models in
public service contexts, especially those influenced by crisis, adaptation, and
recovery processes.
5.2.
Impact of the Pandemic and Practical
Considerations
The moderating effect of connectivity improvement becomes important
under a pandemic scenario (coefficient of 0.47). What is most noticeable is,
however, the change that occurred between 2020 and 2021. Negative coefficient
of 0.17 observed in 2021 highlights the behavioral
change. The same moderator now reverses the effect of the independent variable
on the dependent variable. This could only be interpreted that while
qualitative features of rail service (represented by SKOM variable) were a
necessary condition for users during pandemics, they became a factor reducing
the use of rail afterward. This demonstrates that the potential fear of
becoming ill was a real concern, and streamlining rail service
interconnectivity was, during pandemics, considered key in the selection of
rail travel. The negative coefficient in the post-pandemic recovery period
points to a significant change in customer expectations, revealing increasing
disillusionment with the rail service's responsiveness to users’ expectations
and highlighting the evolving nature of user priorities.
The practical consideration for rail operators is inconclusive. We
observed three different behaviors in our study. In
pre-pandemic scenario the improvements to rail service were mostly ignored by
train customers; during pandemic they became of crucial importance, while
afterwards we observed reversal in customer behavior.
This volatile behavior could be attributed to the
rather slow process of the post-pandemic recovery of rail users’ numbers. Likely,
most of the users who were pushed out of the rail service during pandemic never
came back (as ridership data for those years suggests). And the remaining users
were there because they had no real alternative. Under such circumstances, the
connectivity cannot play its positive role since users have no real alternative
anyway.
6. CONCLUSION
This
study explored the evolving dynamics of public railway usage in the Pomeranian
region from 2019 to 2021 through the lens of Stakeholder Salience Theory (SST).
The analysis revealed a significant decline in daily PKM usage during the
COVID-19 period, accompanied by an increase in moderate-frequency travel (3-4
times per week), suggesting a behavioral shift likely
influenced by remote work policies and broader lifestyle changes. The frequency
of PKM usage was positively associated with favorable
assessments of the regional rail system’s connectivity before the pandemic;
however, this relationship reversed post-COVID, indicating increasing
dissatisfaction among regular users.
Structural
equation modeling confirmed that perceived urgency
remained the most robust and consistent predictor of users’ attitudes toward
PKM throughout all three years, while power exerted a consistently negative
influence. The effect of legitimacy on attitudes was only significant in 2019
and weakened thereafter. Notably, the interaction between perceived
connectivity (SKOM) and user attitudes shifted from a positive moderator in
2020 to a negative one in 2021, suggesting increasing disillusionment with the
rail system's responsiveness.
This
study has several limitations. First, the analysis relies on cross-sectional
data, which limits causal inference. Second, while care was taken to ensure
consistent coding across years, subtle shifts in the meaning of constructs
(particularly legitimacy) may have influenced how respondents interpreted key
items over time. Finally, the sample may not fully capture the diversity of
perspectives across all organizational types or sectors.
Future
studies should consider employing longitudinal panel data to more rigorously
trace changes in stakeholder perceptions and behaviors
over time. Additionally, incorporating qualitative methods—such as interviews
or focus groups—could enrich understanding of how users interpret concepts like
power or legitimacy in the public transport context. Researchers should also
explore expanding the SST model to include additional dimensions such as trust,
service satisfaction, or perceived responsiveness, which may better capture the
complexity of infrastructure-user relationships. Finally, addressing the noted
issues with discriminant validity, particularly the overlap between urgency and
attitude, will be critical for improving construct clarity and model robustness
in subsequent studies.
References
1.
Ajzen Icek. 1991. “The Theory of Planned
Behavior.” Organizational Behavior and Human Decision Processes 50(2):
179-211. Elsevier.
2.
Ali Nazam, Nakayama Shoichiro, Yamaguchi Hiromichi. 2023. “Using the Extensions of the Theory
of Planned Behavior (TPB) for Behavioral Intentions to Use Public Transport
(PT) in Kanazawa, Japan.” Transportation Research Interdisciplinary
Perspectives 17(January): 100742. Elsevier. DOI: 10.1016/J.TRIP.2022.100742.
3.
Boesso Giacomo, Kumar Kamalesh.
2016. “Examining the Association between Stakeholder Culture, Stakeholder
Salience and Stakeholder Engagement Activities: An Empirical
Study.” Management Decision 54(4): 815-31. Emerald Group Publishing Ltd. DOI: 10.1108/MD-06-2015-0245.
4.
Bubelíny Oliver, Kubina Milan,
Varmus Michal. 2021. “Railway Stations as Part of
Mobility in the Smart City Concept.” Transportation Research Procedia
53(January): 274-81. Elsevier. DOI: 10.1016/J.TRPRO.2021.02.039.
5.
Derrick Ben, Anselma Dobson-Mckittrick,
Toher Deirdre, White Paul. 2025. “Quantitative Methods Inquires 1 Test
Statistics for Comparing Two Proportions with Partially Overlapping Samples.”
6.
Downey Jordan, Kenny Avi. 2024. “Repeated
Sampling of Different Individuals but the Same Clusters to Improve Precision of
Difference-in-Differences Estimators: The DISC Design.”
Available at:
https://arxiv.org/pdf/2411.17905.
7.
Fieller E.C., H.O. Hartley, E.S. Pearson.
1957. “Tests for Rank Correlation Coefficients. I.” Biometrika 44(3-4):
470-81. Oxford Academic.
DOI: 10.1093/BIOMET/44.3-4.470.
8.
Geurs Karst T., Lissy La Paix, Sander Van
Weperen. 2016. “A Multi-Modal Network Approach to Model Public Transport
Accessibility Impacts of Bicycle-Train Integration Policies.” European
Transport Research Review 8(4): 1-15. Springer Verlag. DOI: 10.1007/S12544-016-0212-X/TABLES/6.
9.
Hair Joseph F., Jeffrey J. Risher, Marko
Sarstedt, Christian M. Ringle. 2019. “When to Use and How to Report the Results
of PLS-SEM.” European Business Review 31(1): 2-24. Emerald Group
Publishing Ltd. DOI: 10.1108/EBR-11-2018-0203/FULL/PDF.
10. Hussain
Hussain Dhafir. 2020. “Predicting the Commuter’s Willingness To Use LRT,
Utilising the Theory of Planned Behaviour and Structural Equation.” Journal
of Applied Engineering Science 18(3): 403-12. Institut za Istrazivanja. DOI: 10.5937/JAES18-27013.
11. Ibrahim
Muhammad Faishal. 2003. “Improvements and Integration of a Public Transport
System: The Case of Singapore.” Cities 20(3): 205-16. Elsevier Ltd.
DOI: 10.1016/S0264-2751(03)00014-3.
12. Koleva
Petya, Yusuf M. Sidani, Maureen Meadows. 2022. “Stakeholder Salience
Formulation in a Non-Western Context: Who, What and Why Actually Matters for
the Organization?” Academy of Management Proceedings 2022(1). Academy of Management. DOI: 10.5465/AMBPP.2022.12281ABSTRACT.
13. Madha
Ahmed, Ali Dawod Salman, Hussein Dhafir Hussain, Nazri Borhan, Riza Atiq O.K.
Rahmat. 2016. “Analysis of Travel Behaviour in Petaling Jaya, Malaysia: An
Application of the Theory of Planned Behaviour.” Archives of Transport
38(2).: 29-38. Warsaw University of Technology. DOI: 10.5604/08669546.1218791.
14. Mitchell
Ronald K., Bradley R. Agle, Donna J. Wood. 1997. “Toward a Theory of
Stakeholder Identification and Salience: Defining the Principle of Who and What
Really Counts.” Academy of Management Review 22(4): 853-86. Academy of Management Briarcliff
Manor, NY. DOI: 10.5465/AMR.1997.9711022105.
15. Neville
Benjamin A., Simon J. Bell, Gregory J. Whitwell. 2011. “Stakeholder Salience
Revisited: Refining, Redefining, and Refueling an Underdeveloped Conceptual
Tool.” Journal of Business Ethics 102(3): 357-78. Springer.
DOI: 10.1007/S10551-011-0818-9/METRICS.
16. Pérez-Guerrero
Edsaúl Emilio, Miryam Rosario Guillén-Medina, Fabiola Márquez-Sandoval, José
María Vera-Cruz, Martha Patricia Gallegos-Arreola, Manuel Alejandro
Rico-Méndez, José Alonso Aguilar-Velázquez, Itzae Adonai Gutiérrez-Hurtado.
2024. “Methodological and Statistical Considerations for Cross-Sectional,
Case-Control, and Cohort Studies.” Journal of Clinical Medicine 13(14):
4005. Multidisciplinary Digital Publishing Institute (MDPI). DOI: 10.3390/JCM13144005.
17. Pshinko
Oleksandr, Tatiana Charkina, Larysa Martseniuk, Oleksandra Orlovska. 2025.
“Hubs as a Key Tool for Improving the Quality of the Service and Development of
Multimodal Passenger Traffic.” Transport Problems 17(1): 201-214. DOI: 10.20858/tp.2022.17.1.17.
18. Pucher
John, Ralph Buehler. 2009. “Integrating Bicycling and Public Transport in North
America.” Journal of Public Transportation 12(3): 79-104. Elsevier.
DOI: 10.5038/2375-0901.12.3.5.
19. Raha
Aveed, Ilir Hajdini, Josef Windsperger. 2021. “A Multilateral Stakeholder
Salience Approach: An Extension of the Stakeholder Identification and Salience
Framework.” Industrial Marketing Management 97(August): 1-9. Elsevier.
DOI: 10.1016/J.INDMARMAN.2021.06.008.
20. Reynolds
Scott J., Frank C. Schultz, David R. Hekman. 2006. “Stakeholder Theory and
Managerial Decision-Making: Constraints and Implications of Balancing
Stakeholder Interests.” Journal of Business Ethics 64(3): 285-301. Springer.
DOI: 10.1007/S10551-005-5493-2/METRICS.
21. Saleh
Silvia, Anusree Saha Tithi, Nazmus Sakib, Tonmoy Paul, Nafis Anwari, Shohel
Amin. 2023. “Theory of Planned Behavior to Understand Commuter’s Perception
towards Mass Rapid Transit in Dhaka City, Bangladesh.” Sustainability
15(14): 11270. MDPI AG.
DOI: 10.3390/SU151411270.
22. Shaaban
Khaled, Amro Maher. 2020. “Using the Theory of Planned Behavior to Predict the
Use of an Upcoming Public Transportation Service in Qatar.” Case Studies on
Transport Policy 8(2): 484-91. Elsevier. DOI: 10.1016/J.CSTP.2019.11.001.
23. Torabi K.F., Yashar Araghi, Niels van Oort, Serge
Hoogendoorn. 2022. “Passengers Preferences for Using Emerging Modes as
First/Last Mile Transport to and from a Multimodal Hub Case Study Delft Campus
Railway Station.” Case Studies on Transport Policy 10(1): 300-314. Elsevier.
DOI: 10.1016/J.CSTP.2021.12.011.
24. Venturini
Sergio, Mehmet Mehmetoglu. 2019. “PLSSEM: A Stata Package for Structural
Equation Modeling with Partial Least Squares.” Journal of Statistical
Software 88(1): 1-35. American Statistical Association. DOI: 10.18637/JSS.V088.I08.
25. Wood Donna
J., Ronald K. Mitchell, Bradley R. Agle, and Logan M. Bryan. 2021. “Stakeholder
Identification and Salience After 20 Years: Progress, Problems, and Prospects.”
Business and Society 60(1): 196-245. SAGE Publications Ltd. DOI: 10.1177/0007650318816522.
26.
Zhang Xinyuan, Diyi Liu, Yuning Wang,
Huibin Du. 2021. “Behavioral Intentions of Urban Rail Transit Passengers during
the COVID-19 Pandemic in Tianjin, China: A Model
Integrating the Theory of Planned Behavior and Customer Satisfaction Theory.” Journal
of Advanced Transportation 2021(1): 8793101. John Wiley & Sons, Ltd.
DOI: 10.1155/2021/8793101.
Received 04.12.2025; accepted in revised form 05.05.2026

Scientific Journal of Silesian
University of Technology. Series Transport is licensed under a Creative
Commons Attribution 4.0 International License