Article
citation information:
Sendek-Matysiak,
E. Effective
selection of vehicles for last-mile logistics – multi-criteria decision support
using the Maja method. Scientific Journal
of Silesian University of Technology. Series Transport. 2026, 130, 195-209. ISSN: 0209-3324. DOI: https://doi.org/10.20858/sjsutst.2026.130.12
Ewelina SENDEK-MATYSIAK[1]
EFFECTIVE
SELECTION OF VEHICLES FOR LAST-MILE LOGISTICS – MULTI-CRITERIA DECISION SUPPORT
USING THEMAJA METHOD
Summary. The last mile is the
final stage of the goods transportation process from the distribution warehouse
to the end customer. Although it constitutes only a part of the entire
logistics chain, it generates significant costs, which may account for 40% to
even 53% of the total delivery value. Along with the dynamic development of
e-commerce, customer expectations regarding the speed and flexibility of
deliveries are also growing. At the same time, new regulations introduce
increasingly stringent restrictions for traditional combustion vehicles.
Logistics companies must therefore adapt their fleets, often investing in low-
or zero-emission vehicles. The aim of this article is to propose a tool
supporting decision-making regarding the selection of vehicles for last-mile
logistics, taking into account economic, environmental, technical and social
criteria. For this purpose, the MAJA method was applied, enabling
multi-criteria assessment of light commercial vehicle powertrain variants, i.e.
conventional, electric and plug-in hybrid, taking into account the operating
conditions in Poland. The research results can provide support for city fleet
operators, logistics companies and decision-makers responsible for the
development of sustainable transport in cities.
Keywords: logistics, last mile, sustainable development, multi-criteria
decision-making meth
1. INTRODUCTION
In
principle, the sources of air pollutant emissions can be considered from
several perspectives. One of them is the division into natural sources, which
include, for example, volcanic eruptions, forest fires, soil and rock erosion,
or the emission of microorganisms, pollen, spores, and anthropogenic sources,
which include all sources related to human activity. Among them, the most
common sources are those based on the economic sector responsible for pollutant
emissions. The key sources include: energy production and supply, industry,
municipal and residential sources, agriculture, waste management, and
transport. Regardless of the method of dividing emission sources, communication
sources, i.e. those related to transport, in particular road transport, have a
clear role in shaping air quality. In 2023, transport was responsible for 20-25%
of global CO2 emissions (Fig. 1), and including services related to
it (e.g. car production or road maintenance) even for 37%. In the European
Union, it generates 29% of emissions – 15% originates from passenger cars and
delivery vans, and 5% from heavy goods vehicles. At the same time, in Poland
alone, CO2 emissions from transport almost doubled between 2005 and
2019 [1].
Fig. 1. CO2
emissions by sector/source, World (2023)
(Source: own elaboration based on IEA, IPCC)
The
source of gaseous pollutant emissions from transport is primarily the
combustion of fuels in vehicle engines (both spark-ignition (SI) and
compression-ignition (CI) engines). Depending on the type of vehicle driven,
they are responsible for the emission of different amounts of harmful
substances. For example, as a rule, a larger amount of nitrogen oxides is
generated by diesel engines, while volatile organic compounds are generated by
petrol engines (Fig. 2).
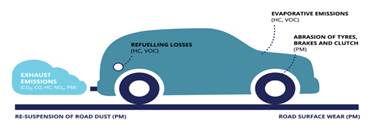
Fig. 2.
Different types of emissions from the operation of internal combustion engine
vehicles (Source: own elaboration based on EEA)
In
turn, particulate matter pollution is created both as a result of fuel
combustion and tire friction on the road surface, or the abrasion of brake pads
and discs. Due to the fact that suspended particulate matter has absorption
properties, it can attach metals (including heavy metals) from wearing vehicle
components to its structure. Tire abrasion also turns out to be an important
source of emissions of trace metals such as Zn, Cd, Co, Cr, Cu, Hg, Mn, Mo, Ni
and Pb [5], [6], while brake abrasion is a source of Cd, Cr, Cu, Ni, Pb, Sb,
and Zn [7]. Additionally, passing vehicles contribute to the phenomenon of the
so-called secondary resuspension of particulate matter pollution, i.e. the
re-entry of dust particles deposited on the road into the breathing zone.
Some
of the traffic pollutants (nitrogen oxides (NOx)) and volatile organic
compounds (VOCs) are so-called precursors of tropospheric ozone. This means
that their emission into the atmosphere affects the formation of ozone in the
air. From a chemical point of view, the ozone formed in this way is no
different from stratospheric ozone, which protects the Earth's surface and
living organisms from biologically active ultraviolet radiation.
However,
its presence in the ground-level layer of the atmosphere poses a significant
health hazard.
One
of the precursors of secondary particulate matter is ammonia (NH3) emitted by
vehicles, the concentration of which in the air is currently not subject to
mandatory monitoring. Although agriculture is by far the dominant source of
ammonia emissions into the air, it is worth noting that some of it is also
emitted into the air from road transport [8].
Some
literature sources also indicate its important role (alongside nitrogen oxides)
in shaping air quality precisely due to its participation in the formation of
secondary suspended particulate matter [9]. Furthermore, it should be noted
that pollutants emitted by passing vehicles undergo a number of chemical and
physical changes in the ambient air, as a result of which other types of
pollutants, referred to as secondary pollutants, may be formed.
The
amount of pollutants released into the air from the transport sector depends,
among other things, on the structure of the vehicle fleet – the number of
vehicles, their age, type and size, but also on the state of development of the
road and street network or the distances covered by vehicles moving in a given
area.
Therefore,
transport is particularly strongly present on main communication routes and
junctions, especially in large urban centers.
Due
to population density and the common use of means of transport in cities, on
their territory, but also many times on access roads to cities, the risk of
traffic jams increases. Repeated braking and starting, resulting in low average
speed of vehicles, contributes to the increasing emission of pollutants into
the air, as a result of which its quality decreases and conditions are created
that negatively affect the health of city residents (Fig. 3).
According
to literature sources, depending on the city, from 5% to 61% (with an average
of 27%) of the total concentration of particulate matter comes from transport
[10].
It
is also estimated that in European cities, road transport is a source of
approximately 56% of the average annual concentration of nitrogen dioxide and
approx. 39% of the concentration of particulate matter PM10 [11].
In
addition, road transport is one of the main sources of noise and light
pollution in cities [12].
The
above indicates the need for urgent radical action in the fight against
pollution, including in the area of urban logistics. These tasks are of
particular importance in the context of the growing share of light commercial
vehicles (LDV) in air pollution in cities, especially in the implementation of
last-mile deliveries.
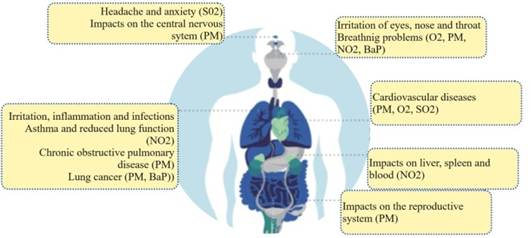
Fig. 3. The
impact of harmful air pollution on the human body (Source: own elaboration
based on EEA)
1.1. The Last Mile
The
last mile is the final stage of goods delivery, consisting in delivering goods
from the distribution warehouse to the end recipient – individual or business.
This concept may refer to the delivery of raw materials to a production plant,
finished products to a point of sale or finally goods purchased online. This
transport usually takes place over a distance of several or a dozen or so kilometers, in the immediate vicinity of recipients; it is
carried out, among others, by smaller and lighter vehicles, i.e. delivery
vehicles.
In
recent years, the last mile has become particularly important in the policies
of companies and cities. This is mainly due to economic reasons. The last mile
is the most expensive stage for suppliers. It is estimated that its cost
usually accounts for 40-50% of the order fulfillment
costs, and according to [13] in 2020 it was as much as 53%. The reasons
include, among others, the constantly growing number of loads and changing
delivery addresses (which makes planning and optimizing service costs difficult)
or restrictions in urban traffic.
According
to Transport Intelligence, in 2020 the value of the global logistics services
market increased by 27.3%, to EUR 368.1 billion, and that it will reach EUR 557
billion in 2025. In Europe alone, the value of logistics services for
e-commerce was to increase by 26.5%, to EUR 70.8 billion [14]. Experts from
Last Mile Experts estimate that in 2021 the CEP (Courier, Express, Postal
services) market in Europe exceeded 7 billion parcels and generated a value of
over EUR 80 billion [15]. This growth was primarily driven by the dynamic
development of e-commerce during the Covid-19 pandemic. Data [16] show that in
2020, purchases worth approximately EUR 3.46 billion were made via the Internet
in Poland alone, representing an increase of 31.4% compared to 2019.
At
the same time, it is undergoing a strong transformation, the nature and pace of
which are influenced by the requirements of climate policy and policies to
improve air quality.
According
to [14], the delivery of goods on the last mile constitutes a relatively small
share of urban traffic, but generates a disproportionate amount of pollution.
It is estimated that with the current model, by 2030, the number of delivery
vehicles in the 100 largest cities in the world will increase by 36%, and the
emissions generated by them by 32%. Congestion on roads may increase by more
than 1/5 [14].
In
addition, delivery vehicles are one of the main sources of noise in cities and
traffic congestion [17].
In
order to curb the deterioration of the quality of life of residents, concepts
of making deliveries more and more sustainable are emerging. Their
implementation is mainly through central and local stimulation of the
development of other forms of transport (e.g. cargo bikes), the use of
renewable energy sources, the implementation of innovative digital solutions,
as well as the popularization of vehicles using other than conventional power
sources. The latter are becoming increasingly important in the context of the
transformation of vehicle fleets used to handle urban logistics, in particular
in the area of the so-called last mile.
In
this paper, a tool supporting decision-making in the selection of vehicles that
make up such a fleet was proposed. All analyzed
vehicles belong to the N1 category, but they differ in the type of drive used.
Their evaluation was made using one of the multi-criteria optimization methods,
i.e. MAJA, taking into account various evaluation criteria, i.e. environmental,
economic, technical and social.
The
considerations in the article are organized as follows. Chapter 2 provides a
detailed description of the research approach. Chapter 3 presents a case study
an evaluation of the analyzed vehicles in terms of
efficiency and reliability in making last-mile deliveries. Chapter 4
discusses the research results with their interpretation. In addition, the
conclusions of the research are presented, indicating their limitations,
practical application and future research directions in this field.
2. ASSESSMENT
OF LIGHT COMMERCIAL VEHICLE VARIANTS FOR
LAST-MILE DELIVERIES IN TERMS OF EFFICIENCY AND RELIABILITY
2.1. Vehicle
selection efficiency and reliability assessment process
The
analysis and evaluation of light commercial vehicle variants used in last-mile
deliveries under urban conditions, taking into account different types of
propulsion systems, requires an interdisciplinary approach, encompassing
knowledge of the operational specifics of urban transport, operating costs of
such vehicles, their environmental impacts, and technical and operational
criteria.
The
evaluation procedure can be presented in several stages:
Phase 1: Identification and analysis of the decision
problem, including defining basic assumptions regarding the types of vehicles
used to implement last-mile deliveries, their technical parameters, operating
costs and environmental burdens resulting from their use.
Phase 2: Establishing a set of vehicle variants, V:V
= {v: v = 1, …, N}. Each
variant v represents a vehicle with a
different type of drive, i.e. a vehicle with a compression ignition engine
(CI), a vehicle with a spark ignition engine (SI), a plug-in hybrid electric
vehicle (PHEV - Plug-in Hybrid Electric Vehicle), and a battery electric vehicle
(BEV - Battery Electric Vehicle). The set of alternatives V is assumed to be constant, i.e. it is not subject to change
during the decision-making procedure.
Phase 3: Establishing a set of K criteria for assessing the analyzed motor vehicles and
determining the factors influencing each criterion. For each criterion 𝑓𝑘, a vector of factors Yk is defined, which directly affects the value of a given
criterion. These factors enable the assessment of the impact of individual
vehicle variants on the efficiency of last-mile logistics processes.
Phase 4: Application of the MAJA multi-criteria
assessment method to select the most advantageous vehicle variant in terms of
the efficiency of last-mile deliveries in urban logistics. Based on the results
of the MAJA analysis, the optimal variant of a light delivery vehicle is
selected, meeting the adopted economic, environmental, technical and social
criteria.
Application
of the MAJA method enables a logical and transparent transition from defined
assumptions to the selection of the most advantageous means of transport used
in last-mile logistics. Its
operation and application show certain similarities to the ELECTRE family of
methods, especially in the area of comparisons of pairs of alternatives and
determining dominance relations. This method has been developed and used in
decision analyses for over two decades, and its application includes, among
others, particularly in the field of transport and logistics. The MAJA method
was first applied to
assess the development of transport systems, analyzing
many variants of alternative traffic flow distribution [18]. In subsequent
years, it was rarely used, among others, to assess public transport systems in
cities, select means of transport in distribution systems, assess drives of
public transport vehicles or support decisions in planning infrastructure
investments [19], [20], [21]. The application of the method and the detailed
algorithm of operation can be found in the works [19], [20].
2.2. MAJA
method algorithm
In order to conduct a multi-criteria analysis of the
choice of means of transport for the implementation of last-mile logistics, a
diagram presenting the MAJA method algorithm was developed, which includes
subsequent steps aimed at building the final ranking and indicating a rational
arrangement of variants.
Figure 4 shows the subsequent stages of the
decision-making process, from identifying the goal and defining the evaluation
criteria, to performing calculations and indicating the optimal variant of the
vehicle used in the implementation of last-mile deliveries.
The execution of each stage and the adopted assumptions
affect the results obtained when applying this method. It is particularly
important to properly construct the hierarchical structure (Step 1), which requires defining: (1)
the purpose of the multi-criteria analysis, (2) decision variants, (3)
evaluation criteria.
The second step
concerns the normalization of the assessments of decision variants. The
normalization of such assessments is performed differently for criteria whose
values are to be maximized and for criteria that are to be minimized.
Normalization can be carried out using, for example, the zeroed unitarization
method, in the following way:
 (1)
(1)
where xvf –
evaluation of the v-th variant from the point of view of the f-th partial
criterion (vÎV, f ÎF).
The values obtained
as a result of normalization ![]() of variant evaluations against individual
criteria are saved in the form of matrix ZO,
i.e.
of variant evaluations against individual
criteria are saved in the form of matrix ZO,
i.e. ![]() .
.
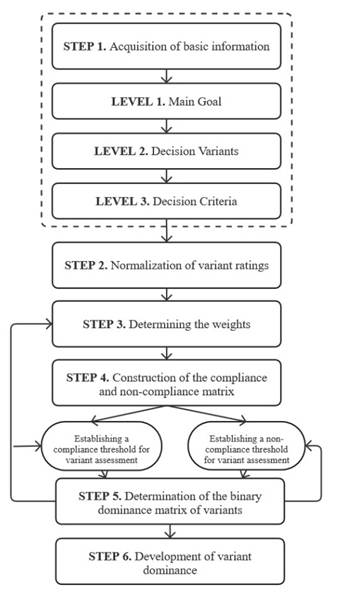
Fig. 4. The algorithm for performing calculations in
the MAJA method
(Source: own work based on [22])
In the next, third step, the relative importance
values wk
are assigned to individual partial criteria, assuming that the weight of each
criterion w belongs to the interval [0,1], and the sum of weights for all
criteria cannot be greater than 1, i.e. ![]() wherein
wherein ![]() .
.
In
the fourth step, the compliance
matrix Z is constructed. The elements
of such a matrix are obtained by comparing pairs of any variants (vi, vj) taking into
account the criteria fkÎF,
for which the decision variant vi
receives better scores than the variant vj. For the criteria meeting this condition,
their weights are summed up and divided by the sum of the weights of all
criteria. The compliance index zij’
is expressed by the formula:
![]() ,
where
,
where ![]() .
.
The compliance index
reaches values from the range [0,1] and is recorded in the matrix ![]() .
.
The next, fifth stage concerns the determination
of the inconsistency matrix N. In
order to determine it, the extent to which the assessment of decision variant vi is worse than the
assessment of variant vj
is compared. The inconsistency indices of assessments zij are recorded in
the inconsistency matrix ![]() , where
, where ![]() and
and ![]() . The
inconsistency index, similarly to the compliance index, takes values from the
range [0,1].
. The
inconsistency index, similarly to the compliance index, takes values from the
range [0,1].
In the next step of the method, the threshold
of compliance pz
and the threshold of incompatibility pn are determined. The thresholds take values from the range
[0,1] and are used to select decision variants that meet the criteria defined
by both thresholds.
The last, seventh stage consists in determining
the binary matrix of variant dominance![]() , whose
elements dij
are determined from the formula:
, whose
elements dij
are determined from the formula:
![]()
On its basis, a
dominance graph Gf=<Wf,
Lf> is
developed for which: Wf
– a set of vertex numbers representing the set of compared variants V; Lf – a set of arcs (i, j) such that if dij=1 then there is an
arc from vertex i
to vertex j, if dij= 0 then there is
no arc from vertex i
to vertex j. Based on the graph Gf,
the final choice of the decision variant is made. The variant corresponding to
the vertex from which the greatest number of arcs originate is considered the
optimal solution.
3. CASE STUDY
3.1. Determination
of input data, decision options and evaluation criteria
Input data constitute a
key element of the multi-criteria analysis process, as the evaluation of
alternative decision variants is made. In the context of selecting the optimal
type of drive for light delivery vehicles used in urban logistics for last-mile
deliveries, they include the values of individual evaluation criteria for
vehicle variants of the same make, which enables an accurate comparison of
their efficiency, costs, operating and environmental parameters. These data are
subsequently normalized to enable comparability and analyzed
using the MAJA multi-criteria evaluation method. The analysis concerns vehicles
of category N1 (light commercial vehicles), which were designed and
manufactured, which are designed and manufactured primarily for the transport
of cargo and have a maximum permissible gross vehicle weight not exceeding 3.5
t, and their maximum load capacity is 1.5 t [23].
Therefore, vehicles of the same
manufacturer were selected for the study, appearing with different
types of drive. Three of the analyzed variants are the same vehicle model with
internal combustion engines (petrol and diesel) and electric (BEV) drive. The
fourth is another model of the same make equipped with a plug-in hybrid drive
(PHEV). This choice was dictated by the lack of availability of a plug-in
hybrid variant for the basic model and the need to ensure comparable
performance parameters.
Finally, four
variants of vehicles differing in the drive used were defined:
v₁ – variant with a compression ignition engine
(CI),
v₂ – variant with a spark ignition engine (SI),
v₃ – variant with a plug-in hybrid drive (PHEV
- Plug-in Hybrid Electric Vehicle),
v₄ – variant with a battery electric drive (BEV
- Battery Electric Vehicle).
The multi-criteria
analysis process using the MAJA method was based on the knowledge and
experience of the team of experts, which ensured the credibility of the
assessments and the reliability of the obtained results. In addition, it was
ensured that the set of assessments (criteria) met the requirements of:
exhaustiveness, uniqueness of criteria, consistency of assessment and
minimization of the number of criteria to a level that allows for
differentiation of assessments of individual alternatives [24], [25].
The group
of experts was composed of people representing different perspectives and
competences necessary for a comprehensive assessment of means of transport used
in urban logistics. The team consisted of representatives of the logistics and
transport industry, including fleet managers of commercial vehicles,
sustainable transport analysts, vehicle operation specialists and experts in
electromobility. Each of the experts brought practical experience in the
selection and assessment of commercial vehicles in terms of economic
efficiency, technical parameters and environmental impact. The experts assessed
the criteria and decision-making options individually, which helped avoid the
groupthink. In order to compare different drive options in the context of application
in urban distribution logistics, data from industry reports, technical
specifications of vehicles published by manufacturers and benchmarking analyses
available in public sources such as automotive databases and expert
publications were used.
Table 1
presents the input data for the assessment of the efficiency and reliability of
the analyzed vehicles.
Tab. 1
Values of evaluation criteria for established
decision variants [26],
[27], [28], [29], [30], [31]
|
Criterion V |
v1 |
v2 |
v3 |
v4 |
|
Annual
CO₂ emissions (WtW)* [kg/year] |
3 045 |
3 375 |
1 830 |
1 095 |
|
PM emissions**
[mg/km] |
5.5 |
5.0 |
0.2 |
0.0 |
|
Exterior
noise level at 100 km/h [dB] |
65 |
70 |
68 |
65 |
|
Purchase cost***
[EUR net] |
20 618 |
18 371 |
32 319 |
35 753 |
|
Cost of 100
km (mixed cycle)*** [EUR] |
7.70 |
9.06 |
2.70 |
6.07 |
|
Range (mixed cycle) [km] |
545 |
720 |
500 |
270 |
|
Number of refueling/charging stations |
7 898 |
7 989 |
12 526 |
4 628 |
|
Refueling/charging time**** [min] |
3 |
3 |
155 |
342 |
|
Total
payload without passengers [kg] |
560.2 |
573.7 |
631.4 |
626 |
|
Additional
privileges, e.g. use of bus lanes, purchase subsidies, etc. [0-2] |
0 |
0 |
0 |
2 |
*total carbon footprint from raw material
extraction to vehicle consumption (well-to-wheel), assuming 15,000 km/year and
an average energy mix for Poland in 2024 [4]
**vehicle operation in urban traffic [32]
***price valid as of March 2025
****AC charging time (0 to 80%)
3.2. Normalization of variant
ratings and assigned relative importance values
The normalization of
decision variants assessments performed for criteria whose values are to be
maximized (a higher value of the criterion is preferred) and criteria to be
minimized (a lower value of the criterion is preferred) was performed according
to formula (1). After normalization, the normalized decision matrix took the
form presented in Table 2.
Tab. 2
Variants
evaluation matrix after normalization ZO
|
Criterion |
v1 |
v2 |
v3 |
v4 |
|
f1 |
0.36 |
0.32 |
0.60 |
1.00 |
|
f2 |
0.02 |
0.02 |
0.50 |
1.00 |
|
f3 |
1.00 |
0.93 |
0.96 |
1.00 |
|
f4 |
0.89 |
1.00 |
0.57 |
0.51 |
|
f5 |
0.42 |
0.54 |
1.00 |
0.83 |
|
f6 |
0.76 |
1.00 |
0.69 |
0.38 |
|
f7 |
0.63 |
0.64 |
1.00 |
0.37 |
|
f8 |
1.00 |
1.00 |
0.02 |
0.01 |
|
f9 |
0.89 |
0.91 |
1.00 |
0.99 |
|
f10 |
0.00 |
0.00 |
0.00 |
1.00 |
Additionally, the
relative importance values wk were assigned to individual criteria (Tab. 3).
Tab. 3
The values of the adopted
criteria weights
|
wk |
Criterion |
w |
|
||||||||||
|
w1 |
w2 |
w3 |
w4 |
w5 |
w6 |
w7 |
w8 |
w9 |
w10 |
|
|||
|
Value |
0.10 |
0.10 |
0.05 |
0.10 |
0.15 |
0.10 |
0.05 |
0.05 |
0.15 |
0.15 |
1 |
||
3.3. Construction of the
Z-concordance and N-inconcordance matrices
The key stage of the
MAJA method is the construction of the agreement matrix and the inconsistency
matrix, reflecting the degree of advantage of one variant over the other in
relation to the adopted evaluation criteria fk.
For each pair of any
variants (vi, vj),
it was determined which of them obtained better scores for a given criterion.
For the criteria meeting the above condition, their weights were summed up and
divided by the sum of the weights of all criteria, which was recorded in the
agreement matrix Z (Table 4).
Tab. 4
Elements of the
compatibility matrix Z
|
|
v1 |
v2 |
v3 |
v4 |
|
v1 |
0.00 |
0.15 |
0.30 |
0.30 |
|
v2 |
0.65 |
0.00 |
0.25 |
0.30 |
|
v3 |
0.55 |
0.60 |
0.00 |
0.60 |
|
v4 |
0.65 |
0.70 |
0.40 |
0.00 |
In order to determine
the non-compliance matrix N, the
extent to which the assessment of the design variant vi is worse than the assessment of the alternative
variant vj
was compared. The value of the non-compliance index nij was determined as
the quotient of the maximum difference in the assessments of the variants after
normalization, when the assessment of the variant vj is higher than the
assessment of the variant vi,
and the difference between the maximum and minimum element of the ZO matrix. The nij determined in this
way was recorded in the N matrix
(Table 5).
Tab. 5
Elements of the
inconsistency matrix N
|
|
v1 |
v2 |
v3 |
v4 |
|
v1 |
0.00 |
0.24 |
0.58 |
1.00 |
|
v2 |
0.07 |
0.00 |
0.48 |
1.00 |
|
v3 |
0.98 |
0.98 |
0.00 |
1.00 |
|
v4 |
0.99 |
0.99 |
0.63 |
0.00 |
3.4. Determination of the binary dominance matrix of
variants and development of the Dominance Graph
Based on the
determined compatibility (Table 4) and incompatibility (Table 5) matrices, a binary
dominance matrix (Table 6) was created, which is a simplified representation of
the dominance relationship between the analyzed variants vi. In the dominance matrix, the value "1"
means that a given variant dominates over another (i.e. surpasses it in more
criteria), while "0" indicates no dominance. Additionally, the
dominance of one variant over another is presented using the Gf
dominance graph. The dominance graph obtained for the analyzed case is
presented in Figure 5, while the ranking of variants is presented in Table 7.
Tab. 6
Binary Dominance
Matrix
|
|
v1 |
v2 |
v3 |
v4 |
|
v1 |
0 |
1 |
0 |
0 |
|
v2 |
0 |
0 |
0 |
0 |
|
v3 |
1 |
1 |
0 |
1 |
|
v4 |
0 |
0 |
0 |
0 |
Tab 7
Ranking of light
commercial vehicle variants
|
|
Incoming (-) |
Outgoing (+) |
Total |
Ranking |
|
v1 |
1 |
1 |
0 |
2 |
|
v2 |
2 |
0 |
-2 |
4 |
|
v3 |
0 |
3 |
3 |
1 |
|
v4 |
1 |
0 |
-1 |
3 |
Fig. 5. Dominance graph for analyzed vehicles
Based on the Gf
graph and the table containing the graph analysis, the final decision variant
was selected. The most advantageous solution is variant v3 (a vehicle with a plug-in hybrid drive), while the
least advantageous is variant v2
(a vehicle with a spark-ignition engine). A vehicle with a diesel engine
(variant v1), which in
2023 accounted for 83% of N1 registrations in the European Union [33], ranked
second.
4. CONCLUSION
In
urban distribution, the main role is played by retail transport to recipients
located in urbanized areas with high traffic and population density, where
transport is carried out over short distances of several to a dozen or so kilometers, i.e. the last mile. Usually, due to space
constraints, cargo is distributed there using light delivery vehicles with
greater maneuverability and lower technical
parameters (vehicle weight, axle load). Recently, there has been a noticeable
trend related to the implementation of activities consisting in the transition
towards sustainable forms of transport. Their aim is to improve the quality of
life of residents by improving air quality, reducing the level of traffic noise
and reducing the phenomenon of road congestion. In connection with this,
actions are being taken to implement innovative solutions consisting in the use
of alternative vehicles, such as bicycles, freight trams or the introduction of
low-emission and zero-emission delivery vehicles.
This
paper concerns the process of evaluation and selection, using the
multi-criteria decision support method MAJA, of light commercial vehicles
intended for the transport of cargo within the last mile of tasks in urban
logistics. In the decision-making process, four variants of the N1 class
vehicle were considered, differentiated in terms of the drive used: internal
combustion (diesel and spark-ignition), plug-in hybrid (PHEV) and electric
(BEV). A set of evaluation criteria was adopted for the analysis, including
economic, environmental, technical and social aspects. In particular, the
following were taken into account: purchase and operation cost, total carbon
footprint (Well-to-Wheel) with an annual mileage of 15,000 km and the average
energy mix of Poland in 2024, vehicle range, availability of charging or refueling infrastructure, charging time, as well as the
possibility of using clean transport zones and bus lanes.
The
conducted research showed that the plug-in hybrid vehicle (variant v₃)
obtained the highest score in the multi-criteria analysis. This solution,
despite higher investment costs than combustion variants, combines the
advantages of the electric drive (lower emissions, quiet operation) with the
flexibility of the combustion engine, which allows for adaptation to various
operational conditions. The obtained result indicates that PHEV is a compromise
between reducing the impact on the environment and maintaining the operational
efficiency of the vehicle. However, it's reasonable to assume that PHEVs
are a transitional solution. Future developments, such as potential declines in
battery costs or increased government incentives, could undoubtedly improve the
economic and operational feasibility of BEVs, potentially allowing them to
overtake PHEVs in the rankings.
Consequently, in the current market and infrastructure
conditions in Poland, vehicles of this type can be considered an optimal
solution in terms of operational efficiency and reliability.
The
key criterion of the analysis was WtW emission, in
which zero- and low-emission variants (BEV and PHEV) significantly outperformed
conventionally powered vehicles in this respect. However, it should be noted
that for the Polish energy mix, still based on fossil fuels, electric vehicles
are not completely zero-emission in terms of the life cycle. Although BEV
achieved the best environmental results among all analyzed
variants, its low position in the ranking (third, penultimate place) was due to
significant economic and operational limitations, such as high purchase cost,
long charging time, limited range and lower availability of charging
infrastructure.
The
study results confirm that the choice of a vehicle for logistics applications
should take into account not only the cost and availability of infrastructure,
but also reliability, flexibility and long-term environmental consequences. The
MAJA method, thanks to its transparency and ability to integrate different
types of data (quantitative, qualitative), proved to be an effective tool for
supporting decisions in conditions where there are many criteria with different
weights.
Future
research plans to conduct a sensitivity analysis to examine how changing the
weightings assigned to various criteria, such as "purchase cost" or
environmental criteria, could affect the final ranking. Furthermore, the
analysis is planned to be extended to other propulsion types (e.g., CNG, FCEV),
including consideration of life-cycle costs (LCC/LCA), and to integrate the
MAJA method with dynamic or simulation approaches, allowing for modeling decisions under changing market and operational
conditions.
References
1.
National
Centre for Emission Balancing and Management. 2025. "CO₂ Market
Report". Available at:
https://www.kobize.pl/pl/fileCategory/id/5/raport-z-rynku-co2.
2.
International
Energy Agency. 2025. Available at: https://www.iea.org/.
3.
Intergovernmental
Panel on Climate Change. 2025. Available at: https://www.ipcc.ch/.
4.
European
Environment Agency. 2025. Available at: https://www.eea.europa.eu/publications.
5.
Legret
M., Ch. Pagotto. 1999. “Evaluation of pollutant loadings in the runoff waters
from a major rural highway”. Science of the Total Environment 235: 143-150. ISSN: 0048‑9697.
DOI: https://doi.org/10.1016/S0048-9697(99)00207-7.
6.
Sörme,
L., B. Bergbäck, U. Lohm. 2001. “Century perspective of metal use in urban
areas – A case study of Stockholm”. Water, Air, and Soil Pollution: Focus
1(3-4): 197-211. DOI:
https://doi.org/10.1023/A:1017564407076.
7.
Hjortenkrans,
D., B. Bergbäck, A. Haggerud. 2006. “New metal emission patterns in road
traffic environments”. Environmental Monitoring and Assessment 117: 85-98. DOI: https://doi.org/10.1007/s10661-006-7706-2.
8.
Chen, P.,
Q. Wang, M, Shao, R. Liu. 2024. „Significantly underestimated traffic‑related
ammonia emissions in Chinese megacities: Evidence from satellite observations
during COVID‑19 lockdowns”. Chemosphere 361: 142497. DOI:
https://doi.org/10.1016/j.chemosphere.2024.142497.
9.
Chatain
M., E. Chretien, S. Crunaire, E. Jantzem. 2022. “Road Traffic and Its Influence
on Urban Ammonia Concentrations (France)”. Atmosphere 13: 1032. DOI:
https://doi.org/10.3390/atmos13071032.
10.
Heydari
S., M. Tainio, J. Woodcock, A. de Nazelle. 2020. "Estimating traffic
contribution to particulate matter concentration in urban areas using a
multilevel Bayesian meta‑regression approach”. Environment
International 141: 105800. DOI:
https://doi.org/10.1016/j.envint.2020.105800.
11.
Sundvor
I., N.C. Balaguer, M. Viana, X. Querol, C. Reche, F. Amato, G. Mellios, C. Guerreiro. 2012. “Road traffic’s contribution to air
quality in European cities”. ETC/ACM Technical Paper 14.
12.
European
Environment Agency. 2019. “Environmental noise in Europe – 2020”. Available at:
https://www.eea.europa.eu/en/analysis/publications/environmental-noise-in-europe.
13.
Transport
Intelligence. Research Reports. Available at:
https://ti-insight.com/research-papers/all-reports/.
14.
Oflakowski
K. 2021. “The Hot Last Mile of E-Commerce”. Available at:
https://logistyka.rp.pl/logistyka-kontraktowa/art17119221-goraca-ostatnia-mila-e-handlu.
15.
WIADOMOŚCIHANDLOWE.PL.
2022. “The last mile must become increasingly green”. Available at:
https://www.wiadomoscihandlowe.pl/artykul/ostatnia-mila-musi-byc-coraz-bardziej-zielona-rozwiazaniem-automaty-paczkowe-i-pojazdy-elektryczne.
16.
AnalizaRynku.eu.
Available at: https://analizarynku.eu/.
17.
Electric
Vehicles Promotion Foundation. 2022. “How e-commerce is polluting our cities.
An analysis of 90 courier companies from around the world”. Available at:
https://fppe.pl/raport-jak-e-handel-zanieczyszcza-nasze-miasta.
18.
Jacyna M.
1998. „Some aspects of multicriteria evaluation of traffic flow distribution in
a multimodal transport corridor”. Archives of Transport 10(1-2): 5-19.
19.
Jacyna M.
2001. „Multicriteria modeling as applied to the evaluation of transportation
systems”. Prace Naukowe Politechniki Warszawskiej, Transport 47: 3-139.
20.
Jacyna M., S. Kakietek,
M. Przygocki. 2003. „Multicriteria modeling of traffic flow
distribution in a multimodal transport corridor. Part II – Assessment of
infrastructure adjustment to tasks”. Prace Naukowe Politechniki
Warszawskiej, Transport 52: 57-63.
21.
Jacyna
M., M. Wasiak. 2007. „Method of multicriteria evaluation of options for the
implementation of infrastructure investments in transport”. Prace Naukowe
Politechniki Warszawskiej, Transport 63: 119-124.
22.
Jacyna
M.. 2022. Decision support in engineering practice. Warszawa: Polish
Scientific Publishers PWN.
23.
“Regulation
of the Minister of Infrastructure of 24 October 2005 on type approval of motor
vehicles and trai-lers”. Available at:
https://dziennikustaw.gov.pl/D2005238201001.pdf.
24.
Roy, B.
1990. Multi-criteria decision suport. Wydawnictwa Naukowo-Techniczne,
Warszawa.
25.
Vincke
P.1992. “Multicriteria Decision – Aid”. Chichester: John Wiley & Sons.
26.
Polish
Organization of Petroleum Industry and Trade. Available at: https://popihn.pl/.
27.
Ford
Motor Company. Available at: https://www.ford.pl/.
28.
Alternative
Fuel Infrastructure Register. Available at: https://eipa.udt.gov.pl/.
29.
AutoŚwiat.
Available at: https://www.auto-swiat.pl.
30.
TRANSIT
CENTER. Available at: https://www.transitcenter.pl/.
31.
superauto.pl.
Available at: https://www.superauto.pl/.
32.
International
Council on Clean Transportation. Available at: https://theicct.org/.
33.
European
Automobile Manufacturers’Association. Available at:
https://www.acea.auto/files/.
Received 04.10.2025; accepted in revised form 18.02.2026
![]()
Scientific Journal of Silesian
University of Technology. Series Transport is licensed under a Creative
Commons Attribution 4.0 International License