Article
citation information:
Jašek,
M., Olivková, I. Simulation of a queuing model for passenger handling at an airport
terminal. Scientific Journal of Silesian
University of Technology. Series Transport. 2026, 130, 111-124. ISSN: 0209-3324. DOI: https://doi.org/10.20858/sjsutst.2026.130.7
Martin JAŠEK[1],
Ivana OLIVKOVÁ[2]
SIMULATION OF A
QUEUING MODEL FOR PASSENGER HANDLING AT AN AIRPORT TERMINAL
Summary. This study focuses on
simulating a queuing model aimed
at optimizing the passenger processing at an airport. The objective is
to minimize waiting times and reduce operational costs. The model employs
Markov processes to simulate two main phases: passport and security screening.
The simulation aims to keep waiting times for passport control under 8 minutes
and for security screening under 2 minutes for priority passengers. Software
tools Witness were used, and simulations were conducted at intervals of 60 and
75 minutes. The results indicate that longer intervals lead to increased
average waiting times and higher costs per passenger. The study also includes
an analysis of the operational characteristics of Václav Havel Airport in
Prague, with a focus on the capacity and efficiency of the processing counters.
The outputs from this simulation provide valuable insights for improving
airport management and planning, aiming to enhance efficiency and passenger
satisfaction.
Keywords: queuing model, airport operations simulation, Markov processes,
passenger processing, operational efficiency
1. INTRODUCTION
Passenger processing is one of the key
components that shape the overall airport experience and influence how
travelers perceive the quality of airline services. Because the passenger check‑in
process significantly shapes how travelers perceive the quality of airline
services, this study focuses on analyzing this part of airport operations. [1]
The decisive factor is not only the speed of
security and passport control, but above all, the ability to process all
passengers within the required time window. The main goal was to create a
mathematical simulation of a generally applicable model for airports of various
sizes, with the basic setup of the model corresponding to Václav Havel Airport
in Prague.
The topic of mathematical models applicable at
airports has been addressed by both mathematicians on the European continent
[2] and Asian researchers [3].
2. BASIC
DESCRIPTION OF A QUEUEING MODEL FOR PASSENGER CHECK-IN
This
chapter provides an overview of the queuing model, including its structure,
assumptions, and the operational parameters used to represent the check‑in
process.
This
is a Markov queuing model with parallel lane ordering, where passport control
(average service time 15 s per passenger) and security screening (average
service time 18 s per passenger) are performed independently in each lane. The
service times were modelled as deterministic values, as they were derived from
direct observations of real operations.
Validation
of the service times was conducted at two levels.
The
first level consisted of logical validation (face validity), which verified
that the model behaves realistically under different passenger arrival
intensities and that the throughput of individual lanes corresponds to
theoretical expectations based on the specified service times.
The
second level of validation was empirical. The service times used in the model
were obtained from instructional videos of real airport operations (Istanbul
Airport) and subsequently compared with independent measurements carried out in
real operation at a Czech regional airport. The measured values were consistent
with the parameters used in the model, confirming that the selected service
times realistically represent actual processing speeds.
The
queue capacity in the system is unlimited (no passengers are rejected), and the
order of service follows the FIFO principle. [4] Passenger arrivals were
modelled using a Poisson distribution, which is commonly used to represent
random arrival processes in airport operations and queuing systems. Service
times at security screening and passport control were modelled using an
exponential distribution, reflecting the assumption of memoryless processing
and allowing the model to capture natural variability in service duration.
These assumptions are standard in queuing theory and provide a reasonable
approximation of real operational conditions. The hourly arrival rate varies
depending on the aircraft scheduled for departure, assuming full occupancy. The
objective was to keep the maximum waiting time below 8 minutes for standard
passengers and below 2 minutes for priority passengers. Operational costs were
also incorporated into the model.
In
addition to the standard processing system, a separate subsystem was created
for priority passengers. Priority passengers were routed into dedicated
security lanes and dedicated passport control counters, operating fully
independently from the standard passenger flow. No shared queues or pre-emption
rules were used. Both subsystems employed identical service-time parameters,
but the priority subsystem was dimensioned to ensure that the maximum waiting
time did not exceed 2 minutes. The proportion of priority passengers was fixed
at 20% of the total hourly passenger volume, and these passengers were directed
to the priority subsystem immediately upon arrival.
3. CONDUCTING SIMULATION AND DETERMINING OPERATIONAL
CHARACTERISTICS
Here, the simulation procedure is described in
detail, together with the configuration of model components and the method used
to evaluate system performance.
The simulation
was conducted in intervals of 60 and 75 minutes using the Witness software.
Components such as 'Passenger' and 'Luggage' were created, along with machines
such as 'Splitter' (splitting one 'Passenger' component into two 'Luggage' and
'Passenger' components), 'Security' (baggage check), 'Scanner' (passenger
screening), and 'Passport' (passport control and reuniting the split
components). For the 'Passport' machine, it was also necessary to ensure that
each passenger took their own luggage, which was achieved by creating an
attribute and the 'MATCH' rule. Lastly, a buffer 'Queue,' a variable
'Passenger_Order,' and an attribute 'Order' (both used to match passengers with
their luggage) was created. After completing the entire security screening,
passengers with their luggage were sent to the gate (not part of the model),
which was achieved with the output rule 'PUSH TO SHIP.' The number of active security lanes and
passport control counters was not determined using a formal optimization
algorithm. Instead, an iterative heuristic approach was applied, in which
individual system configurations were tested in progressively refined steps. At
the end of each simulation run, the operational characteristics of the
'Passenger' component were determined by opening the 'Statistics' window, where
average and maximum waiting times were observed. For each hourly load, the
simulation was run once and repeated twice to verify consistency. Witness generates deterministically identical
results due to its fixed random seed (default value used), ensuring full
reproducibility without multiple replications. It should be noted that after
some simulation runs (after the set time interval – 60 or 75 min.), some
passengers and their luggage remained in the system and had not been fully
processed. Therefore, it was necessary to create the variable 'Processed,'
which displayed the total number of passengers and luggage that had been fully
processed. The condition was that at the end of the simulation run, no one
remained in the queue. [5]
In the following section, there is a Fig. 1
depicting the layout of elements in the system within the Witness simulation
software. It shows the system state after 45 minutes, including some
in-progress requests (passengers and luggage separately) and passengers waiting
in the queue. The Fig. 1 also displays the processed passenger counts and the
pairing of passengers with their luggage at the passport control counters.
Weekly
traffic at Václav Havel Airport Prague was monitored. The Tab. 1 below shows
the number of departing passengers. These numbers were determined based on the
aircraft as-signed to specific flights. There is a time shift for each hour,
meaning that for Wednesday, 406 passengers are scheduled for check-in from
00:00 a.m. to 01:00 a.m., with their departure planned between 01:00 a.m. and
02:00 a.m. These were flights to Hurghada (Boeing 737-900 OK-TSM) and Marsa
Alam (Boeing 737 MAX 8 OK-SWA).
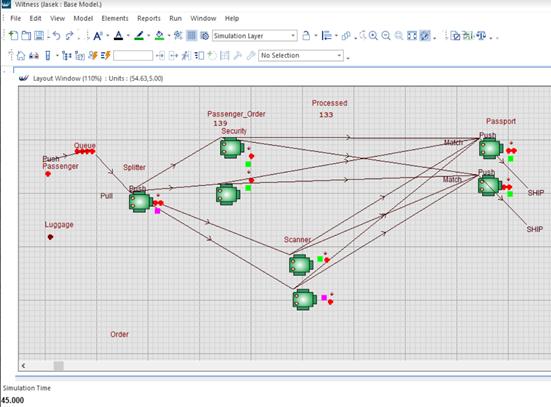
Fig. 1. Sample of the
current simulation environment (Witness)
Tab. 1
Some departures from October 4, 2023 [6]
|
Scheduled departure time |
Flight number |
Destination |
Airline |
Aircraft |
|
0:50 |
QS1240 |
Hurghada |
Smartwings |
B739 (OK-TSM) |
|
0:55 |
QS2568 |
Marsa Alam |
Smartwings |
B38M (OK-SWD) |
|
1:00 |
QS2558 |
Hurghada |
Smartwings |
B739 (OK-TSM) |
|
1:10 |
QS1222 |
Marsa Alam |
Smartwings |
B38M (OK-SWA) |
|
4:05 |
QS1108 |
Larnaca |
Smartwings |
B738 (OK-TST) |
|
4:45 |
QS1146 |
Rhodes |
Czech Airlines |
A320 (OK-IOO) |
4. AIRCRAFT CAPACITIES AND CHECK-IN CAPACITIES NEEDED
This part summarizes the aircraft types
operating at the airport and uses their seating capacities to estimate hourly
passenger volumes.
To determine the exact number of passengers that
need to be processed for departure, it was necessary to estimate the
approximate number of passengers for each individual type of aircraft and then
sum up the aircraft capacities for each hour. This is mentioned in Tab. 2.
Tab. 2
An overview of aircraft types and their
configurations that appeared at
the airport during the given week [7][8]
|
Aircraft type |
Number of seats |
Aircraft type |
Number of seats |
|
Airbus A220-133 |
133 |
Bombardier CRJ 1000 |
100 |
|
Airbus A380 |
550 |
Embraer E170 |
72 |
|
ATR 72-500 |
68 |
Embraer E175 |
88 |
|
ATR 72-600 |
78 |
Embraer E190 |
114 |
|
Bombardier CRJ 900 |
90 |
Embraer E195 |
116 |
|
Airbus A318 |
132 |
Fokker 100 |
122 |
|
Airbus A319 |
160 |
Boeing 737-300 |
149 |
|
Airbus A320 |
190 |
Boeing 737-400 |
147 |
|
Airbus A321 |
230 |
Boeing 737-700 |
149 |
|
Airbus A330-200 |
260 |
Boeing 737-800 |
189 |
|
Airbus A350 |
350 |
Boeing 737-900 |
217 |
|
Boeing 777-300 |
396 |
Bombardier CRJ 1000 |
100 |
The first level represented logical validation (face validity), which
verified that the model exhibits realistic behavior under various intensities
of incoming passengers and that the throughput of individual lanes corresponds
to theoretical assumptions derived from service times.
The second level of validation was empirical and focused on verifying the
service times used in the model. These values were obtained from instructional
videos of real operations (e.g., Istanbul Airport) and subsequently compared
with independent measurements conducted during actual operations at a Czech
regional airport. The measured values differed only minimally from the
parameters used, confirming that the selected service times realistically
correspond to actual operations.
The
following Tab. 3 a Tab. 4 contains the number of passengers per hour and day
that need to be processed. There are no passengers for the time 1:00 a.m. -
3:00 a.m. All data are from the year 2023.
Tab. 3
Number of passengers needed to be processed
during the selected week (morning)
|
Time |
Wed 04/10 |
Thu 5/10 |
Fri 6/10 |
Sat 7/10 |
Sun 8/10 |
Mon 9/10 |
Tue 10/10 |
|
|
a.m. |
0:00 – 1:00 |
406 |
|
|
|
378 |
|
|
|
3:00 – 4:00 |
1,704 |
|
|
|
1,490 |
406 |
|
|
|
4:00 – 5:00 |
|
|
|
|
190 |
189 |
|
|
|
5:00 – 6:00 |
1,705 |
1,784 |
190 |
|
798 |
2,341 |
|
|
|
6:00 – 7:00 |
727 |
655 |
756 |
|
654 |
580 |
|
|
|
7:00 – 8:00 |
1,416 |
1,431 |
2,203 |
799 |
1,715 |
1,662 |
438 |
|
|
8:00 – 9:00 |
1,387 |
2,486 |
1,692 |
1,962 |
1,436 |
1,704 |
2,062 |
|
|
9:00 – 10:00 |
2,589 |
1,543 |
2,393 |
1,325 |
2,025 |
2,296 |
1,297 |
|
|
10:00 – 11:00 |
2,866 |
2,232 |
1,942 |
1,923 |
2,436 |
3,220 |
2,448 |
|
|
11:00 – 12:00 |
2,614 |
2,144 |
2,914 |
2,333 |
2,146 |
1,357 |
801 |
|
Tab. 4
Number of passengers needed to be processed
during the selected week (afternoon)
|
|
Time |
Wed 04/10 |
Thu 5/10 |
Fri 6/10 |
Sat 7/10 |
Sun 8/10 |
Mon 9/10 |
Tue 10/10 |
|
p.m. |
12:00 – 1:00 |
1,199 |
1,198 |
1,169 |
917 |
818 |
946 |
818 |
|
1:00 – 2:00 |
1,678 |
2,141 |
1,757 |
1,281 |
2,548 |
2,171 |
1,080 |
|
|
2:00 – 3:00 |
1,858 |
1,876 |
1,266 |
1,354 |
1,819 |
1,497 |
1,458 |
|
|
3:00 – 4:00 |
1,063 |
804 |
1,981 |
1,254 |
1,414 |
2,070 |
874 |
|
|
4:00 – 5:00 |
2,015 |
595 |
878 |
717 |
1,296 |
915 |
997 |
|
|
5:00 – 6:00 |
1,912 |
2,163 |
2,876 |
2,606 |
2,173 |
2,463 |
1,568 |
|
|
6:00 – 7:00 |
2,199 |
1,334 |
1,769 |
1,917 |
1,747 |
1,221 |
917 |
|
|
7:00 – 8:00 |
1,215 |
1,536 |
1,067 |
538 |
1,335 |
1,844 |
994 |
|
|
8:00 – 9:00 |
1,236 |
1,867 |
1,836 |
1,096 |
1,108 |
1,267 |
1,079 |
|
|
9:00 – 10:00 |
1,028 |
379 |
986 |
|
230 |
1,257 |
636 |
|
|
10:00 – 11:00 |
189 |
217 |
217 |
946 |
217 |
189 |
189 |
Operational characteristics were analyzed separately for
60-minute and 75-minute intervals. To ensure that no passengers were turned
away, in other words, to ensure that all passengers were processed before the
aircraft's departure (within the given time interval), it was necessary to
configure the system (number of counters) so that no passengers were left
waiting at the end of the selected time interval. [9]
5. SYSTEM WITH A 60-MINUTE INTERVAL AND A MAXIMUM WAITING
TIME OF 8 MINUTES
The
following section presents the results for the standard service scenario and
examines how different system configurations affect waiting times and costs.
The
number of counters was adjusted in this case to ensure that all passengers were
processed within 60 minutes and to avoid exceeding the maximum waiting time of
8 minutes.
Tab.
5 below shows that increasing the number of security lanes and passport control
counters leads to a systematic reduction in maximum waiting times. At low
passenger volumes (e.g., 91 passengers per hour), the system operates with
minimal infrastructure, but the waiting times remain relatively high due to the
limited number of active counters. As the hourly passenger load increases,
additional counters are activated, which stabilizes both the average and
maximum waiting times despite the higher demand.
The
unit cost per passenger decreases as the number of processed passengers grows.
This trend reflects the fixed-cost nature of the system: once additional
counters are activated, their operational cost is distributed across a larger
number of passengers, resulting in lower per‑passenger costs. On the
other hand, at very high passenger volumes (above 2,000 passengers per hour),
the system reaches almost the same costs as in the case of lower passenger
volumes.
As
the Tab. 5 and Fig. 2 show, increasing the number of counters significantly
reduces the maximum waiting time. As the number of processed passengers grows,
the unit costs are initially high but gradually decrease and remain at
approximately the same level.
Tab. 5
Operational characteristics
for different numbers of passengers processed per hour
|
Number of |
Number of lanes set |
Number of passport counters |
Costs per passenger [EUR] |
Waiting time [s] |
|
|
Average |
Maximum |
||||
|
91 |
1 |
1 |
0.425 |
106.2 |
307.2 |
|
329 |
3 |
3 |
0.385 |
124.2 |
360.6 |
|
606 |
5 |
5 |
0.383 |
141 |
289.2 |
|
852 |
7 |
7 |
0.385 |
153 |
298.2 |
|
1,089 |
9 |
9 |
0.377 |
145.2 |
289.2 |
|
1,359 |
11 |
11 |
0.373 |
127.8 |
233.4 |
|
1,627 |
13 |
13 |
0.374 |
144 |
256.8 |
|
1,869 |
15 |
15 |
0.369 |
112.8 |
216.6 |
|
2,145 |
17 |
17 |
0.370 |
132.6 |
247.2 |
|
2,392 |
19 |
19 |
0.373 |
126 |
232.2 |
|
2,501 |
20 |
20 |
0.425 |
117.6 |
223.8 |
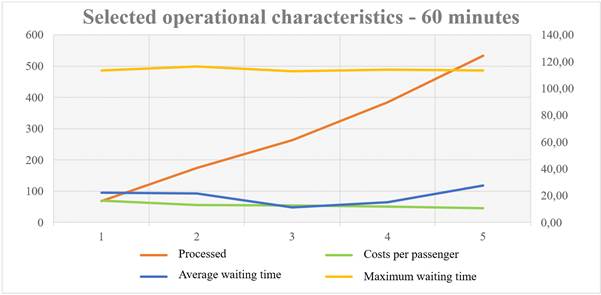
Fig.
2. Variation of selected operational characteristics for the
hourly interval
6. SYSTEM WITH A 60-MINUTE INTERVAL AND A MAXIMUM WAITING TIME
OF 2 MINUTES
This
chapter focuses on the priority processing scenario, analyzing the
infrastructure required to maintain significantly shorter waiting times.
In
addition to ensuring that no passengers are left in the queue at the end of the
required time interval, it was also necessary to reduce the maximum waiting
time to 2 minutes. Therefore, compared to the previous configurations, a
greater number of lanes had to be added.
The
number of lanes was adjusted in this case to ensure that all passengers were
processed and that the maximum waiting time of 2 minutes was not exceeded.
Tab.
6 shows that meeting the stricter requirement of a maximum 2‑minute
waiting time requires a disproportionately higher number of processing lanes,
even at relatively low passenger volumes. The system must therefore operate
with several dedicated priority lanes to maintain the required service level.
Tab. 6
Operational characteristics for different
numbers of passengers processed per hour
|
Number of |
Number of lanes set (1 security + 1
scanner) |
Number of passport counters |
Costs per passenger [EUR] |
Waiting time [s] |
|
|
|
|
|
|
Average |
Maximum |
|
69 |
1 |
1 |
0.676 |
22.2 |
113.4 |
|
174 |
2 |
2 |
0.535 |
21.6 |
116.4 |
|
263 |
3 |
3 |
0.532 |
11.4 |
112.8 |
|
384 |
4 |
4 |
0.485 |
15 |
114 |
|
534 |
5 |
5 |
0.437 |
27.6 |
113.4 |
The maximum waiting time stays close to the 2‑minute limit across
all configurations, confirming that the system is correctly dimensioned.
However, the unit cost per passenger is higher than in the standard model
because priority processing requires more infrastructure per traveler. This
illustrates the fundamental trade‑off: very short waiting times can be
achieved, but only at the expense of higher operational costs. The variation of
selected operational characteristics is shown in Fig. 3.
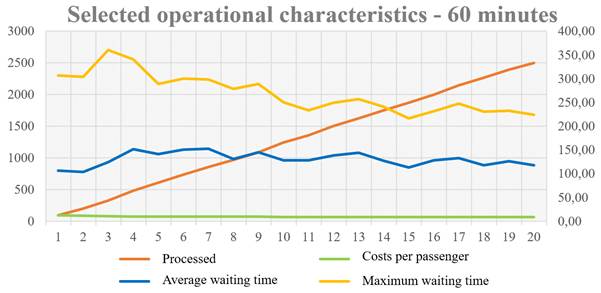
Fig. 3. Variation of selected operational
characteristics for
the hourly interval with a maximum waiting time of 2 minutes
During
the research experiment, changes in system behavior were also tested by
extending the interval to 75 minutes. With this change in the check-in
interval, both configurations (basic and priority) saw an increase in unit
costs, with the priority model's unit costs rising by 19%. Although the number
of passengers processed in the basic model increased by one-tenth,
the unit costs also rose by approximately the same margin. This longer interval
did not bring any significant benefits, as the number of processed passengers
remained relatively low, leading to an undesirable increase in unit costs.
While unit costs in the priority model remained stable, the maximum wait time
did not change, and the average wait time only decreased slightly. However, in
the model with a one-hour interval and an eight-minute maximum wait time, there
were large fluctuations in waiting times. Overall, unit costs and average wait
times remained relatively stable in both intervals, suggesting that extending
the check-in interval may not be efficient given the low number of passengers.
7. THEORETICAL IMPLEMENTATION OF THE MODEL FOR VÁCLAV HAVEL
AIRPORT IN PRAGUE
This section discusses how the proposed model could be
applied in practice at Václav Havel Airport, taking into account its current
layout and operational constraints.
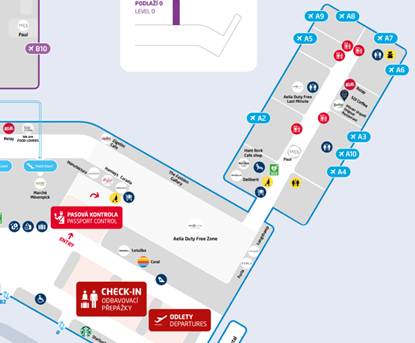
The queuing system was originally intended for the airport in Prague, as
shown in Fig. 4. Security screening at Václav Havel Airport takes place at
twelve locations according to the map of Terminals 1 and Terminal 2. The number
of gates available for use is around fifty.
Fig. 4. Extract from the terminal map of
Václav Havel Airport [10]
The security screening could therefore take place at
multiple locations at this airport simultaneously. Based on the daily aircraft
stand utilization plan, the required number of security screening counters
could be activated at each individual gate, depending on which aircraft are
scheduled to be stationed there.
8. COST CALCULATION ASSOCIATED WITH SECURITY AND PASSPORT
CONTROL
The economic aspect of the model is
introduced here, explaining how operational costs are derived and how they
relate to system performance.
In addition to analyzing waiting times and
system throughput, it is important to assess the economic implications of
different configurations of security and passport control counters. The cost
calculation provides a quantitative measure of operational efficiency and
allows the comparison of alternative setups in terms of their financial impact
per processed passenger.
Formula for calculating the costs that each
passenger must pay in EUR:

where ![]() is the length of the time interval,
is the length of the time interval, ![]() are the costs that each passenger must pay,
are the costs that each passenger must pay, ![]() is the number of luggage and security scanners
in operation,
is the number of luggage and security scanners
in operation, ![]() is the number of passport control counters,
is the number of passport control counters, ![]() is the number of passengers processed, 6,19 is
the hourly rate for the annual rental of a counter, and 9,36 is the hourly cost
associated with paying employee wages.
is the number of passengers processed, 6,19 is
the hourly rate for the annual rental of a counter, and 9,36 is the hourly cost
associated with paying employee wages.
Calculation of unit costs for the case of a 75-minute
interval, 176 processed passengers, 2 baggage screening counters, 2
security scanners for passenger screening, and 2 passport control
counters:
![]()
The
cost parameters used in the model are based on the official price list of
Václav Havel Airport Prague. nA hourly cost of approximately 6,19 EUR per
counter. The labor cost of 9.36 EUR
per hour reflects the average hourly wage associated with operating security
and passport control positions. These values were selected to represent
realistic airport operating expenses and to ensure that the economic component
of the model corresponds to actual operational conditions.
A
linear cost structure was adopted because both counter rental fees and labor
costs increase proportionally with the number of active processing stations.
The resulting unit cost per passenger is calculated by dividing the total
hourly operational cost by the number of passengers processed within the
interval, which enables a direct comparison of different system configurations.
9. EXAMPLE ON A SPECIFIC DAY
This chapter
applies the model to real traffic data from a selected day and demonstrates how
passenger demand influences the required number of counters and resulting
costs.
Let us
consider the case hwere on Wednesday, October 4th, around 31,000 passengers
will be processed. These passengers arrive at the security checkpoint one hour
before boarding (operating interval of 60 minutes) at varying intensities,
calculated based on the deployed aircraft and seat configurations listed in the
table above. [8] To ensure that all passengers are processed on time and do not
have to wait long in the queue, the corresponding minimum number of counters
must be activated. These numbers were obtained by approximating the calculated
states shown in the tables above. Additionally, 20% of these passengers are
premium, meaning they have purchased priority processing with reduced waiting
times.
Tab. 7 shows
how the required number of counters changes throughout the day in response to
fluctuating passenger demand. During peak hours, both standard and priority
systems require substantially more security lanes and passport counters to
process all passengers within the 60‑minute interval, while off‑peak
periods require only minimal infrastructure.
Priority passengers require additional dedicated
counters, which raises total costs slightly, but the difference between
standard and priority processing remains relatively small, indicating efficient
dimensioning of the priority subsystem.
Tab. 7
The cost of the system at different intensities of incoming passengers
|
Wed 4/10 |
Number of passengers by fare type |
|
|||||||
|
Time [h] |
|||||||||
|
|
|
|
|
|
|
|
|
|
|
|
a.m. |
0:00 – 1:00 |
325 |
81 |
4 |
4 |
2 |
2 |
93,32 |
0,69 |
|
3:00 – 4:00 |
1,363 |
341 |
12 |
12 |
4 |
4 |
186,63 |
0,44 |
|
|
5:00 – 6:00 |
1,364 |
341 |
12 |
12 |
4 |
4 |
186,63 |
0,44 |
|
|
6:00 – 7:00 |
582 |
145 |
5 |
5 |
2 |
2 |
93,32 |
0,45 |
|
|
7:00 – 8:00 |
1,133 |
283 |
10 |
10 |
3 |
3 |
139,98 |
0,43 |
|
|
8:00 – 9:00 |
1,110 |
277 |
10 |
10 |
4 |
4 |
186,63 |
0,47 |
|
|
9:00 – 10:00 |
2,071 |
518 |
17 |
17 |
6 |
6 |
279,95 |
0,41 |
|
|
10:00 – 11:00 |
2,293 |
573 |
19 |
19 |
6 |
6 |
279,95 |
0,41 |
|
|
11:00 – 12:00 |
2,091 |
524 |
17 |
17 |
5 |
5 |
233,29 |
0,39 |
|
|
p.m. |
12:00 – 1:00 |
1,342 |
336 |
11 |
11 |
4 |
4 |
186,63 |
0,42 |
|
1:00 – 2:00 |
1,486 |
372 |
12 |
12 |
4 |
4 |
186,63 |
0,40 |
|
|
2:00 – 3:00 |
850 |
213 |
7 |
7 |
3 |
3 |
139,98 |
0,44 |
|
|
3:00 – 4:00 |
1,612 |
403 |
13 |
13 |
5 |
5 |
233,29 |
0,42 |
|
|
4:00 – 5:00 |
1,530 |
382 |
13 |
13 |
4 |
4 |
186,63 |
0,42 |
|
|
5:00 – 6:00 |
1,759 |
440 |
15 |
15 |
5 |
5 |
233,29 |
0,42 |
|
|
6:00 – 7:00 |
972 |
243 |
9 |
9 |
3 |
3 |
139,98 |
0,46 |
|
|
7:00 – 8:00 |
989 |
247 |
9 |
9 |
3 |
3 |
139,98 |
0,45 |
|
|
9:00 – 10:00 |
822 |
206 |
7 |
7 |
3 |
3 |
139,98 |
0,45 |
|
|
10:00 – 11:00 |
151 |
38 |
2 |
2 |
1 |
1 |
46,66 |
0,74 |
|
where:
![]() - number of basic fare passengers,
- number of basic fare passengers,
![]() - number of priority fare passengers,
- number of priority fare passengers,
![]() - number of lanes (security + scanner),
- number of lanes (security + scanner),
![]() - number of passport counters,
- number of passport counters,
![]() - number of priority lanes (security +
scanner),
- number of priority lanes (security +
scanner),
![]() - number of priority passport counters,
- number of priority passport counters,
![]() - total costs,
- total costs,
![]() - costs per passenger.
- costs per passenger.
Note: In the column ![]() the costs are higher compared to
the previous tables. This is because the number of passengers registered for
the flight are intermediate values from the previous tables. To ensure all
passengers are processed on time, it was necessary in some cases to increase
the number of counters by one compared to the tables, which resulted in an
increase in the average unit cost per passenger.
the costs are higher compared to
the previous tables. This is because the number of passengers registered for
the flight are intermediate values from the previous tables. To ensure all
passengers are processed on time, it was necessary in some cases to increase
the number of counters by one compared to the tables, which resulted in an
increase in the average unit cost per passenger.
10. CONCLUSIONS
The final
section summarizes the key findings, reflects on the model’s limitations, and
outlines directions for further research and practical application.
The initial
intention was to calculate the required number of lanes for entire days, with
simulations running in 24‑hour cycles. This approach was eventually
abandoned due to excessive computational demands and the unrealistic number of
lanes required for continuous operation. Instead, simulations were performed
for different hourly passenger intensities, allowing the system to activate
only the number of lanes needed in each specific hour. This approach proved
significantly more efficient: for example, at peak loads exceeding 2,000
passengers per hour, the system required up to 17 security lanes and 17
passport counters, whereas off‑peak periods operated with only one or two
active stations. The results also showed that the unit cost per passenger decreases
as the number of processed passengers increases, stabilizing at approximately
0.37-0.39 EUR per passenger in the standard model. In contrast, the priority
model achieved waiting times below 2 minutes but required substantially more
infrastructure, resulting in higher unit costs (0.43-0.68 EUR per passenger).
Extending the
processing interval from 60 to 75 minutes did not bring operational benefits.
Although the number of processed passengers increased slightly, unit costs rose
by approximately 10-19%, and waiting times fluctuated more significantly. These
findings indicate that shorter processing intervals are more efficient for
maintaining stable waiting times and predictable operational costs. Provided
that service times at security screening and passport control remain
comparable, the model can be applied to airports of various sizes, which
represents one of its practical advantages.
The simulation
model also has several limitations, particularly in its ability to fully
capture qualitative aspects of service delivery. Validation is constrained by
the availability and accuracy of operational data, and the model may not fully
reflect real peak loads or actual aircraft occupancy. Moreover, the model
focuses primarily on time‑based indicators such as waiting time, while
other factors influencing perceived service quality (such as comfort,
cleanliness, or the availability of information) are not included. Passenger
perceptions of acceptable waiting times also vary and are not represented in
the model. For these reasons, the simulation could be complemented by
additional service quality assessment methods and passenger feedback to provide
a more comprehensive evaluation. [11]
[12]
The findings
of this study are consistent with previous research on airport queuing systems.
Similar to Zhang et al. (2017) and Chen & Yu (2020), the results confirm
that reducing processing intervals and increasing the number of active lanes
significantly decreases waiting times, but at the cost of higher staffing
requirements. The observed nonlinear increase in required counters at high
passenger volumes is consistent with the findings of Dorton (2015), who showed
that passenger throughput at security checkpoints is highly sensitive to demand
fluctuations and that additional lanes reduce waiting times only up to a
certain capacity threshold. Similarly, the results reported by Li, Gao, Xu and
Zhou (2018) demonstrate that both queuing‑network models and
discrete‑event simulation reveal diminishing returns when increasing lane
capacity and that maintaining very short waiting times requires
disproportionately higher staffing levels. These conclusions align with our
results, which also show clear capacity limits and a trade‑off between
short waiting times and higher operational costs. [13] [14]
From a
practical perspective, the model provides several recommendations for airport
operators. Airports with fluctuating hourly demand should dynamically activate
only the number of lanes required for each specific hour, as this approach
minimises operational costs while maintaining acceptable waiting times.
Priority processing can be offered as a premium service, but airports should be
aware that maintaining a maximum waiting time of 2 minutes requires
significantly more infrastructure. Finally, extending the processing interval
beyond 60 minutes is not recommended, as it increases operational costs without
improving system performance. [15]
Acknowledgements
This work was supported by the project SP2024/095 Research,
Development, and Innovation in the Field of Transport and Logistics.
References
1.
Al Masud
Anas. 2023. Airports Feedback System: Importance, Types + Pros &
Cons. QuestionPro. Available at:
https://www.questionpro.com/blog/airports-feedback-system/.
2.
Psaraftis
H.N. 1978. A dynamic programming approach to the aircraft sequencing
problem. Cambridge (MA): Massachusetts Institute of
Technology, Flight Transportation Laboratory. Report No. R78-4. 174 p.
3.
Kim D.U., J. Min-Seok, W.H. Choi. 2017. Airport Simulation Development
Using Arena. In: Advanced Science
and Technology Letters. Vol. 149, P. 5-8. DOI:
10.14257/astl.2017.149.02.
4.
Dorda M. 2022. Teorie
hromadné obsluhy. [In Czech: Queuing theory]. Ostrava: VSB – Technical University of Ostrava.
Available at: http://homel.vsb.cz/~dor028/Hromadna_obsluha.pdf4.
5.
Dorda M. 2018. Počítačová
podpora projektování logistických systémů. [In
Czech: Computer-aided design of logistics systems]. Ostrava: VSB – Technical
University of Ostrava. Available from:
https://homel.vsb.cz/~dor028/Aplikace_PC_2.htm.
6.
Live Flight Tracker – Real-Time Flight Tracker Map. Flightradar24. 2025. Available at: https://www.flightradar24.com/.
7.
Aircraft seat configurations. Airports Worldwide. 2009.
Available at: https://www.airports-worldwide.com/articles/article1435.php.
8.
Aircraft
Technical Data & Specifications.
Airliners.net. 2024. Available at: https://www.airliners.net/aircraft-data
9.
Thiagaraj R., C. Ramasamy. 2014. “Application of the
queuing theory in characterizing and optimizing the passenger flow at the
airport security”. Applied Mathematical Sciences 8(69-72): 3447-3456. ISSN: 1312‑885X.
Available at:
https://www.m-hikari.com/ams/ams-2014/ams-69-72-2014/thiagarajAMS69-72-2014.
10. Václav Havel Airport Prague Map. Prague: Letiště
Praha, a.s. 2025. Available at: https://www.prg.aero/en/map-airport.
11. Had P., J. Volt, S. Stojić. 2025. “Calculation of
queue formation and queue length at airport check‑in counters”. Acta
Polytechnica CTU Proceedings 52: 17-23. ISSN: 2336-5382. DOI:
10.14311/APP.2025.52.0017.
12. Dorton R. 2015. Network‑based
queuing model for simulating passenger throughput at an airport security
checkpoint. Master’s thesis.
Daytona Beach (FL): Embry‑Riddle Aeronautical University. 146 p.
Available at:
https://commons.erau.edu/cgi/viewcontent.cgi?article=1046&context=edt.
13. Li Y., X. Gao, Z. Xu, X. Zhou. 2018.
„Network based
queuing model for simulating passenger throughput at an airport security
checkpoint”. Journal of Air
Transport Management 66: 13-24. ISSN: 0969 6997. DOI:
10.1016/j.jairtraman.2017.09.013.
14. Koštial Kamil.
2019. Analýza vlivu
kvality služeb na spokojenost zákazníka. Bachelor thesis. Brno: Masarykova
univerzita. 66 p. [In Czech: Analysis of service quality impact on customer satisfaction].
15. Aboah K., H. Yang,
L. Zhang. 2017. „Application of the queuing
theory in characterizing and optimizing the passenger flow at the airport
security”. Journal of Air
Transport Management 62: 33-45. ISSN: 0969‑6997. DOI:
10.1016/j.jairtraman.2017.05.004.
Received 30.09.2025; accepted in revised form 24.02.2026
![]()
Scientific Journal of Silesian
University of Technology. Series Transport is licensed under a Creative
Commons Attribution 4.0 International License