4Article
citation information:
Drozhzhyn, O., Onyshchenko, S., Koskina, Y. Integrated risk assessment framework for
non-compliance with liner shipping schedules. Scientific Journal of Silesian University of Technology. Series
Transport. 2026, 130, 77-89. ISSN:
0209-3324. DOI: https://doi.org/10.20858/sjsutst.2026.130.5
Oleksii DROZHZHYN[1], Svitlana Onyshchenko[2], Yuliia KOSKINA[3]
INTEGRATED RISK
ASSESSMENT FRAMEWORK FOR
NON-COMPLIANCE WITH LINER SHIPPING SCHEDULES
Summary. The article discusses
the problem of assessing the risks of non-compliance with liner shipping
schedules, which is a key factor in the efficiency and reliability of
international trade. Given the complexity and diversity of factors affecting
schedule disruptions, ranging from port congestion and terminal productivity to
the disruptive impact of external force majeure accidents (pandemics, storms,
hurricanes, wars, etc.). The study proposes a methodology based on formal
conceptual analysis (FCA). This approach allows for a structural risk
assessment by grouping factors according to liner service ports of call,
assigning weights to them, and calculating their integrated impact on the
overall reliability of the schedule. The proposed approach is illustrated with
a numerical model that demonstrates how changes in weighting factors can affect
the final risk assessment. The results contribute to the development of
theoretical approaches to risk management in shipping, while offering practical
tools for reducing schedule disruptions in the LS-industry.
Keywords: liner shipping, shipping schedule, risk
1. INTRODUCTION
The Liner Shipping (LS) plays an important role in the development of the
global economy, ensuring stable unit-flows of goods between regions. Its
efficiency and sustainability directly affect the functioning of international
supply chains, the competitiveness of national economies, and the dynamics of
global trade. In this context, LS is of particular importance, since it is
characterized by the operation of vessels according to predetermined routes and
announced schedules. The presence of such schedules forms a key distinguishing
feature of liner services and acts as a guarantee of stability and
predictability for all participants in the logistics chain.
Nevertheless, ensuring strict compliance with schedules remains one of
the most challenging tasks of maritime transport management. Even though
schedules are planned with the consideration of numerous operational and
commercial parameters, in practice, they are subject to constant risks and
uncertainties. Deviations may be caused by a wide range of different factors:
from organizational errors and technological failures in ports and sea to
weather conditions or global crises, Any delay, regardless of its origin, disrupts the integrity of transport
processes, leads to additional costs, reduces the overall reliability of liner
transport, and ultimately disrupts the integrity of intermodal delivery.
In modern conditions, where the volume of liner trade is steadily
increasing, and the requirements for timely delivery are constantly tightening,
the problem of schedule non-compliance acquires particular urgency. For
cargo-shippers, adhering to the schedule means fulfilling contractual
obligations and maintaining supply chain stability. For LS- companies, this is
directly linked to their business reputation, competitiveness, and financial
stability. In its turn, for ports and logistics operators, the reliability of
logistics companies' schedules determines the efficiency of terminal processes,
the level of infrastructure utilization and cargo owners’ satisfaction
Traditional approaches to the analysis of disruptions in LS often focus
on identifying separate causes of delays. However, such a fractal consideration
does not let for full assessment of the
potential for deviations from the schedule. What is needed is a clear and
convenient method that integrates multiple factors, reflects their
interrelationships, and provides a quantitative assessment of the overall level
of risk. The development and application of such methodological tools is an
important step in improving the resilience of maritime transport and
strengthening its role in global intermodal delivery networks.
The aim of this study is to propose a methodology for assessing the risk
of non-compliance with liner schedules that allows for the structured analysis
of influencing factors, determination of their relative significance, and
calculation of an integral risk indicator. The presented approach is designed
to help carriers and logistics operators not only to identify critical areas of
vulnerability but also to develop effective management measures aimed at
minimizing the consequences of potential disruptions. By doing so, it
contributes to increasing the stability and efficiency of LS- operations, which
is of both theoretical and practical significance for the liner industry.
2. RELATED LITERATURE
The term “liner shipping” is inextricably linked to the concept of
“schedule”. In definitions of LS, the existence of a schedule can be presented
directly or indirectly: “fixed service,” “regular intervals,” “named ports,”
“sailing dates”. The connection between “liner shipping-schedule” is further
confirmed by the contrast between LS and tramp shipping, as “non-regular” and
“unscheduled”.
The study of risks associated with the LS-industry is a multidisciplinary
problem, and the risks of schedule non-compliance are only part of it. Thus,
D. Waters [1] identifies 21 types of risks (strategic, natural, political, economic,
physical, supply, market, transport, products, operations, financial,
information, organization, management, planning, human, technical, criminal,
safety, environment, local permits). T. Notteboom
[2] draws attention to the importance of high commercial and operational
risks associated with the deployment of fixed fleet capacity within a fixed
schedule between a set of ports of call at both ends of the trade route. The
significant impact of risks and the high probability of delays force liner
carriers to include the following remarks next to their schedules: “Above
schedule subject to change with or without prior notice”, "All information
given above is only for indicative and commercial purposes and cannot be
considered as a contractual commitment from ... line” and similar notes.
Among the main risks studied in the literature in the context of the
threat of delays and non-compliance with the liner schedule are: port
congestion [3], terminal productivity [4], seasonal fluctuations in transportation demand [5], empty container management [6], fleet and container equipment
availability [7], corruption/inefficiency of port authorities and regulatory
agencies [8], fuel prices and bunker availability [9], strikes, management, ship crew and port staff competence [10]. External risks have a significant impact on schedules: pandemics [11], military operations, extreme weather conditions, piracy, and terrorism
[12].
The most relevant issues of risk analysis and assessment in container
shipping are identified in a review [13], where the operational risks, described in the literature were examined
according to the following criteria: risk bearer/taker, analysis scale, risk
coverage, risk approach, concepts and parameters, and applied methodologies.
The most recent challenges in risk assessment in liner shipping include:
development of a risk-based resilience framework to quantify the effectiveness
of recovery strategies designed to address disruptions in liner shipping
networks [14]. The article by Elmi et al. [4] concerns the choice of a strategy for
rescheduling vessels, which can reduce deviations from the planned schedule and
reduce delays in cargo delivery. The focus of the research [15] is on factors causing schedule disruptions. As a result of the study,
the authors identified several new factors causing disruptions that had not
been sufficiently studied previously, including confirmation that port
congestion is the main cause of delays in the work of liner ships. The authors
in [16] redefine reliability as a multidimensional performance indicator that
combines punctuality, predictability and network robustness. The paper shows
that unreliable schedules lead to contractual risks spreading among ports and
logistics companies, increasing the likelihood of delay claims and penalty
clauses being invoked. It is frequently cited in studies linking operational
performance with commercial liability.
Unlike the fault management models described above, which focus either on
restoring schedules or optimizing speed, the proposed FCA-based structure
focuses on aggregating structural risks at the port level. This assessment
provides a transparent aggregation mechanism suitable for supporting management
decision-making processes.
3. EXPRESS AND REGULAR LINER
SCHEDULES
Since any liner schedule consists of information on two characteristics:
geographical and temporal, all the risks can be attributed to those that are
described as 1). geographical (strategic level), linked with the location where
the schedule failure occurred (trade region, ports of call: departure,
destination, transit ports, transshipments, etc.); 2). time-related risks
(operational level), provide an idea of the deviation from the planned
schedule, their origin may be operational management problems, as well as
information-related issues and human factors.
Shipping companies independently determine the class of the line and
establish their own class (express or regular). The Fig. 1 shows the schedule
of the container express line with clearly defined dates/times, and the fig. 2
shows an example of a regular one-way regular car-service line (served by only
car-carrier vessels).

Fig. 1. Express schedule for Trieste-Piraeus section of the ‘SLL Adriatic
Sea D’ service (Source: Maersk)
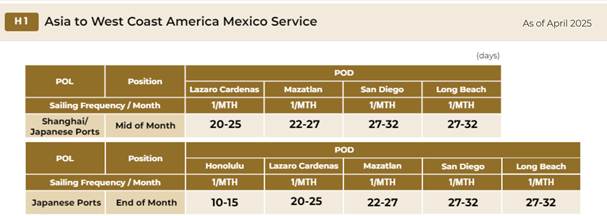
Fig. 2. Schedules for car regular service Shanghai-Long Beach and Masan -
Long Beach (Source: “K” Line)
As shown above, regular shipping lines may not specify a fixed vessel, do
not provide clear dates and times of departure/arrival from ports of
departure/destination, and have long intervals between departures.
Regular line schedules often contain the notes “call subject to
inducement”; “Indicate an inducement port call that is reliant upon sufficient
cargo volume being booked”; “Dates in italics indicate that the port call is
not yet confirmed”.
The two opposing positions regarding the content of information published
in the schedules by the shipowner are the result of differences in the nature
of the cargo base (containerized cargo and cars) and the level of competition
in the regions.
Obviously, the requirements for strictness in drawing up schedules,
control over deviations from the declared data, and the level of quality of
measures to eliminate them will vary.
Although LS is often equated with container transportation in scientific
papers, the presented schedules (Fig. 1-2) show how diverse liner markets
actually are, the difference in completeness and accuracy of the data in their
schedules, and, as a result, the expectations of cargo owners from liner
services. Thus, when assessing complex risk factors using any of the expert
assessment methods, the competence and experience of experts must be ranked in
the context of a specific LS-sector.
4. RISK assessment approach
It should be noted that these factors are not equally important.
Therefore, the significance of these factors depends on the characteristics of
the regions through which the ship's route passes and the ports of call. Even
the season of the year affects the increase or decrease in the significance of
the impact.
Risk assessment is an almost mandatory procedure for any process within
any type of activity. For example, for shipping, risk assessment in the context
of safety is mandatory, which is proposed to be carried out in accordance with
the Formal Concept Analysis (FCA-based) approach, but each company determines
the list of risk factors and their significance for assessing the safety of
ship operations.
The mentioned FCA methodology corresponds to accepted approaches to risk
assessment in any field. Thus, the probability of risk is assessed as an
integral value, which consists of the probabilities of individual groups of
risk factors and, accordingly, the probabilities of individual risk factors,
taking into account their significance. The significance of factors is assessed
either by weighting coefficients or by probabilities. The following scheme for
assessing the risk of non-compliance with the line schedule is proposed (Fig.
3).
It should be noted that this study only considers the probability of
certain events occurring that lead to schedule disruptions. Thus, the main
consequence of the occurrence of these events is the exceeding of the time
intervals specified in the line schedule. Moreover, this excess can be either
significant enough to affect the entire schedule along the entire line, or
insignificant, which can be eliminated during the further voyage of the vessel,
for example, by increasing the speed between ports. In other words, a minor
delay of the vessel in port A will not affect the vessel's arrival at port B on
time in such a situation. However, a certain amount of delay in port A cannot
be eliminated later, which will lead to the vessel's late arrival at port B.
Thus, the consequences of risk factors for schedule disruption may have varying
significance for the entire route.
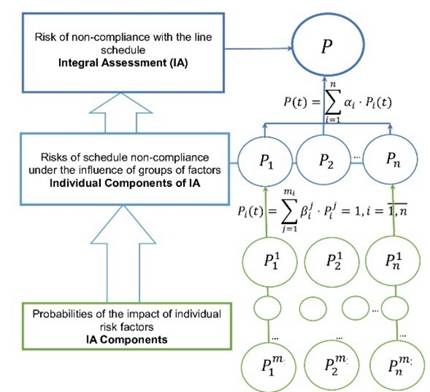
Fig. 3. Formation of risk assessment
Investigation of the consequences of events leading to schedule
disruptions is a separate task that involves examining various schedule
disruptions in terms of time for each port and for the voyage as a whole. In
this study, the main focus is on assessing reliability in terms of the schedule
for each port on the line and for the line as a whole, which is a tool for the
operator to determine where exactly the line may have a “weak spot” in this
context in order to plan and implement appropriate countermeasures or take into
account possible delays when planning the line schedule. Thus, it is the
probability of the event system that is the focus of this study.
Without loss of generality, we assume that each group of risk factors for
schedule non-compliance is characterized by the following set:
![]() , (1)
, (1)
![]() ‒ are the risk factors of the group і, and
‒ are the risk factors of the group і, and ![]() ‒ the number of factors in
the group. It should be noted that in this study, the three global groups of
risk factors discussed above are considered, but it is possible to divide the
factors into other groups, for example, separating the factors associated with
each port, which provides an opportunity for a more detailed further analysis
of each risk component.
‒ the number of factors in
the group. It should be noted that in this study, the three global groups of
risk factors discussed above are considered, but it is possible to divide the
factors into other groups, for example, separating the factors associated with
each port, which provides an opportunity for a more detailed further analysis
of each risk component.
Thus, each risk factor is associated with an assessment of the
probability of the factor's impact at time t:
![]() (2)
(2)
It should be noted that risk factors are dynamic in nature, taking into
account changes in their impact over time. Risk assessment takes place at
specific points in time, which is why in this case time is considered as a
discrete value, T – the period under consideration.
Risk assessment under the influence of factors of a certain group:
![]() , (3)
, (3)
![]() ‒ are the weighting factors
that reflect the distribution of the total influence of a group of factors
between individual influence factors. As is customary, the following condition
is applied to these coefficients:
‒ are the weighting factors
that reflect the distribution of the total influence of a group of factors
between individual influence factors. As is customary, the following condition
is applied to these coefficients:
![]() (4)
(4)
Although these coefficients are not constant values, given that the
importance of each risk factor changes over time, this time is usually longer
than the term under consideration. Therefore, we assume that these weighting
coefficients are reviewed and adjusted periodically, but not at every moment of
time ![]() , which is why
, which is why ![]() in (3) they do not depend on time.
As a rule, weighting coefficients in risk assessments are established by
experts or using appropriate methods that also rely on expert opinions (for
example, the method of pairwise comparisons, etc.).
in (3) they do not depend on time.
As a rule, weighting coefficients in risk assessments are established by
experts or using appropriate methods that also rely on expert opinions (for
example, the method of pairwise comparisons, etc.).
Another remark regarding weighting coefficients ‒ they reflect the
impact on non-fulfillment of the schedule. For
example, if we consider two factors - delays in the transition between ports
and organizational errors in positioning the ship at the berth, then the second
factor has, in our opinion, greater weight, because the ship has the opportunity
to "catch up" the time required to fulfill
the schedule at another transition at a higher speed.
Next, an assessment of the risk of schedule non-compliance (the
probability of line schedule non-compliance) is formed under the influence of
all groups of factors based on the set ![]() :
:
![]() (5)
(5)
![]() - are the weight coefficients of
risk factor groups. As for all weight coefficients, the following condition
must be met:
- are the weight coefficients of
risk factor groups. As for all weight coefficients, the following condition
must be met:
![]() . (6)
. (6)
Similar to the above considerations, these weighting coefficients are not
constant, i.e., they need to be periodically reviewed and adjusted in line with
changes in the situation, but they are not considered to be time-dependent. In
addition, these coefficients are also determined by experts.
Thus, the integral risk of schedule failure can be defined as:
![]() (7)
(7)
Therefore, (5) and (7) determine the probability of the risk of schedule
failure under the influence of multiple factors. Taking into account the
essence of the risk assessment components, the range of values of the
integrated assessment of the risk of schedule failure and its components is:
![]()
![]() (8)
(8)
![]()
A separate issue is the determination of probabilities ![]() , which, in fact, form the final risk assessment. As a rule, if the line
has existed for a certain period of time, there are statistics on delays and
the corresponding reasons for these delays, which makes it possible to
establish probabilities statistically. If these statistics are missing or
insufficient, it is necessary to rely on expert opinions.
, which, in fact, form the final risk assessment. As a rule, if the line
has existed for a certain period of time, there are statistics on delays and
the corresponding reasons for these delays, which makes it possible to
establish probabilities statistically. If these statistics are missing or
insufficient, it is necessary to rely on expert opinions.
It should be noted that the purpose of risk assessment is, first and
foremost, to monitor changes in the impact of risk factors and to identify
trends that are “critical” for schedule compliance for individual risk factors
in specific ports and specific areas of vessel traffic. This makes it possible
to implement appropriate management actions, such as organizational measures to
minimize the impact of certain risk factors, or changes to the schedule of
ships on the line if it is impossible to influence the risk factors.
Next, as is customary in any field, the use of risk assessments should be
based on determining the degree of risk according to a specific scale.
Depending on the field of application, different authors introduce different
ranges of risk assessment values for its classification. The risk scale is
determined by many factors, including the attitude of the company and managers
who make decisions regarding risk management towards risk; the specifics of the
activity and the consequences of the impact of risk factors. For some areas, a
risk of 2 % is already high (for example, when it comes to the operation
of technical equipment), while for commercial activities, a risk of 5 % in
an economic context is considered a “normal” level. Therefore, in this case,
the following scale can be used:
- ![]() :
risk is almost non-existent;
:
risk is almost non-existent;
- ![]() :
risk is moderate;
:
risk is moderate;
- ![]() :
risk is noticeable;
:
risk is noticeable;
- ![]() : risk is high.
: risk is high.
It should be noted once again that the implementation of a specific risk
classification scale depends on the attitude of the carrier's management
towards the risk of schedule violations. Therefore, the above option is one of
several possible options. For example, for a company operating in a complex,
competitive environment for a particular line, a “significant” risk may be
defined at a level of 0.03. Conversely, for some carriers, a risk of 0.1 is not
high. Thus, the company's attitude to risk, the characteristics of the
geographical segment of the line, and the characteristics of the competitive
environment justify both the list of influencing factors and their weight, as
well as the determination of the degree of risk.
To demonstrate how the proposed method works, let us consider the
following example. We accept three groups of risk factors, which are grouped by
transshipment ports and corresponding route segments (Fig. 4).
For each group, four risk factors are accepted: failure to comply with
ship handling standards at the port; delays due to bunkering; delays in ship
transit due to weather conditions; errors in ship positioning. These factors
have the same weighting coefficients for different ports, but for other
situations, these coefficients may differ.
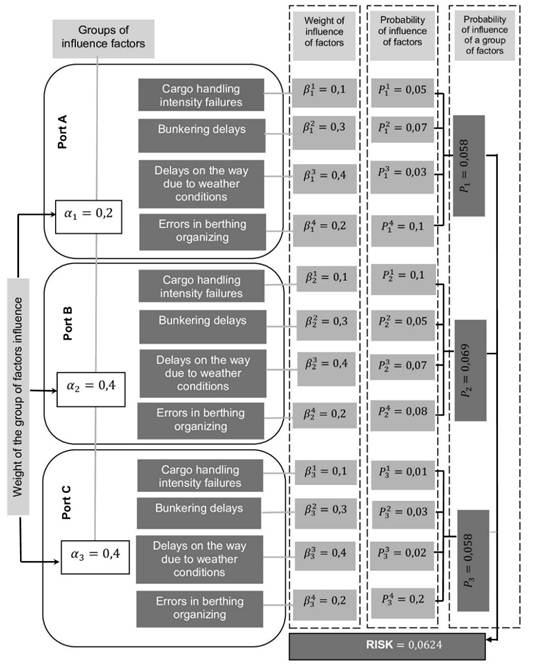
Fig. 4. Numerical example of assessing the risk of schedule failure
If, for example, in port A, errors in docking a ship usually cause
more significant delays than in port B, then for this situation, the
corresponding weighting coefficient for port A should be greater than
for port B. Thus, these weighting coefficients ![]() allow the risk to be assessed in
accordance with the actual situation. The initial data for assessing the
probability for each risk factor are also shown in Fig. 4.
allow the risk to be assessed in
accordance with the actual situation. The initial data for assessing the
probability for each risk factor are also shown in Fig. 4.
We assume that the following weighting coefficients ![]() correspond
to the groups of factors, and this distribution is accepted, taking into
account the greater importance of ports B and C in the operation
of the line.
correspond
to the groups of factors, and this distribution is accepted, taking into
account the greater importance of ports B and C in the operation
of the line.
Thus, the coefficients ![]() allow us to differentiate
between groups of factors depending on their impact on the integral risk.
Taking into account the accepted initial data for the time period under
consideration, we have the following values for the group and integral risk
assessment of schedule disruption:
allow us to differentiate
between groups of factors depending on their impact on the integral risk.
Taking into account the accepted initial data for the time period under
consideration, we have the following values for the group and integral risk
assessment of schedule disruption:
![]() ,
,![]() ,
,![]() ,
,![]() .
.
Fig. 5 shows a comparison of the probabilities of the impact of risk
factors for schedule non-compliance for each group (in this case, ports). It
can be seen that Port A is characterized by a lower level of potential
impact of risk factors compared to other ports. Port C has the highest
probability of error in organizing the berthing of a vessel, but given that the
weight of this factor is not very high ‒ ![]() , the overall risk associated with this port,
, the overall risk associated with this port, ![]() , is equal to the risk
, is equal to the risk ![]() associated with port A (Fig. 7, option 1). The total risk is
associated with port A (Fig. 7, option 1). The total risk is
![]() .
.
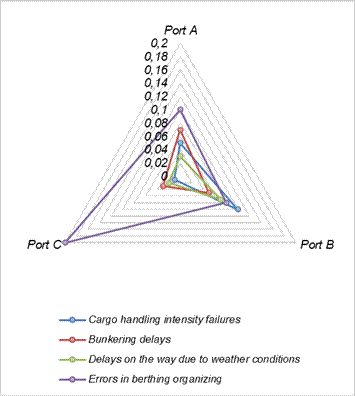
Fig. 5. Comparison of risk factor assessments for the line’s ports of
call
However, if we accept a different distribution of risk factor weights,
namely:
![]() ,
,![]() ,
,![]() ,
,![]() ,
,
i.e., the fourth risk factor in each group now has the maximum weight, we
obtain the probabilities by risk group (port) as in Fig. 6, option 2.
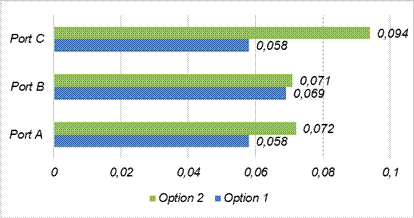
Fig. 6. Comparison of risk assessments for groups of factors (by ports of
call)
The risk (in the context of interpreting its assessment) has become
significantly higher, with the overall risk assessment now equal to ![]() .
.
Therefore, the results of the assessment of the risk of non-compliance
with the schedule, in terms of their correspondence to the actual operating
conditions of ships, undoubtedly depend on how correctly not only the risk
factors are assessed, but also their significance.
When comparing option 1 and option 2, it should be noted that for the
first situation, the overall risk is 0.06, which is slightly higher than the
“normal” or ‘moderate’ 0.05. However, for the second option, the risk is
already higher and equals more than 0.08, which is already a “significant”
risk.
Therefore, the weighting of risk factors and groups of factors should be
based on an analysis of statistical data supplemented by expert assessments.
This task was not addressed in this study, so the result is a proposed method
for assessing the risk of line schedule non-compliance and a concept for
forming risk factor groups, as demonstrated by a specific example.
4. CONCLUSION
Thus, a method for assessing the risk of non-compliance with the line
schedule is proposed, which is based on a well-known approach, the essence of
which is to take into account a set of risk factors and their probabilities, as
well as the corresponding weighting coefficients, which allow differentiating
the significance of each factor into a general integral risk assessment. Thus,
the known method is extended to solve the problem of assessing the risk of
schedule non-compliance, which enriches the theory of ship operation
management. The main risk factors for schedule non-compliance have been
identified, and relevant experimental studies on the use of the proposed method
have been conducted. The proposed model enables key decision-makers to evaluate
alternative liner routing structures, reconsider port rotation to optimize
operational strategies based on quantified risk indicators. The practical
application of this method will allow monitoring of the schedule of the line
for the timely identification of problems with schedule compliance and
appropriate response, which will increase the efficiency of ship operation
management processes on the lines and the functioning of the line service in
general. Possibilities for further expansion of the model include integration
with FMEA and FTA methods for more in-depth cause-and-effect analysis, adding
indicators of the severity of consequences, application to the design of linear
transport schedules across the entire network, and interfacing with simulation
and decision support systems.
References
1.
Waters D.
2011. Supply Chain Risk Management: Vulnerability and Resilience in
Logistics. London: Kogan Page. ISBN:
978-0-7494-4854-7.
2.
Notteboom
T. 2006. „The time factor in liner shipping services”. Maritime Economics
& Logistics 8: 19-39. DOI: https://doi.org/10.1057/palgrave.mel.9100148.
3.
Qu H., X.
Wang, L. Meng, C. Han. 2024. „Liner schedule design under port congestion: A
container handling efficiency selection mechanism”. Journal of Marine
Science and Engineering 12(6): 951. DOI: https://doi.org/10.3390/jmse12060951.
4.
Elmi Z., P. Singh, V.K. Meriga, K. Goniewicz, M. Borowska-Stefańska, S. Wiśniewski, M.A. Dulebenets. 2022.
„Uncertainties in liner shipping and ship schedule recovery: A state-of-the-art
review”. Journal of Marine Science and Engineering 10(5): 563. DOI: https://doi.org/10.3390/jmse10050563.
5.
Polat O.,
Hans-Otto G. 2016. „The impact of seasonal demand fluctuations on service
network design of container feeder lines”. Journal of Transportation and
Logistics 1(1): 39-58. DOI: https://doi.org/10.22532/jtl.237886.
6.
Karsten
C.V., B.D. Brouer, D. Pisinger. 2017. „Competitive liner shipping network
design”. Computers & Operations Research 87: 125-136. DOI: https://doi.org/10.1016/j.cor.2017.05.018.
7.
Fischer
A., H. Nokhart, H. Olsen, K. Fagerholt, J.G. Rakke, M. Stålhane. 2016.
„Robust planning and disruption management in roll-on roll-off liner shipping”.
Transportation Research Part E 91: 51-67. DOI: https://doi.org/10.1016/j.tre.2016.03.013.
8.
Zhang Y.,
Z. Sun. 2021. „The coevolutionary process of maritime management of shipping
industry in the context of the COVID-19 pandemic”. Journal of Marine Science
and Engineering 9(11): 1293. DOI: https://doi.org/10.3390/jmse9111293.
9.
Aydin N.,
H. Lee, S.A. Mansouri. 2017. „Speed optimization and bunkering in liner
shipping in the presence of uncertain service times and time windows at ports”.
European Journal of Operational Research 259(1): 143-154. DOI: https://doi.org/10.1016/j.ejor.2016.10.002.
10.
Molina
R., J.C. Villaseñor-Derbez, G. McDonald, G.R. McDermott. 2024.
„Dangerous waters: The economic toll of piracy on maritime shipping”. SSRN
Working Paper. DOI: https://doi.org/10.2139/ssrn.4811789.
11.
Notteboom
T., T. Pallis, J.-P. Rodrigue. 2021. „Disruptions and resilience in global
container shipping and ports: The COVID-19 pandemic versus the 2008-2009 financial crisis”. Maritime Economics &
Logistics 23(2): 179-210. DOI:
https://doi.org/10.1057/s41278-020-00180-5.
12.
Chang
C.-H., J. Xu, D.-P. Song. 2015. „Risk analysis for container shipping: From a logistics perspective”. The International Journal of
Logistics Management 26(1): 147-171. DOI:
https://doi.org/10.13140/RG.2.1.1717.9048.
13.
Nguyen
S., P.S.-L. Chen, Y. Du. 2022. „Container shipping operational risks: an overview of assessment and analysis”. Maritime
Policy & Management 49(2):
279-299. DOI: https://doi.org/10.1080/03088839.2021.1875142.
15.
Karmelić
J., M.J. Mihanović, A.P. Hadžić, D. Brčić. 2025. „Liner Schedule Reliability
Problem: An Empirical Analysis of Disruptions and Recovery Measures in
Container Shipping”. Logistics 9: 149. DOI: https://doi.org/10.3390/logistics9040149.
16.
Yue Z.,
J.A. Mangan. 2024. „A framework for understanding reliability in container
shipping networks”. Maritime Economics & Logistics 26: 523-544. DOI: https://doi.org/10.1057/s41278-023-00269-7.
Received 21.10.2025; accepted in revised form 15.02.2026
![]()
Scientific Journal of Silesian
University of Technology. Series Transport is licensed under a Creative
Commons Attribution 4.0 International License