Article citation information:
Aremu, O.O., Adeyemi, A., Oke, S.A., Ola, I.A. Simulation
of basic factors affecting the exhaust gas recirculation system as a means
of emission control in a spark ignition engine. Scientific Journal of Silesian University of Technology. Series Transport.
2026, 130, 5-40. ISSN: 0209-3324.
DOI: https://doi.org/10.20858/sjsutst.2026.130.1
SIMULATION OF BASIC FACTORS AFFECTING THE EXHAUST GAS RECIRCULATION
SYSTEM AS A MEANS OF EMISSION CONTROL IN A SPARK IGNITION ENGINE
Summary. In spark ignition engines, engine performance and
emission control are determined through the varying influence of exhaust gas
recirculation and its aero-dynamic properties. However, few intensive studies
are available in this domain. This paper simulates the combustion process in a
spark ignition engine, studying the effects of exhaust gas recirculation (EGR)
control mechanism on engine performance parameters and the aerodynamic
properties of the EGR value, for optimum emission control. Thermodynamic engine
models were used for the simulation of the combustion process. Cycle peak
temperature reduction was used to assess the EGR system in the emission control
of NOx. Hence, the simulation was structured to yield the volume, temperature
and pressure of the engine cylinder, every degree crank angle at varying% EGR
(say 0 to 20% of recycled exhaust gas). The effect of% EGR on indicated power,
indicated thermal efficiency, indicated mean effective pressure, cycle peak
temperature and cycle peak pressure were simulated. Aero dynamic properties of
the EGR value were simulated to examine the factors that affect the EGR value
in metering the required quantity of recycled exhaust gas into the engine
intake. The effect of temperature, velocity, pressure and area of flow of the
EGR gas through the EGR value were simulated. BASIC program was written to
generate simulated data, which were plotted with Microsoft Excel. The principal
results of this study include a reduction in the net work done by the engine
(0.393 kJ at 0% EGR to 0.353 kJ at 20% EGR) as the recycled exhaust gas
increases. Moreover, an inverse variation between the indicated power and% EGR
existed (5.895 kW at% EGR to 5.290 kW at 20% EGR). Furthermore, an inverse
variation between the cylinder peak pressure and% EGR was observed (5681 kPa at
0% EGR to 5228 kPa at 20% EGR). Overall, significant control of the emission of
NOx was achieved through the use of the EGR, system, demonstrating the
robustness of the proposed framework.
Keywords: emission,
engines, thermal efficiency, spark engine, combustion
1. INTRODUCTION
At
present, there is a huge but progressive demand from users for highly efficient
but also ecologically-sound spark ignition (SI) engines [1]. This challenge
researchers in search for advanced methods and ideas to optimize engine
performance by modifying combustion and controlling emissions from the process
[1]. One such idea is the use of exhaust gas recirculation (EGR), is capable of
improving engine efficiency, reducing NOx emissions, minimizing fuel
consumption and improving combustion [2, 3]. Moreover, EGR can provide useful
and reliable estimates of the effects of its variations on the diverse engine
parameters in a spark ignition engine. Notwithstanding the wide appeal of the
EGR concept and its crucial function in drastically reducing emissions, improving
efficiency and fuel consumption in several areas of commerce and engineering,
it has faced limited research. Extensive studies on the effects of variations
of the EGR on the key parameters of the SI engine are hardly found in the
literature.
Moreover,
the exhaust gas recirculation system is one of the several methods being used
in the emission control of exhaust gases. Exhaust Gas Recirculation (EGR)
system involves dilution of the intake charge with some quantity of exhaust gas
(say 10% or less) so as to reduce the temperature of the combustion chamber
[4]. EGR is mostly used to control the emission of oxides of nitrogen. An EGR
system requires the use of a specially built EGR valve, which opens a passage
between the exhaust and the intake manifold.
A typical EGR valve is a vacuum-operated valve, and various types of EGR
control systems include: Temperature control, Backpressure transducer, Ported
vacuum control, and electrically controlled solenoid valve. An EGR valve simply regulates and times the
recycled exhaust gas flow.
The
scope of this research was to cover only Spark Ignition (SI) engines. It has been observed that SI engines and
diesel engines largely contribute to urban pollution. Exhaust gases from SI
engine contain the following pollutants: Carbon-monoxide (CO), hydrocarbons
(HC), nitric oxides (NO), and nitrogen dioxide (NO2). NO and NO2
are collectively referred to as NOx, i.e. oxides of nitrogen. Simulation of an
emission control system using EGR requires an iterative analysis which predicts
the quantity of the recycled exhaust gas and ensures that the recycled exhaust
gas does not deteriorate the combustion process beyond certain limits.
Continuing efforts to enhance the thermal efficiency of the SI engine while
simultaneously reducing its undesirable exhaust emissions have resulted in
close attention being focused on a total understanding of the combustion
process. Therefore, simulation of some basic factors that affect the EGR system
in emission control is of great importance as it would help engine developers in
optimizing engine geometries and the EGR valve, early in the design process. In
this work, some applicable SI engine models were used, and a BASIC computer
program was written to predict the peak combustion temperature for each cycle.
The program also gives the percentage of the recycled exhaust gas to dilute the
intake charge in order to achieve a minimum NOx pollution. Aerodynamic properties of the EGR valve were
also considered.
2. LITERATURE
REVIEW
Several
studies on SI engines and the application of EGR for its emission control had
been carried out by some researchers, some of whom are referenced in this
report.
Tahtouh
et al. [5] examined the PHOENICE engine by targeting to attain lean combustion,
moderate-pressure exhaust gas recirculation, and towering compression ratio.
Two principal contributions were announced: (1) the attainment of 45% as the
peak indicated thermal efficiency and reduced brake specific fuel consumption
(by 10%).[6] studied a spark ignition engine and concluded that an accurate
performance assessment of the engine parameters was possible. Aderibigbe et al.
[1] presented a predictive artificial neural network model for engine
performance measurement with a focus on the SI engine. It was ascertained that
the most efficient architecture is the 6-13-9-6-8 network. The 28 neurons in
three hidden layers showed tremendous predictive ability in the spark ignition
engine experiment. Lee et al. [2] compared the dual and single- spark ignition
systems on the basis of the influence of ignition on the combustion scheme,
given the condition at 1600 rpm/gIMEP 0.7MPa. It was
reported that for the dual-spark ignition, the net indicated average effective
pressure to be 2.71% given the excessive air proposition of 155 condition,
which exceeded the single-spark ignition by 5%.
Paluch
et al. [3] established the influence of hydrogen when added to the air-fuel
addition that was connected to a spark-ignition engine. It was reported that on
the basis of utility and ecology, hydrogen served as an adequate fuel additive
for the traditional spark ignition engine [7]. Assad et al. [8] conducted an analysis on 16 hydrocarbon
classes emitted by a spark-ignition engine by deploying the spectroscopy
method. It was concluded that the emission of hydrocarbons when the engine was
operated via the principal avenues of vehicle operation is multiple times above
the established values for atmospheric air pollution by the European Agency for
Atmospheric Air and the World Health Organization [9].
Sforza et al. [10] analyzed
a spark ignition engine by focusing on a one-dimensional and three-dimensional
study where the engine is fed with premixed [11] theoretically examined the
properties of spark ignition engines operated within the Nigerian environment.
All performance parameters showed increases as the engine load increased.
3. THEORETICAL
MODELLING
3.1
Simulation of combustion process
The following
theoretical models were used to simulate the cylinder pressure and temperature
of an SI engine (Figure 1). The combustion process is assumed to take place
within a closed system with no loss of in-cylinder gas due to blowby gases. The
gases within the cylinder were also assumed to be ideal. It was also
assumed that there was uniform temperature in the whole mass within the
cylinder at any crank angle degree (i.e. one-zone model.)
Applying the
first law of thermodynamics to the gas within the cylinder when the inlet and
exhaust valves are closed gives the following:
![]() (1)
(1)
![]() (2)
(2)
The heat released due to the
combustion of fuel consists of Apparent Heat released and Convective Heat loss.
These are shown in equation (3) as follows:
(dQ/dq) =
(dQ/dq)app + HA(Twall
- T)/(dQ/dt) (3)
The Convective heat transfer
coefficient, H, was estimated using the Eichelberg Model [12]:
H
= 2.466 x 10⁻⁴((S)(N) /30)1/3(PT)1/2 (4)
To
change the unit of H from KW/m2 oK to
KJ/ m2 oKdeg ,
divide the above H in eqn (4) with 6N where N is in
rev/min. (i.e. (dt/dq) = 1/(6N)).
The
Blumberg Model was used for the estimation of the Apparent Heat released rate.
It is as follows:
(dQ/dq)app = (LHV)(maf)(FA) {Sin(p(q - qo )/qc )} (5)
2 (qC) (1 + FA)
The
Blumberg model assumed that the apparent heat release rate and mass burned
fraction are a trigonometric function of the crank angle [12].
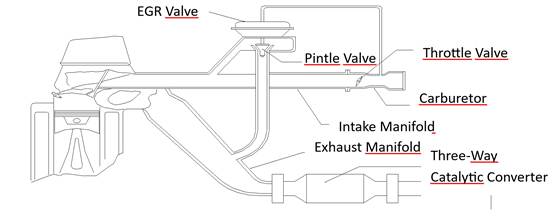
Fig.1.
Physical model of a four-stroke SI engine showing the use of
the EGR valve in emission control
The
heat transfer area, Acon, was found assuming the combustion chamber
is cylindrical in construction and is calculated as follows:
Acon
= pB{x + B/2 + 4Vc/p B2} (6)
Piston
displacement, x, which is the distance measured from the piston head to TDC, is
calculated using the crank-slider equation [13]:
x
= l + r(1 - cosq) -
Ö(l2
- r2sin2q) (7)
Instantaneous
cylinder volume, Vq,
at any degree crank angle q is
calculated as follows: (assuming that the piston head surface is flat.)
Vq = Vs/(CR - 1) + (pB2/4){l + r(1 - cosq) -
Ö(l2
- r2sin2q)} (8)
Derivative
of the cylinder volume with respect to crank angle is given by the equation (9)
(dV/dq) = (pB2/4)
r sinq{1 - r cosq/Ö(l2
- r2sin2q)} (9)
Combining equations (1), (2) and
(3) above, and assuming that specific heats are constant; then we have:
(dP/dq) = { (dQ/dq)app + HAcon(Twall
– T)(dt/dq)}{(g-1)/V } - g(P/V)
(dV/dq) (10)
The values of Convective heat
loss rate, HAcon(Twall
– T)(dt/dq),
Apparent rate of heat released, (dQ/dq)app, and Derivative of Volume, (dV/dq), are obtained from equations (3) - (9); and
are put into equation (10).
The Euler’s method was employed
for the numerical integration of equation (3.10) starting with the initial
conditions prevailing at the start of combustion (say at 340-degree crank angle
during compression stroke with inlet and outlet valves closed). The final value
of the pressure is then obtained by the reapplication of the Euler technique
with the corrected slope. The above method was used by Sorenson for the
Computer Simulation of Internal Combustion engine [12]. Numerical integration
of equation (10) in conjunction with the equation of state, over the combustion
period, gives the instantaneous temperature and pressure of the cylinder at
some predetermined degree crank angle. The results were used in plotting the
indicator diagram of the SI engine being simulated.
3.2 Simulation of intake process
Assuming
a throttled engine, (i.e. Pexh > Pint.)
In order to determine the instantaneous volume, Pressure, and temperature of
the gas in the cylinder at any crank angle degree during the intake process,
the following equations were used:
Vq = Vs/(CR - 1) + (pB2/4){l + r(1 - cosq) -
Ö(l2
- r2sin2q)} (8)
Tq = T1(Vc/Vq)(g1-1) (11)
Pq = P44(Tq/T1)g1/(g1-1) (12)
Equations
(11) and (12) above apply only to the isentropic expansion of the residual gas
for a throttled engine when the inlet valve is at closed position. It was
assumed that the inlet valve opens at a crank angle, qint, when the
residual gas has expanded isentropically to the
intake pressure Pint.
Thus,
at any other crank angle (q > qint)
during the intake stroke, Pq
takes the value of Pint. Let the instantaneous volume, Vq, and the instantaneous temperature, Tq, at crank angle
q = qint be
denoted by V22 and T22, respectively.
Let
Vaf be the fuel-air intake at any degree
crank angle during the intake process (at inlet valve open position) it follows
that Vaf
= Vq -
V22.
Let
the temperature of the mixture of fuel, air and the recycled exhaust gas be
denoted by Tintf , and assuming the same
specific heat capacity for the fuel-air mixture and the recycled exhaust gas,
then it follows that Tintf and Tq can be obtained using the following
expressions:
Tintf
= T44(%EGR)/100 + (1 - %EGR/100)Tint (13)
Tq = (T22V22 + TintfVaf)/(Vaf + V22) (14)
Pq = Pint
It
is possible to get a more accurate estimate for the temperature of the intake
charge if the specific heat capacities of the recycled exhaust gas and that of
the air-fuel mixture are taken into consideration. However, for the purpose of
this simulation, the intake temperature is fixed and does not vary with exhaust
gas temperature at the end of the exhaust stroke. This assumption is reasonable
if the recycled exhaust gas is cooled to the intake charge temperature before
diluting the intake charge.
Equations
(13) and (14) define the intake process from the time the intake valve opens to
when it closes. The temperature at the end of the intake process, or at the
beginning of the compression process is determined as follows:
T2 = (1 –
f)Tint + fT22 (15)
The residual
fraction, f, can be determined using the equation:
f
= T4Pexh/(TexhP4CR) (16)
The
mass of the in-cylinder gas just before compression begins is calculated using
equation:
Mafre = Pint Vthv/(TintR) (17)
i.e. Mafre
denotes mass of (air + fuel + residual gas + recycled exhaust gas) in the
cylinder.
Mass of the
unburned mixture in the cylinder just before compression begins is given by:
Maf = Mafre
- Me - Mr (18)
or
Maf = Mafe - Me (19)
Mr
= (Mafre)f (20)
or
Mr
= PexhVc /(TexhR) (21)
Mafe
= Mafre
- Mr (22)
Me
= (%EGR(Mafe))/100 (23)
3.3 Simulation
of compression process
Equation
(8) for calculating the instantaneous cylinder volume at any degree crank angle
was used for the compression stroke.
Tq = T2(Vt/Vq)(g1-1) (24)
Pq = Pint(Tq/T2)g1/(g1-1) (25)
Equations
(24) and (25) hold, assuming isentropic compression until combustion begins. As
mentioned earlier in this section, equation (10) is integrated in order to
determine the cylinder pressure and temperature during the combustion process.
3.4 Simulation
of the expansion process
Let
P33, V33, and T33 denote the pressure, volume,
and temperature of the cylinder at the beginning of the expansion process,
(e.g. at q = 360o)
respectively.
Equation
(8) for calculating the instantaneous cylinder volume at any degree crank angle
was also used for the expansion stroke.
Tq = T33(V33/Vq)(g2-1) (26)
Pq = P33(Tq/T33)g2/(g2-1) (27)
Equations
(26) and (27) hold for isentropic expansion until exhaust valves open.
P4 = Pressure of the in-cylinder gas at the
end of the expansion stroke.
T4 = Temperature of the in-cylinder gas at
the end of the expansion stroke.
3.5 Simulation
of exhaust stroke
Equation
(8) for calculating the Instantaneous cylinder Volume at any degree crank holds
for the exhaust stroke.
Pq = Pexh (28)
Equation
(28) applies when the exhaust valve opens to allow all gases to flow out of the
cylinder (i.e. the blowdown process).
Typically,
the pressure ratio P4/Pexh is
such that sonic flow occurs at the valve so that blowdown is very quick and the
constant volume approximation is justified [14] equation (28) is used during
the constant pressure exhaustion stroke, and work is required to expel the gas.
The
exhaust gas temperature at the end of the exhaust stroke is given by eqn. (29).
Texh = T4(Pexh/P4)(g2-1)/g2 (29)
T1 = Texh
(i.e. cylinder temperature at the beginning of the intake stroke).
V444
= Vt(P4/Pexh)1/g2 (30)
f
= Vc/V444 (31)
3.6 Estimation of the quantity of recycled exhaust gas
A
decision on the quantity of exhaust gas to be recycled is influenced by the
peak cycle temperature of the previous cycle and the operation mode of the
engine (whether decelerating or accelerating) In order to reduce NOx emission,
a required amount of the recycled exhaust gas (EGR gas) is added to the intake
charge so as to keep the peak cycle temperature to a minimum level.
Let
%EGR be the percentage of the mass of the Recycled exhaust gas (Me)
to the mass of the Intake charge (Mafe).
That is,
%EGR=
(Mass of recycled exhaust gas/mass of the intake gas) x 100% = (Me/Mafe)
x 100 (32)
But Me
can be expressed in terms of eqn. (23):
Me
= (%EGR(Mafe))/100 (23)
If
the Intake process takes a period of qint
crank angle, and for an engine speed of N rev/min; the mass flow rate of
Recycled exhaust gas, MeN, is estimated as
a function of speed N, the mass of the intake charge, Mafe, and the
mass of the fuel/air mixture, Maf.
Then
for a four stroke engine,
MeN = [(Mafe - Maf)N(qint)]/86400 (33)
If qint is assumed to
be 180o, i.e. the intake process takes a period of 180o
crank angle, then,
MeN = [(Mafe - Maf)N]/
480 (34)
Mass
of fuel-air mixture, Maf; mass of
fuel-air mixture with recycled exhaust gas, Mafe; and the total mass
of the in-cylinder gas, Mafre, are
obtained from eqns.(17)-(22).
Equation
(35) shows the relationship between Maf, Mafe,
and %EGR.
Maf = Mafe(1 - %EGR/100) (35)
Let
DTcom be
the difference between peak combustion temperature Tpk
and Tall (the permissible combustion temperature required for
optimum or minimum exhaust pollutant emission). Then,
DTcom = Tpk - Tall (36)
It
follows that when DTcom is positive;
the EGR valve opens to recycle a calculated amount of exhaust gas to cool the
combustion process to a lower temperature until the combustion temperature
reaches Tall, and then the valve closes. When DTcom is
negative, the EGR valve remains in a closed position as exhaust gas is not
needed, so as not to hinder the smooth running of the engine.
%EGR estimation model:
%EGR
= f(DTcom, Tpk, Xt) (37)
Xt, which is the
throttle position, is an indication of the load the engine is carrying, the
engine speed, and air – fuel mass flow at a particular instant of time.
3.7 Simulation of EGR valve with considerations
for its aerodynamic properties
Considering
the ‘pintle’ valve section of an EGR system, as shown in Fig. 2. It is
important to know the effect of the pintle valve on some thermodynamic
properties of the EGR gas as well as the aerodynamic properties of the valve
[15].
Let
the initial conditions of the recycled exhaust gas at the entrance of the
pintle valve be denoted by density,re1, pressure, Pe1, velocity, ue1, velocity of
sound, ce1,
Temperature, Te1,
and cross-sectional area perpendicular to flow, Ae1.
Let
us assume isentropic conditions (i.e. frictionless flow.) This satisfactorily
approximates the flow through short transitions, orifices, venturimeters
and nozzles such that friction and heat transfer exhibit insignificant
influences that may be ignored [16].
1
1
2 2
0 0
Fig.
2. EGR Valve
![]()
Applying
the Euler energy equation for horizontal, frictionless flow:
(dP/r) + udu
= 0 (38)
But
dp/dr = c2(dr/r) (39)
Substituting
eqn. (39) into eqn. (38) gives eqn. (40) i.e. Euler’s equation for steady,
frictionless flow.
c2(dr/r) + udu =
0 (40)
Applying
the continuity equation to the EGR valve gives:
r u A = constant (41)
Writing
equation (41) in differential form gives:
(dr/r)
+ (du/u) + (dA/A)
= 0 (42)
Combining
equations (40) and (42), we have:
(dA/u)
= A/u{ u2/c2 - 1} (43)
Since u/c = Ma, (Ma denotes Mach Number), then
(dA/u) = A/u{ Ma2
- 1} (44)
From
the above equation (44), it is easy to explain the possible effect of the EGR
valve on the recycled exhaust gas depending on the flow regime and the Mach
number [17].
(i) If Ma < 1 (Subsonic flow), (dA/du) is always negative, meaning that, as the
velocity increase, the cross-sectional area of the pintle valve must also
increase.
(ii) If Ma = 1
(Sonic velocity), (dA/du) = 0;
this is a case where the cross-sectional Area of the pintle valve must be a
minimum for the flow velocity to equal that of sound.
(iii) If Ma
> 1 (Supersonic flow), (dA/du)
is always positive; here for the velocity to increase, the cross-sectional area
of the pintle valve must also increase.
But
our interest for the EGR valve is the subsonic or the sonic speed.
Hence,
assuming 1-dimensional steady flow condition for the recycled exhaust gas
flowing through the pintle valve into the intake manifold. Also, assume that
the mechanical and thermodynamic characteristics of the recycled exhaust gas
are uniform across the plane normal to the axis of the flow area of the pintle
valve, then the equation for 1-dimensional steady compressible flow through an
orifice or flow restriction can be applied to the EGR valve as follows.
The
mass flow rate (kg/s) of the recycled exhaust gas, MeN,
is obtained from Equations (45)-(48).
For
subsonic flow:
MeN
= [(CdAvPe1
)/Ö(RTe1)] [2g/(g-1) {(Pe2/Pe1)2/g - (Pe2/Pe1)(g+1)/g}]1/2 (45)
(Pe2/Pe1)
> [2/(g+1)] g/(g+1) (46)
For sonic flow:
MeN = [(CdAvPe1 )/Ö(RTe1)] [{2g/(g+1)}(g+1)/(g -1)]1/2 (47)
(Pe2/Pe1)
<= [2/(g+1)] g/(g -1)
[18] (48)
Given
the recycled gas mass flow rate, MeN from
eqn. (33) and putting the same into equation (45), then for a subsonic flow,
the required area of the valve is determined by Equation (49) as follows:
Av = [MeNÖ(RTe1)]/{CdPe1[2g/(g-1)((Pe2/Pe1)2/g - (Pe2/Pe1)(g+1)/g)]1/2} (49)
Assuming
adiabatic condition for the flow for which P/rg = constant, then the downstream temperature and
velocity for maximum discharge is estimated as follows:
Tv
= Te1[2/(g+1)] (50)
Uv = (MeNRTv)/
(Cd Pe1Av) (51)
However, EGR valve design should
be for a case in which the pressure of the exhaust gas at the EGR valve outlet
is just the same as that of the air-fuel mixture from the carburetor
(approximately the atmospheric pressure) [19].
y
V
D
Fig.
3. The EGR pintle valve with the basic dimensions
Considering
Figure 3, Av is the cross-sectional area perpendicular to the
direction of flow at the critical section “V”of the
EGR valve.
The
Area Av is the surface area of an imaginary Frustum with diameter,
D, and height, y. It is calculated as follows:
Av
= py(D-y cotB/2)cosecB/2 (52)
Where
the height y is the ‘vertical’ distance (or lift) that the pintle valve must be
moved in order to introduce a calculated quantity of recycled exhaust gas into
the intake manifold. The Area, Av, of the EGR valve can be
calculated from equations (45)-(48).
Once
the area, Av, of the EGR has been determined, the valve lift, y, can
then be estimated using equation (52).
y = [pD +
Ö(p2D2 - 4pAv cosB/2)]/(2p cotB/2) (53)
where
D and B are the basic EGR valve dimensions as shown in Figure 3, and the area
Av, is the slanting surface area of an imaginary Frustum with base diameter D,
and perpendicular height, y.
Av
varies with the “vertical” lift, y, of the valve.
When y = 0, AV
= 0, (i.e. Valve at closed position).
When
y = maximum, AV = maximum, (i.e. valve at fully open position).
3.8 Simulation of indicated work, power and thermal efficiency
The
Indicated Power, IP, is defined as the actual rate of work done by the working
fluid on the piston. IP can be determined from the indicated diagram. The
Actual work done by the engine can be estimated from the integral of force on
the piston with respect to the distance moved by the piston, or integral of
pressure in the cylinder with respect to volume, provided that the variation of
average pressure in the cylinder is plotted during the machine cycle [20]. The
indicated mean effective pressure, Pimep, is
defined as the height of a rectangle on the P-V diagram having the same length
and area as the cycle. This implies that the work done, W, can be estimated
using the indicated mean effective pressure Pimep.
W
= Integral of (PdV) = PimepVs (54)
Hence,
the Indicated Power, I.P. can be estimated as follows:
I.P.
= 100PimepSApN’
where
S is the stroke in m,
Ap is the piston head area
in m2,
Pimep
is the indicated mean effective pressure in bar,
N’ is the number of revolutions per
second (it is N/2 rev/s for a four-stroke engine
and Nrev/s
for a two-stroke engine.
The
indicated mean effective pressure can also be estimated using equation (55) as
follows [14]:
Pimep = (Mf(LHV)hiCR)/(V2(CR-1)) (55)
Indicated
Thermal efficiency was calculated using eqn. (56):
hi = Wi/(Mf(LHV)) (56)
where
Wi and Mf denote indicated work
in KJ, and Mass of fuel consumed per cycle in Kg respectively.
4. SOLUTION METHODOLOGY
The
method employed in the simulation of factors affecting the EGR system as a
means of emission control is an iterative process whereby cycle temperature is modeled and controlled by the dilution of the intake
air-fuel mixture with some pre-determined quantities of recycled exhaust gas.
The
basic input variables needed for the determination of the cycle temperature
include: engine bore, piston stroke, connecting rod length, engine speed
(revolutions/minute), combustion duration, fuel heating value, cylinder wall
temperature, intake pressure, exhaust pressure, throttle position, specific
heat ratios and ambient temperature.
Thermodynamics
models were used for the simulation/estimation of the cycle temperature and
pressure of an SI engine. Some basic engine data for a spark ignition CFR
engine were used. A preset maximum allowable temperature that gives minimum
emission and optimum engine performance was assumed (say 2000K). A sub-model
gets a given%EGR and determines the peak cycle
temperature and pressure. Other engine parameters are also determined for each
cycle at a given%EGR. The graphs of the cycle
temperature and pressure, and other performance parameters such as Pimep, residual fraction, indicated thermal
efficiency, are therefore plotted against%EGR.
Relationships obtained from the graphs, such as equations or trends showing the
variation of various engine performance parameters with the%EGR
can be used in mapping out the optimum quantity of exhaust gas needed to dilute
the intake charge. Such relations are equally useful for the design of the EGR
valve control system. Upon the introduction of a predetermined quantity of
exhaust gas into the intake manifold, the fresh intake is further diluted, and
subsequent reduction of peak cycle temperature is achieved [21]. Figure 4 shows
the simulation model flow chart for the method used.
Expected
output from the models:
1.
Mass flow rate of exhaust gas through the EGR
valve (Me).
2.
Velocity of exhaust gas at the point of
recirculation (u e).
3.
Temperature of exhaust gas at the point of
recirculation (T e).
4.
EGR Pintle valve lift (y).
5.
Peak Cycle Temperature (or combustion peak
temperature) (Tpk).
6.
Peak Cycle Pressure (or combustion peak
pressure) (Ppk).
7.
Throttle position (Xt).
8.
Engine
speed (N).
9.
Indicated Thermal efficiency
(hi).
10. Volumetric efficiency
(hV).
4.1 Programming
An iterative
BASIC program was developed to use the various models / equations listed
earlier, to determine the pressure, and temperature of the cylinder at any
crank angle degree. The program was developed to calculate the indicated
effective mean pressure, work, power, efficiency, residual fraction, EGR valve
lift, and EGR velocity. The BASIC program was written in modules and
subroutines to handle various sub-models. The Compiler used was QuickBasic
Version 4.5, for the Microsoft Disk Operating System. The Output from running
the program was written by the computer directly into three output files where
the results were accessed and used to plot graphs on Microsoft Excel. The Basic
program used is excluded from the work for compactness of the report.
The
simulation model flow diagram for the sub-models is shown in Figure 5.
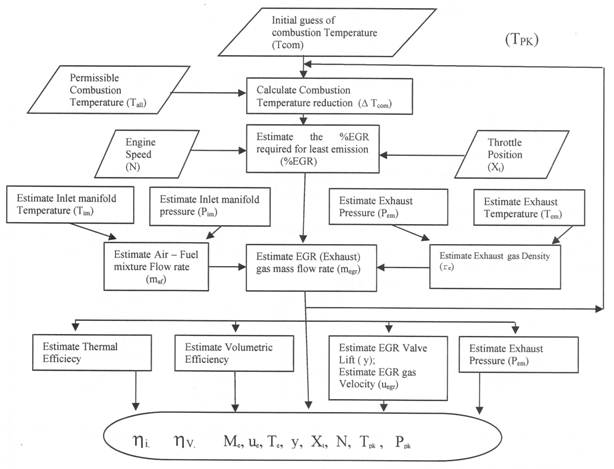
Fig. 4.
Overall model flow chart for the simulation of
basic factors affecting EGR system as a means of emission control
5. RESULTS AND DISCUSSION
Table
1 shows the engine parameters used in the simulation process for the purpose of
ensuring the accuracy, validity and replicability of the suggested
computational approach in this study.
Tab. 1
Engine parameters used for the SI engine simulation
Engine
Type: CFR Engine
Parameter: Value:
.
Bore 82.6mm
Stroke 114.3mm
Connecting
rod length 338.7mm
Speed 1800rev/min
Combustion
duration 40o
(crank angle)
Fuel
heating value 44000
kJ/kg
Cylinder
wall Temperature 450oK
Intake
Pressure 95
kPa
Intake
Temperature 330
oK
Exhaust
Pressure 105
kPa
Fuel-Air
Ratio 0.065
Compression
Ratio 7
Start
of Combustion 340o
(crank angle)
The
Outputs from the Basic program are shown in Tables 2 to 6. Table 2 shows the
volume and pressure at any degree crank angle, for a complete cycle at 0%EGR. Table
2 reflects the baseline combustion characteristics for the SI engine
investigated in a situation that the engine runs but without exhaust gases
present, to be recycled back into the cylinder. The simulated data is
fundamental in engine research to compare performance, combustion and emission
results for optimization purposes.
Tab. 2
Simulated data
on Instantaneous Volume, Pressure, and Temperature of
an SI engine at 0%, EGR
|
Crank angle (Degree) |
Temperature (K) |
Volume m3 |
Pressure kPa |
Crank angle (Degree) |
Temperature (K) |
Volume m3 |
Pressure kPa |
||
|
0 |
1295.034 |
1.02E-04 |
105 |
360 |
2876.973 |
1.02E-04 |
5681.485 |
||
|
10 |
1260.884 |
1.11E-04 |
95 |
370 |
2817.734 |
1.11E-04 |
5120.154 |
||
|
20 |
1087.007 |
1.36E-04 |
95 |
380 |
2674.907 |
1.37E-04 |
3947.537 |
||
|
30 |
911.6299 |
1.77E-04 |
95 |
390 |
2504.116 |
1.78E-04 |
2838.28 |
||
|
40 |
774.3091 |
2.32E-04 |
95 |
400 |
2341.156 |
2.33E-04 |
2027.379 |
||
|
50 |
675.9077 |
2.98E-04 |
95 |
410 |
2199.322 |
2.99E-04 |
1483.292 |
||
|
60 |
606.8663 |
3.72E-04 |
95 |
420 |
2080.473 |
3.73E-04 |
1123.552 |
||
|
70 |
558.1528 |
4.52E-04 |
95 |
430 |
1982.422 |
4.53E-04 |
882.598 |
||
|
80 |
523.2751 |
5.33E-04 |
95 |
440 |
1902.064 |
5.35E-04 |
717.6434 |
||
|
90 |
497.8994 |
6.14E-04 |
95 |
450 |
1836.457 |
6.15E-04 |
602.1256 |
||
|
100 |
479.1747 |
6.91E-04 |
95 |
460 |
1783.1 |
6.92E-04 |
519.5906 |
||
|
110 |
465.2137 |
7.62E-04 |
95 |
470 |
1739.95 |
7.63E-04 |
459.6911 |
||
|
120 |
454.7498 |
8.26E-04 |
95 |
480 |
1705.366 |
8.27E-04 |
415.787 |
||
|
130 |
446.9209 |
8.82E-04 |
95 |
490 |
1678.047 |
8.82E-04 |
383.5332 |
||
|
140 |
441.1349 |
9.28E-04 |
95 |
500 |
1656.969 |
9.28E-04 |
360.0438 |
||
|
150 |
436.9848 |
9.64E-04 |
95 |
510 |
1641.351 |
9.64E-04 |
343.3919 |
||
|
160 |
434.1956 |
9.89E-04 |
95 |
520 |
1630.613 |
9.90E-04 |
332.3054 |
||
|
170 |
432.5906 |
1.00E-03 |
95 |
530 |
1624.359 |
1.00E-03 |
325.982 |
||
|
180 |
432.0712 |
1.01E-03 |
95 |
540 |
1622.36 |
1.01E-03 |
323.9808 |
||
|
190 |
294.9453 |
1.00E-03 |
60.41652 |
550 |
1295.034 |
1.00E-03 |
105 |
||
|
200 |
296.4752 |
9.89E-04 |
61.6895 |
560 |
1295.034 |
9.89E-04 |
105 |
||
|
210 |
299.087 |
9.63E-04 |
63.90926 |
570 |
1295.034 |
9.63E-04 |
105 |
||
|
220 |
302.8846 |
9.27E-04 |
67.24313 |
580 |
1295.034 |
9.26E-04 |
105 |
||
|
230 |
308.0198 |
8.81E-04 |
71.95737 |
590 |
1295.034 |
8.80E-04 |
105 |
||
|
240 |
314.7011 |
8.25E-04 |
78.45779 |
600 |
1295.034 |
8.25E-04 |
105 |
||
|
250 |
323.2039 |
7.61E-04 |
87.35748 |
610 |
1295.034 |
7.60E-04 |
105 |
||
|
260 |
333.8859 |
6.90E-04 |
99.58968 |
620 |
1295.034 |
6.89E-04 |
105 |
||
|
270 |
347.2074 |
6.13E-04 |
116.5985 |
630 |
1295.034 |
6.12E-04 |
105 |
||
|
280 |
363.7562 |
5.32E-04 |
140.6666 |
640 |
1295.034 |
5.31E-04 |
105 |
||
|
290 |
384.2747 |
4.51E-04 |
175.4845 |
650 |
1295.034 |
4.49E-04 |
105 |
||
|
300 |
409.6716 |
3.71E-04 |
227.121 |
660 |
1295.034 |
3.70E-04 |
105 |
||
|
310 |
440.965 |
2.97E-04 |
305.5618 |
670 |
1295.034 |
2.96E-04 |
105 |
||
|
320 |
478.9999 |
2.31E-04 |
426.4941 |
680 |
1295.034 |
2.30E-04 |
105 |
||
|
330 |
523.5444 |
1.77E-04 |
610.3176 |
690 |
1295.034 |
1.76E-04 |
105 |
||
|
340 |
571.0413 |
1.36E-04 |
866.0734 |
700 |
1295.034 |
1.35E-04 |
105 |
||
|
350 |
1984.9 |
1.10E-04 |
3623.022 |
710 |
1295.034 |
1.10E-04 |
105 |
||
|
|
|
|
|
720 |
1295.034 |
1.02E-04 |
105 |
||
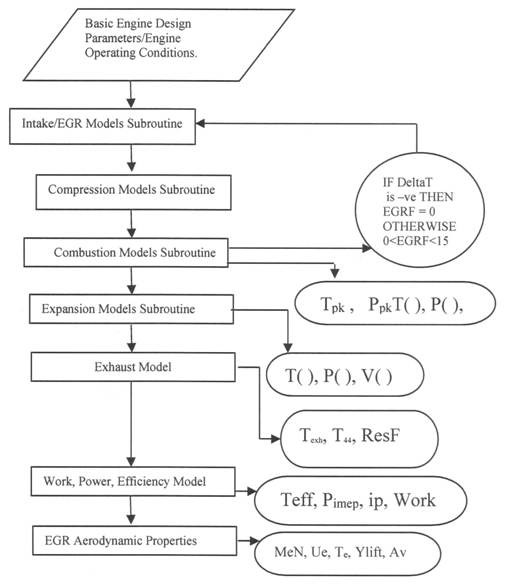
Fig. 5. Flow
chart showing basic program main modules and sub-routines for
the simulation of the effects of exhaust gas recirculation emission control
system on
SI engine performance parameters
Table
3 shows the volume and pressure at any degree crank angle, for the complete
cycles at 0%, 5%, 10%, 15% and 20% EGR. Table 3 is essential, helping the
researcher to coduct a comprehensive thermodynamic
analysis and combustion trend monitoring for the S.I. engine investigated.
Furthermore, Table 3 data serves as a critical disgnostic
tool that may assist also to gain insight of the combustion behaviour, emission
formation mechanism and performance of the engine.
Table
4 shows the volume and temperature at any degree crank angle, for complete
cycle at 0%, 5%, 10%, 15%, and 20% EGR. Table 4 reveals the characteristics of
the in-cylinder thermodynamic process and provides insights on the emission
reductions while attempting to optimize engine performance. Moreover, Table 4
is useful to gain insight into how emissions, thermodynamic performance and
combustion attributed of the engine are influenced by the EGR.
Tab. 3
Simulated data
on instantaneous volume, pressure of an SI engine, at
0%, 5%, 10%, 15%, and 20% EGR
|
Crank angle |
Volume m3 |
Pressure at 0%EGR (kPa) |
Pressure at 5%EGR (kPa) |
Pressure at 10%EGR (kPa) |
Pressure at 15%EGR (kPa) |
Pressure at 20%EGR (kPa) |
|
0 |
1.02E-04 |
105 |
105 |
105 |
105 |
105 |
|
20 |
1.36E-04 |
95 |
95 |
95 |
95 |
95 |
|
40 |
2.32E-04 |
95 |
95 |
95 |
95 |
95 |
|
60 |
3.72E-04 |
95 |
95 |
95 |
95 |
95 |
|
80 |
5.33E-04 |
95 |
95 |
95 |
95 |
95 |
|
100 |
6.91E-04 |
95 |
95 |
95 |
95 |
95 |
|
120 |
8.26E-04 |
95 |
95 |
95 |
95 |
95 |
|
140 |
9.28E-04 |
95 |
95 |
95 |
95 |
95 |
|
160 |
9.89E-04 |
95 |
95 |
95 |
95 |
95 |
|
180 |
1.01E-03 |
95 |
95 |
95 |
95 |
95 |
|
200 |
9.89E-04 |
61.6895 |
61.6895 |
61.6895 |
61.6895 |
61.6895 |
|
220 |
9.27E-04 |
67.24313 |
67.24313 |
67.24313 |
67.24313 |
67.24313 |
|
240 |
8.25E-04 |
78.45779 |
78.45779 |
78.45779 |
78.45779 |
78.45779 |
|
260 |
6.90E-04 |
99.58968 |
99.58968 |
99.58968 |
99.58968 |
99.58968 |
|
280 |
5.32E-04 |
140.6666 |
140.6666 |
140.6666 |
140.6666 |
140.6666 |
|
300 |
3.71E-04 |
227.121 |
227.121 |
227.121 |
227.121 |
227.121 |
|
320 |
2.31E-04 |
426.4941 |
426.4941 |
426.4941 |
426.4941 |
426.4941 |
|
340 |
1.36E-04 |
866.0734 |
866.0734 |
866.0734 |
866.0734 |
866.0734 |
|
350 |
1.10E-04 |
3623.022 |
3567.263 |
3513.04 |
3460.312 |
3409.035 |
|
360 |
1.02E-04 |
5681.485 |
5562.251 |
5446.967 |
5335.511 |
5227.763 |
|
380 |
1.37E-04 |
3947.537 |
3864.694 |
3784.593 |
3707.151 |
3632.288 |
|
400 |
2.33E-04 |
2027.379 |
1984.832 |
1943.694 |
1903.922 |
1865.474 |
|
420 |
3.73E-04 |
1123.552 |
1099.973 |
1077.175 |
1055.134 |
1033.826 |
|
440 |
5.35E-04 |
717.6434 |
702.5826 |
688.0208 |
673.9424 |
660.3325 |
|
460 |
6.92E-04 |
519.5906 |
508.6863 |
498.1431 |
487.9501 |
478.0962 |
|
480 |
8.27E-04 |
415.787 |
407.0612 |
398.6244 |
390.4677 |
382.5824 |
|
500 |
9.28E-04 |
360.0438 |
352.4878 |
345.1821 |
338.1189 |
331.2908 |
|
520 |
9.90E-04 |
332.3054 |
325.3315 |
318.5886 |
312.0696 |
305.7676 |
|
540 |
1.01E-03 |
323.9808 |
317.1816 |
310.6077 |
304.252 |
298.1078 |
|
560 |
9.89E-04 |
105 |
105 |
105 |
105 |
105 |
|
580 |
9.26E-04 |
105 |
105 |
105 |
105 |
105 |
|
600 |
8.25E-04 |
105 |
105 |
105 |
105 |
105 |
|
620 |
6.89E-04 |
105 |
105 |
105 |
105 |
105 |
|
640 |
5.31E-04 |
105 |
105 |
105 |
105 |
105 |
|
660 |
3.70E-04 |
105 |
105 |
105 |
105 |
105 |
|
680 |
2.30E-04 |
105 |
105 |
105 |
105 |
105 |
|
700 |
1.35E-04 |
105 |
105 |
105 |
105 |
105 |
|
720 |
1.02E-04 |
105 |
105 |
105 |
105 |
105 |
Tab. 4
Simulated data
on Instantaneous Volume and Temperature of an SI engine, at
0%, 5%, 10%, 15%, and 20%EGR
|
Crank angle (degree) |
Volume m3 |
Temperature at 0%EGR (K) |
Temperature at 5%EGR (K) |
Temperature at 10%EGR (K) |
Temperature at 15%EGR (K) |
Temperature at 20%EGR (K) |
|
0 |
1.02E-04 |
1295.034 |
1273.246 |
1252.09 |
1231.552 |
1211.615 |
|
20 |
1.36E-04 |
1087.007 |
1080.222 |
1073.268 |
1066.172 |
1058.96 |
|
40 |
2.32E-04 |
774.3091 |
793.473 |
811.0558 |
827.1611 |
841.8865 |
|
60 |
3.72E-04 |
606.8663 |
639.9252 |
670.6469 |
699.1759 |
725.6486 |
|
80 |
5.33E-04 |
523.2751 |
563.2708 |
600.5517 |
635.2828 |
667.6201 |
|
100 |
6.91E-04 |
479.1747 |
522.83 |
563.5714 |
601.5746 |
637.0057 |
|
120 |
8.26E-04 |
454.7498 |
500.432 |
543.0899 |
582.9054 |
620.0502 |
|
140 |
9.28E-04 |
441.1349 |
487.9468 |
531.6732 |
572.4988 |
610.5988 |
|
160 |
9.89E-04 |
434.1956 |
481.5834 |
525.8542 |
567.1948 |
605.7815 |
|
180 |
1.01E-03 |
432.0712 |
479.6353 |
524.0728 |
565.5709 |
604.3068 |
|
200 |
9.89E-04 |
296.4752 |
296.4752 |
296.4752 |
296.4752 |
296.4752 |
|
220 |
9.27E-04 |
302.8846 |
302.8846 |
302.8846 |
302.8846 |
302.8846 |
|
240 |
8.25E-04 |
314.7011 |
314.7011 |
314.7011 |
314.7011 |
314.7011 |
|
260 |
6.90E-04 |
333.8859 |
333.8859 |
333.8859 |
333.8859 |
333.8859 |
|
280 |
5.32E-04 |
363.7562 |
363.7562 |
363.7562 |
363.7562 |
363.7562 |
|
300 |
3.71E-04 |
409.6716 |
409.6716 |
409.6716 |
409.6716 |
409.6716 |
|
320 |
2.31E-04 |
478.9999 |
478.9999 |
478.9999 |
478.9999 |
478.9999 |
|
340 |
1.36E-04 |
571.0413 |
571.0413 |
571.0413 |
571.0413 |
571.0413 |
|
350 |
1.10E-04 |
2876.973 |
2816.596 |
2758.219 |
2701.78 |
2647.219 |
|
360 |
1.02E-04 |
2674.907 |
2618.771 |
2564.493 |
2512.019 |
2461.29 |
|
380 |
1.37E-04 |
2341.156 |
2292.024 |
2244.519 |
2198.592 |
2154.192 |
|
400 |
2.33E-04 |
2080.473 |
2036.812 |
1994.596 |
1953.783 |
1914.327 |
|
420 |
3.73E-04 |
1902.064 |
1862.147 |
1823.552 |
1786.238 |
1750.166 |
|
440 |
5.35E-04 |
1783.1 |
1745.679 |
1709.498 |
1674.518 |
1640.702 |
|
460 |
6.92E-04 |
1705.366 |
1669.577 |
1634.973 |
1601.518 |
1569.176 |
|
480 |
8.27E-04 |
1656.969 |
1622.196 |
1588.574 |
1556.068 |
1524.644 |
|
500 |
9.28E-04 |
1630.613 |
1596.392 |
1563.305 |
1531.317 |
1500.393 |
|
520 |
9.90E-04 |
1622.36 |
1588.313 |
1555.393 |
1523.567 |
1492.799 |
|
540 |
1.01E-03 |
1295.034 |
1273.246 |
1252.09 |
1231.552 |
1211.615 |
|
560 |
9.89E-04 |
1295.034 |
1273.246 |
1252.09 |
1231.552 |
1211.615 |
|
580 |
9.26E-04 |
1295.034 |
1273.246 |
1252.09 |
1231.552 |
1211.615 |
|
600 |
8.25E-04 |
1295.034 |
1273.246 |
1252.09 |
1231.552 |
1211.615 |
|
620 |
6.89E-04 |
1295.034 |
1273.246 |
1252.09 |
1231.552 |
1211.615 |
|
640 |
5.31E-04 |
1295.034 |
1273.246 |
1252.09 |
1231.552 |
1211.615 |
|
660 |
3.70E-04 |
1295.034 |
1273.246 |
1252.09 |
1231.552 |
1211.615 |
|
680 |
2.30E-04 |
1295.034 |
1273.246 |
1252.09 |
1231.552 |
1211.615 |
|
700 |
1.35E-04 |
1295.034 |
1273.246 |
1252.09 |
1231.552 |
1211.615 |
|
720 |
1.02E-04 |
1295.034 |
1273.246 |
1252.09 |
1231.552 |
1211.615 |
Tables
5 and 6 show the indicated work, thermal efficiency, indicated power, specific
heat ratio, EGR valve lift, EGR gas flow rate, air-fuel flow rate, cylinder
peak temperature, residual fraction, Work per unit mass of fuel, cylinder peak
pressure, and EGR gas downstream velocity, at 0-30% EGR. Tables 5 and 6 were
created for the purposes of assessing, optimizing and balacing
the nitrogen oxide emission reduction-performance tradeoff.
Tab. 5
Simulated data
on Indicated Work, Thermal efficiency, Power, Air-Fuel flow rate,
Cylinder Peak Temperature and Pressure, Residual fraction, Work per unit mass
of fuel,
EGR gas downstream velocity, at 0%, 5%, 10%, 15%, and 20%EGR
|
%EGR: (%) |
Work (kJ) |
Volumetric efficiency |
Thermal efficiency: (%) |
Indicated power: (kW) |
Specific heat ratio |
Y lift (mm) |
EGR mass flow rate (kg/s) |
|
0 |
0.393004 |
0.98 |
20.73407 |
5.895064 |
1.25 |
0 |
0 |
|
1 |
0.390854 |
0.98 |
20.83198 |
5.862816 |
1.247225 |
0.142063 |
2.62E-05 |
|
2 |
0.388719 |
0.98 |
20.93266 |
5.83079 |
1.244457 |
0.288362 |
5.23E-05 |
|
3 |
0.386598 |
0.98 |
21.03613 |
5.798969 |
1.241694 |
0.439303 |
7.85E-05 |
|
4 |
0.384491 |
0.98 |
21.14254 |
5.76737 |
1.238938 |
0.595363 |
1.05E-04 |
|
5 |
0.382399 |
0.98 |
21.25196 |
5.735986 |
1.236188 |
0.757107 |
1.31E-04 |
|
6 |
0.380321 |
0.98 |
21.36443 |
5.704807 |
1.233444 |
0.92521 |
1.57E-04 |
|
7 |
0.378256 |
0.98 |
21.48009 |
5.673837 |
1.230706 |
1.100494 |
1.83E-04 |
|
8 |
0.376205 |
0.98 |
21.59904 |
5.64308 |
1.227974 |
1.283975 |
2.09E-04 |
|
9 |
0.374168 |
0.98 |
21.72136 |
5.612525 |
1.225248 |
1.476932 |
2.35E-04 |
|
10 |
0.372145 |
0.98 |
21.84717 |
5.582176 |
1.222529 |
1.681015 |
2.61E-04 |
|
11 |
0.370136 |
0.98 |
21.9766 |
5.552034 |
1.219815 |
1.898418 |
2.87E-04 |
|
12 |
0.36814 |
0.98 |
22.10975 |
5.522094 |
1.217107 |
2.132164 |
3.13E-04 |
|
13 |
0.366157 |
0.98 |
22.24675 |
5.492361 |
1.214406 |
2.386631 |
3.40E-04 |
|
14 |
0.364188 |
0.98 |
22.3877 |
5.462819 |
1.21171 |
2.668583 |
3.66E-04 |
|
15 |
0.362232 |
0.98 |
22.53277 |
5.433477 |
1.20902 |
2.989534 |
3.92E-04 |
|
16 |
0.360289 |
0.98 |
22.68209 |
5.404337 |
1.206336 |
3.372348 |
4.18E-04 |
|
17 |
0.35836 |
0.98 |
22.83584 |
5.375397 |
1.203659 |
3.878516 |
4.44E-04 |
|
18 |
0.356443 |
0.98 |
22.99409 |
5.346642 |
1.200987 |
4.643327 |
4.70E-04 |
|
19 |
0.354539 |
0.98 |
23.15709 |
5.318087 |
1.198321 |
|
4.96E-04 |
|
20 |
0.352649 |
0.98 |
23.32499 |
5.289727 |
1.195661 |
|
5.22E-04 |
|
21 |
0.35077 |
0.98 |
23.49794 |
5.261554 |
1.193007 |
|
5.48E-04 |
|
22 |
0.348905 |
0.98 |
23.67616 |
5.233574 |
1.190359 |
|
5.74E-04 |
|
23 |
0.347052 |
0.98 |
23.85984 |
5.205783 |
1.187716 |
|
6.00E-04 |
|
24 |
0.345212 |
0.98 |
24.0492 |
5.178182 |
1.18508 |
|
6.26E-04 |
|
25 |
0.343385 |
0.98 |
24.24445 |
5.150767 |
1.182449 |
|
6.52E-04 |
|
26 |
0.341569 |
0.98 |
24.44583 |
5.123537 |
1.179825 |
|
6.78E-04 |
|
27 |
0.339766 |
0.98 |
24.65357 |
5.096488 |
1.177206 |
|
7.04E-04 |
|
28 |
0.337975 |
0.98 |
24.86796 |
5.06963 |
1.174593 |
|
7.30E-04 |
|
29 |
0.336196 |
0.98 |
25.08923 |
5.042946 |
1.171985 |
|
7.56E-04 |
|
30 |
0.33443 |
0.98 |
25.31771 |
5.016446 |
1.169384 |
|
7.81E-04 |
Tab. 6
Simulated data
on Indicated Work, Thermal efficiency, Power, Air-Fuel flow rate,
Cylinder Peak Temperature and Pressure, Residual fraction,
Work per unit mass of fuel, EGR gas downstream velocity, at
0%, 5%, 10%, 15%, and 20%EGR
|
%EGR: (%) |
Air/fuel flow rate (kg/s) |
Peak cycle temperature (K) |
Peak cycle pressure (kPa) |
Residual fraction |
IMEP (kPa) |
Work/Mass (kJ/kg) |
EGR gas velocity (m/s) |
|
0 |
2.47E-03 |
2876.973 |
5681.485 |
5.80E-02 |
641.3962 |
9122.991 |
0 |
|
1 |
2.45E-03 |
2864.735 |
5657.317 |
5.82E-02 |
637.8875 |
9166.073 |
3.802116 |
|
2 |
2.42E-03 |
2852.579 |
5633.311 |
0.058398 |
634.403 |
9210.372 |
3.802116 |
|
3 |
2.40E-03 |
2840.503 |
5609.462 |
5.86E-02 |
630.9408 |
9255.899 |
3.802116 |
|
4 |
2.37E-03 |
2828.508 |
5585.776 |
5.88E-02 |
627.5027 |
9302.717 |
3.802116 |
|
5 |
2.35E-03 |
2816.596 |
5562.251 |
5.90E-02 |
624.0881 |
9350.86 |
3.802116 |
|
6 |
2.32E-03 |
2804.762 |
5538.882 |
5.92E-02 |
620.6957 |
9400.351 |
3.802116 |
|
7 |
2.30E-03 |
2793.009 |
5515.67 |
5.94E-02 |
617.3262 |
9451.239 |
3.802116 |
|
8 |
2.27E-03 |
2781.334 |
5492.616 |
5.96E-02 |
613.9797 |
9503.579 |
3.802116 |
|
9 |
2.25E-03 |
2769.738 |
5469.715 |
5.98E-02 |
610.6552 |
9557.399 |
3.802116 |
|
10 |
2.22E-03 |
2758.219 |
5446.967 |
6.00E-02 |
607.3532 |
9612.756 |
3.802116 |
|
11 |
2.20E-03 |
2746.778 |
5424.374 |
6.02E-02 |
604.0737 |
9669.704 |
3.802116 |
|
12 |
2.17E-03 |
2735.414 |
5401.932 |
6.04E-02 |
600.8162 |
9728.288 |
3.802116 |
|
13 |
2.15E-03 |
2724.128 |
5379.644 |
6.06E-02 |
597.5811 |
9788.572 |
3.802116 |
|
14 |
2.12E-03 |
2712.916 |
5357.502 |
6.08E-02 |
594.3669 |
9850.589 |
3.802116 |
|
15 |
2.10E-03 |
2701.78 |
5335.511 |
6.10E-02 |
591.1745 |
9914.417 |
3.802116 |
|
16 |
2.07E-03 |
2690.719 |
5313.668 |
6.12E-02 |
588.0039 |
9980.12 |
3.802116 |
|
17 |
2.05E-03 |
2679.734 |
5291.974 |
6.14E-02 |
584.8552 |
10047.77 |
3.802116 |
|
18 |
2.02E-03 |
2668.822 |
5270.424 |
6.16E-02 |
581.7266 |
10117.4 |
3.802116 |
|
19 |
2.00E-03 |
2657.983 |
5249.02 |
6.18E-02 |
578.6198 |
10189.12 |
3.802116 |
|
20 |
1.97E-03 |
2647.219 |
5227.763 |
6.20E-02 |
575.5341 |
10262.99 |
3.802116 |
|
21 |
1.95E-03 |
2636.526 |
5206.647 |
6.22E-02 |
572.4689 |
10339.09 |
3.802116 |
|
22 |
1.92E-03 |
2625.906 |
5185.674 |
6.24E-02 |
569.4246 |
10417.51 |
3.802116 |
|
23 |
1.90E-03 |
2615.357 |
5164.843 |
6.26E-02 |
566.4008 |
10498.33 |
3.802116 |
|
24 |
1.87E-03 |
2604.881 |
5144.154 |
6.28E-02 |
563.3978 |
10581.65 |
3.802116 |
|
25 |
1.85E-03 |
2594.475 |
5123.604 |
6.30E-02 |
560.4149 |
10667.56 |
3.802116 |
|
26 |
1.82E-03 |
2584.14 |
5103.193 |
6.32E-02 |
557.4523 |
10756.17 |
3.802116 |
|
27 |
1.80E-03 |
2573.873 |
5082.919 |
6.34E-02 |
554.5093 |
10847.57 |
3.802116 |
|
28 |
1.77E-03 |
2563.678 |
5062.786 |
6.36E-02 |
551.5871 |
10941.9 |
3.802116 |
|
29 |
1.75E-03 |
2553.551 |
5042.787 |
0.063807 |
548.6838 |
11039.26 |
3.802116 |
|
30 |
1.72E-03 |
2543.493 |
5022.924 |
6.40E-02 |
545.8005 |
11139.79 |
3.802116 |
Table
7 shows data on crank angle ratio, mass burnt fraction, instantaneous heat
release rate and heat release ratio at crank angles mapped to the combustion
duration.
Tab. 6
Simulated data
on crank angle ratio, mass burnt fraction,
instantaneous heat release rate and heat release ratio at
crank angles corresponding to the combustion duration
|
Crank angle (degree) |
Crank angle ratio |
Heat
released rate (kJ/degree) |
Heat released
ratio |
|
340 |
0 |
0 |
0 |
|
342 |
0.05 |
3.71E-03 |
0.156497 |
|
344 |
0.1 |
7.32E-03 |
0.309137 |
|
346 |
0.15 |
1.08E-02 |
0.45416 |
|
348 |
0.2 |
1.39E-02 |
0.58799 |
|
350 |
0.25 |
1.68E-02 |
0.70733 |
|
352 |
0.3 |
1.92E-02 |
0.80924 |
|
354 |
0.35 |
0.021116 |
0.891208 |
|
356 |
0.4 |
2.25E-02 |
0.951213 |
|
358 |
0.45 |
2.34E-02 |
0.987777 |
|
360 |
0.5 |
2.37E-02 |
1 |
|
362 |
0.55 |
2.34E-02 |
0.98758 |
|
364 |
0.6 |
2.25E-02 |
0.950822 |
|
366 |
0.65 |
0.021102 |
0.890633 |
|
368 |
0.7 |
1.92E-02 |
0.808497 |
|
370 |
0.75 |
1.67E-02 |
0.706436 |
|
372 |
0.8 |
1.39E-02 |
0.586967 |
|
374 |
0.85 |
1.07E-02 |
0.453033 |
|
376 |
0.9 |
7.30E-03 |
0.307935 |
|
378 |
0.95 |
3.68E-03 |
0.155248 |
|
380 |
1 |
-3.00E-05 |
-1.26E-03 |
Note the
following description of the four-stroke cycle simulated:
Crank angle
0o is taken as Top Dead Centre (TDC)
Crank angle 180o is taken as Bottom Dead
Centre (BDC)
Crank angle 360o is taken as TDC
Crank angle 540o is taken as BDC
Crank angle 720o is taken as TDC
Intake Stroke:
0o
- 180o crank angle
Compression Stroke: 180o
- 360o crank angle
Expansion Stroke: 360o
- 540o crank angle
Exhaust Stroke 540o
- 720o crank angle
Combustion duration: 340o
- 380o crank angle
Figures
6 to 25 show the graphs generated from the results of the simulation. The
results are discussed as follow with emphasis on how the various engine
performance parameters vary with %EGR. Figure 6 shows the simulated P-V
indicator diagram for an S.I. engine at %EGR. Figure 7 presents the simulated
pressure vs. Crank angle indicator diagram for an S.I. engine at %EGR = 0%. In
Figure 8, the simulated temperature vs. crank angle indicator diagram for an S.I.
engine at %EGR = 0% is indicated. Figure 9 shows the simulated indicator PV
diagram for an S.I. engine for varying percentage recycled exhaust gas (%EGR).
In Figure 10, the simulated indicated pressure vs. Degree crank angle of an
S.I. engine at 0%, 5%, 10%, 15% and 20% recycled exhaust gas (%EGR) is
presented. Figure 11 shows the indicated temperatures vs. Degree crank angles
of an S.I. engine at 0%, 5%, 10%, 15% and 20% recycled exhaust gas (%EGR).
Fig.
6. Simulated P-V indicator diagram for an S.I. engine at %EGR
Fig. 7.
Simulated pressure vs. Crank angle indicator diagram for
an S.I. engine at %EGR = 0%
Fig. 8.
Simulated temperature vs. Crank angle indicator diagram for
an S.I. engine at %EGR = 0%
Fig. 9.
Simulated indicator PV diagram for an S.I. engine for
varying percentage recycled exhaust gas (%EGR)
Fig. 10.
Simulated indicated pressure Vs. Degree crank angle of
an S.I. engine at 0%, 5%, 10%, 15% and 20% recycled exhaust gas (%EGR)
Fig. 11.
Indicated temperatures Vs. Degree crank angles of
an S.I. engine at 0%, 5%, 10%, 15% and 20% recycled exhaust gas (%EGR)
5.1 Effect of
%EGR on simulated indicated work
Figure
12 shows that the indicated work varies inversely with the %EGR. This means
that there is a reduction in the net work done by the engine as the recycled
exhaust gas increases. From the result of the simulation, the indicated work
falls from 0.393kJ at 0%EGR to 0.353 kJ at 20%EGR. This explains why
application of EGR gas is a disadvantage when the engine is required to give
its maximum work output. Figure 9 shows that the indicated P-V diagram is
affected by %EGR. Here the expansion stroke curve bulges inward indicating
reduction in the area under the P-V diagram.
Fig. 12.
Simulated indicated work vs. %EGR of an S.I. engine
5.2 Effect of %EGR
on indicated power
Similar
to the effect of %EGR on Indicated work, Figure 13 shows an inverse variation
between the indicated power and %EGR. The indicated power at 0%EGR was 5.895KW,
which reduced to 5.290KW at 20%EGR.
Fig. 13.
Simulated indicated power versus %EGR of an S.I. engine
5.3 Effect of %EGR
on indicated peak pressure
Figure
14 shows an inverse variation between the cylinder peak pressure and %EGR. At 0%EGR,
(i.e. without introduction of recycled exhaust gas), the cylinder peak pressure
was determined to be 5681 kPa. At 20%EGR, the cylinder peak pressure dropped to
5228 kPa. That is a significant reduction of 453kPa. This relationship between %EGR
and cylinder peak pressure is the basis for the use of EGR as a means of
emission control. NOx concentration has been observed to reduce with
a reduction in the cylinder peak pressure [23]. Figure 10 also shows the effect
of %EGR on Cylinder Peak Pressure; on the graph of Indicated Pressure versus
degree crank angles for 0%, 5%, 10%, 15%, and 20% EGR.
Fig.
14. Simulated cylinder peak pressure vs. %EGR of an S.I. engine
5.4 Effect of %EGR
on cylinder peak temperature
Similar
to the effect of %EGR on Cylinder Peak Pressure discussed above, Figure 15
shows that the Cylinder Peak temperature varies inversely with %EGR. The
simulated results show a variation from 2877K at 0%EGR to 2647K at 20%EGR.
This means a reduction of 230K in the cylinder peak temperature was achieved by
the application of up to 20%EGR. This relationship forms the basis for the use
of the EGR system to control the emission of NOx, which varies
largely with cylinder peak temperature [24]. Figure 11 also shows the effect of
%EGR on cylinder peak temperature, on the graph of Indicated Temperature versus
degree crank angles for 0%, 5%, 10%, 15%, and 20% EGR.
Fig.
15. Simulated cylinder peak temperature vs. %EGR of an S.I. engine
5.5 Effect of%
EGR on indicated mean effective pressure
The
Indicated mean effective pressure (Pimep)
is an important engine parameter. Figure 16 shows that Pimep
is inversely proportional to %EGR. The results of the Simulation show that Pimep at 0%EGR was calculated to be 641 kPa, and
reduces to 576 kPa at 20%EGR.
Fig. 16.
Simulated mean effective pressure vs. %EGR of an S.I. engine
5.6
Effect of%EGR on indicated thermal efficiency
Figure 17 shows the correlation between %EGR and indicated thermal efficiency. It also shows that
the indicated thermal efficiency varies almost directly with the %EGR. The results in Table 5 show a slight increase in
thermal efficiency with respect to %EGR. The
thermal efficiency for 0%EGR was determined to be 20.73% while at 20%EGR the
thermal efficiency was 23.32%. This shows an increase in the indicated thermal
efficiency by 2.59% for the application of 20% EGR.
Fig. 17.
Indicated thermal eficiency vs. %EGR of an S.I.
engine
5.7
Effect of%EGR on residual fraction
Figure 18 shows that the residual fraction varies directly with the%EGR.
The simulated results show that the residual fraction varies from 0.058 at
0%EGR to 0.062 at 20%EGR. That is an increase of 0.004 residual fraction due to
the application of 20% EGR.
Fig. 18.
Residual fraction vs. %EGR of an S.I. engine
5.8 Effect of%EGR on heat
released rate
The
Blumberg model was used for the heat released rate. The model assumes that the
fuel burns according to a trigonometric relationship. Figure 19 shows the
relation between the heat released ratio and crank angle ratio for 0%EGR.
Figure 24 shows the relationship between the heat released rate and the crank
angle ratio for 0% EGR. Figure 25 shows the relationship between the heat
released rate and the crank angle ratio for 0%, 5%, 10%, 15%, and 20% EGR. It
can be easily seen from figure 24 that as the %EGR increases, the maximum value
of the heat released rate reduces [25]. This also explains the reason for the
reduction in the peak pressure and temperature.
5.9 Recycled exhaust gas (EGR) velocity
The
recycled exhaust gas velocity (EGR velocity) depends on the upstream and
downstream pressure of the EGR valve and the specific heat ratio of the
recycled exhaust gas. A coefficient of discharge of 0.95 was assumed for the
EGR valve to take care of possible losses. The result of the simulation for an
inlet temperature of 400K, upstream and downstream pressures of 105 kPa
and 95 kPa respectively, gives a subsonic velocity of 3.802m/s for the recycled
exhaust gas. The velocity is constant for a given upstream and downstream
pressure. The result is as shown in Figure 20. For a supercharged S.I. engine,
the EGR gas velocity varies with the pressure, that is, the pressure at which
the recycled exhaust gas is pumped into the valve. This is clearly shown in Figure
20.
Fig. 19. Heat released ratio vs. crank angle ratio
for an SI engine at 0%EGR
Fig. 20. EGR
gas downstream velocity Vs. %EGR for an S.I. engine
5.10 Recycled
gas mass flow rate and the EGR valve lift
The EGR mass
flow rate is a measure of the quantity of the recycled exhaust gas that flows
into the cylinder. The quantity of recycled exhaust gas (EGR) that is allowed
to dilute the intake charge can be varied with the aid of the valve lift. The
valve lift is therefore the parameter used in controlling the quantity of the
recycled exhaust gas that is allowed to dilute the air-fuel mixture. Using the
valve shown in Figure 4 as a case study, the valve lift regulates the
cross-sectional area through which the EGR gas flows within the pintle valve;
and consequently, the quantity that is allowed per unit time. Figures 21 and 22 show that the
valve lift can be used to vary the%EGR. For the particular EGR pintle valve
specification, the valve lift varies from 0-4.64mm for 0 to 18%EGR gas.
Fig. 21. EGR
valve lift vs. %EGR for an S.I. engine
Fig. 22. EGR
valve lift vs. EGR gas mass flow rate for an S.I. engine
5.11 Specific heat ratio and%EGR
The basis for
the use of EGR system for NOx emission control was already discussed
in detail under the literature review of this report. The result of our
simulation shows that the Cylinder Peak Temperature decreases with an increase
of%EGR. It was already established that the value of the specific heat ratio of
the in-cylinder charge reduces with an increase in the %EGR. This is caused by an increase in the heat capacity
of the in-cylinder gas and the retardation of ignition timing is an effect. For
the simulation, a hypothetical variation (estimated values) of the specific
heat ratio, g, for the combustion process was made from the following
exponential equation, which allows g to vary from 1.25 for 0% EGR to lower values of g as %EGR increases (Figure 23).
g = 1.25e(%EGR/-
450) (57)
Fig. 23. Estimated specific heat ratio vs. % EGR of the in-cylinder gas
during
the combustion process for and S.I. engine
Moreover, the Heat released rate Vs. crank angle ratio are shown in
Figures 24 and 25.
Fig. 24. Heat released rate vs. crank angle ratio
for an SI engine at 0%EGR
6. CONCLUSIONS
In
conclusion, it has been shown from the results of the simulation that the
effective application of EGR in emission control of SI engine should be a
compromise between some operating conditions and performance parameters such
that:
1. The effective mean pressure and indicated thermal
efficiency are not reduced below acceptable levels.
2. The combustion temperature is substantially reduced
in order to reduce NOx, while achieving condition 1 above [22].
3.
The
applied quantity of the diluent EGR gas does not affect the smooth operation of
the engine at various operating conditions.
4. While attempting to substantially reduce production
of NOx pollutants, concentrations of other pollutants like HC and CO are
equally reduced.
Fig. 25. Heat released rate vs. crank angle ratio for an SI engine at
0-20%EGR
An
important aspect of the work is to reduce NOx emissions, a required amount of
the recycled exhaust gas (EGR gas) is added to the intake charge so as to keep
the peak cycle temperature to a minimum level. This has a great influence on
the results. The determination of the EGR valve lift depends on the required
value of %EGR for optimum emission control. The EGR valve lift, of course is a
function of %EGR, Specific heat ratio of the recycled exhaust gas, g, mass flow rate of the air-fuel mixture, MafN, and the Pressure, Pe, and
Temperature, Te, of the EGR gas at the
inlet of the EGR valve. This implies that there must be an electronic control
unit which receives signals from the EGR sensing unit, MafN
sensing unit, Pe sensing unit, Te
sensing unit, and compares the same with mapped data, and finally determines
the optimum position for the EGR valve.
List of symbols:
Q Heat
transfer (kJ)
V Total
volume (m3)
m Total
mass (kg)
H Heat
transfer coefficient (kJ/m2 deg)
Qapp Apparent heat
transfer from combustion (kJ)
Twall Combustion chamber wall Temperature (oK)
A Area
(m2)
P Pressure
(kPa)
g Specific
heat ratio
LHV Lower heating value (kJ/kg)
FA Fuel
/ Air ratio (kg/kg)
AF Air
/ Fuel ratio (kg/kg)
q Crank
angle degree (degrees)
S Stroke
(m)
Sp Mean
piston speed (m/s)
T Temperature
(oK)
N Engine
speed (rev/min)
B Cylinder
bore (m)
Vc Clearance
volume (m3)
x Piston
displacement from (TDC) (m)
V444
Volume of products expanded to exhaust
pressure (m3)
Vs Swept
volume (m3)
Vt Cylinder
Total volume (m3)
P4 Pressure
at the end of expansion before valve opening (kPa)
Pe1 Pressure
of Recycled exhaust gas at the inlet of the EGR valve (kPa)
T1 Temperature
at the start of the intake stroke (oK)
Tint Temperature
of the intake charge (intake manifold temperature) (oK)
T44 Temperature
of product expanded to intake pressure (oK)
Pint Pressure
of the intake charge (intake manifold pressure) (kPa)
T4 Temperature
at the end of expansion before valve opening (oK)
Tpk Estimated
temperature of combustion process (oK)
Tall Permissible
limit of combustion temperature for optimum emission control (oK)
Xt Throttle
position
hv Volumetric
efficiency
hi Indicated
Thermal efficiency
r Density
(kg/m3)
u Velocity
(m/s)
n Specific
volume (m3/kg)
Ma Mach
number
c Local
velocity of sound in the fluid (m/s)
MafN Throttle or
Air – Fuel mixture mass flow rate (kg/s)
MeN Mass flow rate of exhaust gas through the
EGR valve (kg/s)
Mafre Mass of (air + fuel + residual gas + recycled
exhaust gas) in the cylinder (kg)
Maf Mass
of air-fuel mixture in the cylinder (kg)
Mr
Mass of residual gas in the
cylinder (kg)
Me
Mass of recycled exhaust gas in
the cylinder (kg)
Mf Mass
of fuel in the cylinder (kg)
qo Crank
angle degree at start of the combustion process (degrees)
qc Combustion
process duration in Crank angle degree (degrees)
CR Compression
ratio
r Crank
length (m)
l Connecting
rod length (m)
Vq Cylinder volume at any degree crank angle, q. (m3)
Tq
Cylinder Temperature at any degree crank
angle, q. (oK)
Pq Cylinder Pressure at any degree crank
angle, q. (kPa)
References
1.
Aderibigbe A.A., A.D. Ogunsola, E.A. Fadiji, O. Adeyi, A.J. Adeyi, E.A.
Owoo. 2025. “Performance Prediction for Spark Ignition Engines
Using Artificial Neural Networks: Model Design And Validation”. Asian
Journal of Advanced Research and Reports 19(1): 201-212. DOI: https://doi.org/10.9734/ajarr/2025/v19i1874.
2.
Lee Jeongwoo, Sanghyun
Chu, Insuk Ko, Jaegu Kang, Hyunsung Jung, Yohan Chi, Kyoungdoug
Min. 2024.“Effects Of Dual-Spark Ignition System With Two Different Piston Bowl
Shapes On Combustion And Efficiency In A Single-Cylinder Engine”. International
Journal of Engine Research 26(2). DOI: https://doi.org/10.1177/14680874241272886
3.
Paluch Maciej, Marcin Noga. 2025. “Influence Of
Hydrogen Addition On Performance And Ecological Parameters Of A Spark-Ignition
Internal Combustion Engine at Part Load Typical For Urban Traffic”. Advances
in Science and Technology Research Journal 19(3): 262-270. DOI: https://doi.org/10.12913/22998624/199738.
4.
Quader Ather A. 1971. “Why Intake Charge Dilution Decreases Nitric
Oxide Emission from Spark-Ignition Engines”. SAE Paper 710009, SAE
Transactions 80. Available at: https://www.jstor.org/stable/44731349.
5.
Tahtouh Toni, Mathieu André, Giuseppe
Castellano, Luciano Rolando, Federico Millo. 2025. “A Path Toward A New
Generation Of Sustainable Spark Ignition Engines: Experimental In
Investigations On The Synergic Use Of Dual Diluted Combustion And Renewable Fuels”.
Transportation Engineering 20(100317). DOI: https://doi.org/10.1016/j.treng.2025.100317.
6.
Agu Hillary. 2025. “Rehabilitation And Upgrade
For The Configuration Techniques Of A Spark Ignition Engine Test Bed: A Case
Study Of Caritas University Amorji Nik Emene Enugu”. Caritas
Journal of Engineering Technology 4(1): 64-75.
7.
Duan Xiongbo, Lubin Xu, Linxun
Xu, Pengfei Jiang, Tian Gan, Haibo Liu, Shaobo Ye, Zhiqiang Sun. 2023. “Performance Analysis and
Comparison of the Spark Ignition Engine Fuelled with Industrial By-Product
Hydrogen and Gasoline”. Journal of Cleaner Production 424(20). Article
138899. DOI: https://doi.org/10.1016/j.jclepro.2023.138899.
8.
Assad Mohamad, V.V. Pisarev, A.N. Oznobishin. 2025. “Polycyclic
Aromatic Hydrocarbons In Emissions Of The Internal Combustion Spark-Ignition
Engine”. Journal of Engineering Physics and Thermophysics
98: 362-372. DOI: https://doi.org/10.1007/s10891-025-03110-5.
9.
Elkelawy Medhat, E.A. El Shenawy, Hagar Alm-Eldin Bastawissi, Emad Mostafa. 2025.
“Experimental Investigation on the Effect of Using Gasoline with Commercial
Additives on Spark Ignition Engines Performance And Emissions Characteristic”. Journal
of Engineering Research 9(2). Article 8. DOI: https://doi.org/10.70259/engJER.2025.921942.
10.
Sforza Lorenzo, Federico Ramognino, Tarcisio
Cerri, Giovanni Gaetano Gianetti, Gianluca D’Errico, Angelo Onorati, Josep
Gomez-Soriano, Ricardo Novella. 2025. “A 1D-3D Numerical Study Of A Pent-Roof
Spark-Ignition Engine Fueled With Hydrogen Lean
Mixtures”. International Journal of Engine Research. DOI: https://doi.org/10.1177/14680874251355646.
11.
Aderibigbe A.A., A.D. Ogunsola, E.A. Fadiji,
E.A. Owoo, O. Adeyi, A.J. Adeyi, M.A. Olojede. 2024.
“Theoretical Analysis Of Performance Characteristics Of Non- Road Spark
Ignition Engines”. Journal of Energy Research and Reviews 16(12): 47-60.
DOI: https://doi.org/10.9734/jenrr/2024/v16i12386.
12.
Sorenson S.C. 1981. “Simple Computer Simulations
For Internal Combustion Engine Instruction”. Internal Journal of Mechnaical Engineering 9(3): 237-243.
13.
Ryder G.H. M.D. Bennett. 1975. Mechanics of
Machines. Macmillan Education Ltd., Houndmills, Basingstroke, Hants R G21 2xs.
14.
Ferguson Colin R., Allan T. Kirkpatrick. Applied
Thermosciences. 2016. John Wiley & Sons Ltd, West Sussex, PO19 8SQ,
United Kingdom.
15.
Akar Şule, Emre Arabacı. 2025. “Effects of Valve Overlap, Lift, and
Duration on Spark Ignition Engine Performance”. International Journal of
Automotive Science And Technology 9(2): 218-229. DOI: https://doi.org/10.30939/ijastech..1655212.
16.
Douglas J.M. Gasiorek, J.A. Swaffield, Lynne B.
Jack. 1985. Fluid Mechanics. 2nd Edition, Longman Scientific and
Technical, Longman Group UK Ltd, Longman House, Burnt Mill, Harlow, Essex CM20
2JE, England.
17.
Binder Raymond Charles. 1958. Advanced Fluid
Mechanics. Volume II, Prentice-Hall, Incorporated, Englewood Cliffs, N.J.
18.
Kao Minghui, John J. Moskwa. 1995. “Turbocharged
Diesel Engine Modeling for Nonlinear Engine Control
and State Estimation”. Journal of Dynamic Systems, Measurement, and Control,
Transactions of the ASME 117: 20-30. DOI: https://doi.org/10.1115/1.2798519.
19.
Champion R.C., E.C. Arnold. 1970. Motor
Vehicle Calculations and Science. Part 2. S.I. Units, Edward Arnold
Publishers, Limited 441 Bedford Square, London, WC1B 3DQ.
20.
Rogers Gordon, Yon Mayhew. 2002. Engineering
Thermodynamics Work and Heat Transfer. 4th Edition S.I. Units, English
Language Book Society and Longman.
21.
Komiyama Kunihiko, John B. Heywood. 1973.
“Predicting NOx Emissions and Effects of Exhaust Gas Recirculation in
Spark-Ignition Engines”. SAE Paper 730475, SAE Transaction 82. Available
at: https://www.jstor.org/stable/44717557.
22.
Blumberg Paul, J.T. Kummer. 1971. “Prediction of
NO formation in Spark-Ignition Engines – An Analysis of methods of control”. Combustion
Science Technology 4: 73-96. DOI: https://doi.org/10.1080/00102207108952474.
23.
Lavoie George A., John B. Heywood, James C. Keck
1970. “Experimental and Theoretical Investigation of Nitric Oxide Formation in
Internal Combustion Engines”. Combustion Science Technology 1: 313-326. DOI:
https://doi.org/10.1080/00102206908952211.
24.
Hilliard John C., Richard W. Wheeler. 1979.
“Nitrogen Dioxide in Engine Exhaust”. SAE Paper 790691, SAE Transaction
88. Available at: https://www.jstor.org/stable/44699062.
25.
Borman Gary, Kazuie
Nishiwaki. 1987. “A Review of International Combustion Engine Heat transfer”. Progress
in Energy and Combustion Science 13: 1-46. DOI: https://doi.org/10.1016/0360-1285(87)90005-0.
Received 26.09.2025; accepted in
revised form 25.02.2026
![]()
Scientific
Journal of Silesian University of Technology. Series Transport is licensed
under a Creative Commons Attribution 4.0 International License