Article
citation information:
Vu
Hai, Q., Tran Quang, T., Nguyen Anh, N., Le Hong, Q., Hoang Khai, H. Research on
the design and simulation of frontal collision assessment of a truck with
emergency vehicle suppression system. Scientific
Journal of Silesian University of Technology. Series Transport. 2025, 128, 295-309. ISSN: 0209-3324. DOI: https://doi.org/10.20858/sjsutst.2025.128.17
Quan VU HAI[1], Tam TRAN QUANG[2], Ngoc NGUYEN ANH[3], Quan LE HONG[4], Hung HOANG KHAI5
RESEARCH ON THE
DESIGN AND SIMULATION OF FRONTAL COLLISION ASSESSMENT OF A TRUCK WITH EMERGENCY
VEHICLE SUPPRESSION SYSTEM
Summary. In response to the
growing threat of vehicle-ramming attacks targeting critical infrastructure
such as airports, government facilities, and public gathering spaces, this
study focuses on the design and simulation of a direct frontal collision
between a heavy truck and an emergency vehicle barrier using the Finite Element
Method (FEM). The simulation model is developed to replicate realistic impact
conditions, allowing detailed analysis of the barrier’s structural behavior under extreme loads, including deformation
patterns, stress distribution, and energy absorption capacity. Material
properties, contact interactions, and boundary constraints are carefully
defined to enhance simulation accuracy. The results reveal that an optimally
designed barrier with reinforced structures and effective energy-dissipating
features can significantly reduce damage and vehicle intrusion, thereby
improving overall protective performance. This confirms the crucial role of
FEM-based simulation in the early design phase of physical security systems,
offering a cost-effective and predictive approach to evaluating and optimizing
barrier effectiveness before real-world deployment.
Keywords: crash simulation, emergency vehicle barrier, chevrolet
silverado, energy absorption, front-end collision,
hyper radios
1. INTRODUCTION
The
growing population, rapid urbanization, and increasing global security
instability have significantly elevated the risk of vehicle-ramming attacks –
particularly those involving trucks, which are heavy, easily accessible, and
difficult to stop. According to the Global Terrorism Database, vehicle-based
attacks accounted for over 50% of terrorism-related deaths in Western countries
in 2016 alone [1]. Additional studies, such as "Democratization of
terrorism: an analysis of vehicle-based terrorist events" [2], recorded
257 vehicle-related terrorist incidents worldwide between 1970 and 2019,
resulting in 808 deaths and 1,715 injuries – 71% of which occurred in just the
last six years of the study period. Crowded public spaces, including festivals,
sporting events, and outdoor dining areas, continue to be vulnerable targets.
In
this context, emergency vehicle barriers play a critical role in safeguarding
vital locations such as airports, government buildings, and high-profile
events. Analyzing the direct impact of collisions
between trucks and such barriers is essential for optimizing structural design,
minimizing potential damage, and enhancing the overall effectiveness of
protective systems. Advanced simulation tools, particularly those based on
Computer-Aided Engineering (CAE), offer valuable insights into the performance
of barrier systems under realistic crash conditions.
In
Vietnam, ensuring the security of critical infrastructure has become
increasingly urgent, especially amid deeper international integration and
mounting regional instability. The protection of administrative centers, military zones, and airports is not only a
national priority but also a reflection of the country’s international
credibility. High-profile visits by world leaders in 2023-2024 – including the
Presidents of the United States, Germany, and Russia – further underscore the
importance of maintaining robust and reliable security systems.
Given
the rising threat of terrorism and illegal intrusions across Southeast Asia,
research into high-performance barrier systems is both timely and essential.
Such efforts significantly contribute to national security by enabling the
design of practical, efficient, and modern defense
solutions aimed at protecting both people and critical infrastructure.
2. THEORETICAL FOUNDATIONS OF AUTOMOTIVE COLLISIONS
2.1.
Finite element method
The Finite Element Method
(FEM) is a numerical technique used to obtain approximate solutions for
physical fields within a problem domain by discretizing the space into simple
elements connected by nodes. FEM is widely applied in various fields such as structural
mechanics, heat transfer, fluid mechanics, acoustics, and many other
engineering problems.
In nonlinear dynamic analysis,
the equation of motion is derived based on the principle of virtual work and is
expressed in matrix form as follows [3]:
![]() (1)
(1)
Where:
X is the nodal position vector;
![]() is the acceleration vector;
is the acceleration vector;
[M] is the mass matrix;
[K] is the stiffness matrix;
![]() represents external forces.
represents external forces.
Nonlinearity arises from contacts, material behavior, and geometric
effects, necessitating an advanced time integration scheme to handle
strong nonlinearities.
2.2. Calculating the energy of the
collision problem
When a collision
occurs between a vehicle and an emergency barrier, the initial velocity of the
vehicle is denoted as vo
(the velocity at the onset of impact), and v is the velocity after the
collision with the obstacle. In this case, v = 0 and v0
≠ 0 (the vehicle comes to a complete stop) [4, 5]. The kinetic
energy at the moment of impact is determined by the following equation:
![]() (2)
(2)
In the case of a
perfectly plastic (inelastic) collision [6], the entire kinetic energy is
converted into deformation energy, which is calculated as:
![]() (3)
(3)
In there:
F – is
the instantaneous deformation force (N);
DX – is
the instantaneous deformation when the vehicle collides (m);
DV – is
the vehicle's deceleration (m/s);
DXmax – is the maximum
deformation of the front of the car when stopping (m);
m – is
the mass of the vehicle (kg).
The equation of
motion of the vehicle during the collision process is expressed as:
![]() (4)
(4)
3. MODEL
BUILDING
3.1.
Application of numerical simulation in collision problem analysis
This study employs HyperWorks
2020 with the Radioss solver for standardized model
analysis, ensuring consistency and accuracy. Design parameters are adjusted
across configurations to assess performance. The analysis follows a structured
workflow to ensure result reliability.
Fig. 1. Procedure for analyzing collision problems
3.2. Model
setup
The researched vehicle, the
Chevrolet Silverado, is constructed using a body-on-frame design, similar to
that of heavy-duty vehicles like trucks and SUVs, rather than the unibody
construction commonly found in passenger cars. This type of construction is
typical in trucks, off-road vehicles, and heavy-duty applications due to its
high strength, durability, and ability to withstand rough terrain and heavy
loads.
Based on the 3D model of the Chevrolet Silverado
vehicle from the CCSA open database sponsored by NHTSA, using Hypermesh software with Radioss
solver for meshing, the number of elements divided is 730068 elements with mesh
sizes from 6 mm to 10 mm [7].
|
a) |
b) |
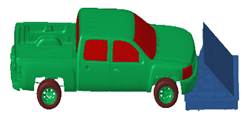
Fig. 2. Simulation
model: a) Chevrolet Silverado; b) setting up material for the model
Tab. 1
Chevrolet Silverado
vehicle specifications [7]
|
Type |
Chevrolet
Silverado version 3E |
|
Body
type |
4-door short cab pickup
truck |
|
Weight |
2,337
kg (5,152 lb) |
|
Engine
type |
4.8L
V8 |
|
Gear |
M30
4 Speed Automatic |
|
Tire
size |
P245/70R17 |
Then
create connections between the parts in the model, and create a rigid body to
create connections between the non-welded parts, and replace the missing parts.
Create materials and material properties for each part of the car.
Tab.
2
Material
specifications [8]
|
Material Parameter |
M36_PLAS_TAB (Case and chassis) |
M1_ELAST (Tire) |
M44_COWPER (Glasses) |
Unit |
|
Volumetric mass |
7.85e-09 |
7.86e-09 |
2.5e-09 |
Kg / m3 |
|
Young's modulus |
210000 |
200000 |
70000 |
MPa |
|
Poisson's ratio |
0.3 |
0.28 |
0.22 |
|
|
Yield stress |
|
|
30 |
MPa |
|
Plastic stiffness coefficient |
|
|
1000 |
MPa |
3.3. Set up interactions between components
The collision problem is a complex nonlinear problem,
with contact being one of the most important factors. Physically, contact
refers to the transfer of stress between two rigid bodies when they are in
contact. Numerically, contact is a nonlinear form due to its severe
discontinuity.
Modeling the contact between the parts is very
important to ensure accurate and realistic simulation results. We use the TYPE7
option to set up the interaction between the parts. The main advantage of the
TYPE7 interface is that the stiffness is constant and increases as the node
passes through the middle surface of the shell. This solves many problems with
poor contact (common when using TYPE3 or TYPE5 interfaces) [10].
There are three types of interactions that need to be
implemented. The first is the interaction among the finite elements of the
vehicle (Figure 3a), followed by the interaction among the finite elements of
the barrier (Figure 3b), and finally, the finite element interaction between
the vehicle and the barrier.
|
a) |
b) |
c) |

Fig. 3. Connection
setup: a) vehicle finite element connection; b) barrier finite element
connection; c) vehicle–barrier finite element connection
3.4. Set up road surface, wall and impact velocity
The
purpose of establishing interactions between the vehicle, and the road and the
wall is to avoid the occurrence of element penetration into the road or wall
during a collision. Then, the speed is assigned to all vehicle components; the
speed is selected as 40km/h based on the actual test speed when testing vehicle
collisions with walls, besides we will consider another case where the vehicle
hits the barrier at a speed of 60km/h (According to NHTSA).
Fig. 4. Infinitely
flat rigid walls after creation
4. RESULTS AND
DISCUSSION
4.1. Impact
energy
After analyzing the
conditions for collision and running the problem, we have energy lines such as
Internal Energy, Kinetic Energy, and Total Energy as shown in Figures 5 and 6.
Here we will have an energy balance to be able to evaluate the correctness of
the problem.
Fig. 5. Energy graph of the problem when the collision
occurs at a speed of 40km/h
Fig. 6. Energy graph of the problem when the collision
occurs at a speed of 60km/h
With a vehicle
mass of 1.378 tons and an initial speed of 40 km/h, the total theoretical
energy in this case is calculated as:
![]() J = 8.506
J = 8.506![]() 107 mJ (5)
107 mJ (5)
The
total energy from the simulation energy plot is 8,512.107 mJ. The result shows that the theoretical energy
and the simulation result are nearly identical, indicating that the simulation
model can be considered reliable.
With a
vehicle mass of 1.378 tons and an initial speed of 60 km/h, the total
theoretical energy in this case is:
![]() J =
J = ![]() mJ (6)
mJ (6)
The total energy from the energy plot is 1,915.108
mJ. The
close match between the theoretical calculation and simulation result again
demonstrates the reliability of the simulation model.
From the energy plots in Figure 5 and 6, it can be
seen that after the moment of impact (0.12 seconds), the total energy in the
system drops to 7,546. ![]() mJ (for 40 km/h) and 1,723.
mJ (for 40 km/h) and 1,723. ![]() mJ (for 60 km/h), corresponding
to an energy loss of approximately 11.3% and 10%, respectively. This lost
energy is not actually lost but is transformed into other forms such as
internal energy-reflecting structural deformation and interaction energy, which
represents hard-to-quantify forms like sound, heat due to friction, or
mechanical vibrations.
mJ (for 60 km/h), corresponding
to an energy loss of approximately 11.3% and 10%, respectively. This lost
energy is not actually lost but is transformed into other forms such as
internal energy-reflecting structural deformation and interaction energy, which
represents hard-to-quantify forms like sound, heat due to friction, or
mechanical vibrations.
Notably, the interaction energy in the two cases
reached 9,58. ![]() mJ (at 40 km/h) and
mJ (at 40 km/h) and
1,878. ![]() mJ (at 60 km/h), accounting for 99.17% and 97.8% of the total energy
dissipation, respectively. This indicates that most of the energy absorption
occurs in the contact and deformation zones, demonstrating the efficiency of
the emergency barrier in dissipating kinetic energy.
mJ (at 60 km/h), accounting for 99.17% and 97.8% of the total energy
dissipation, respectively. This indicates that most of the energy absorption
occurs in the contact and deformation zones, demonstrating the efficiency of
the emergency barrier in dissipating kinetic energy.
A portion of the energy loss may also be attributed
to numerical characteristics of the model, such as uneven mesh quality or
non-optimal boundary conditions. However, the close agreement between
theoretical values and simulation results confirms that the model accurately
reflects the energy transformation mechanism and can be used to predict the
safety performance of real-world damping solutions.
The energy analysis from the simulation clearly
demonstrates the system’s energy absorption and dissipation mechanisms during
collision, with the majority of the kinetic energy being converted into
internal and interaction energy-characteristic of plastic impact behavior. This forms an important foundation for assessing
the reliability of the model as well as its capability to protect passengers
and vehicles in real-world crash scenarios.
4.2. Vehicle safety
assessment during collision
Vehicle
timeline in process – Table 3.
Tab.
3
Timelines during the collision
|
|
|
At time 0
s |
|
|
|
At time 0.012 s |
|
|
|
At time
0.024 s |
|
|
|
At time
0.036 s |
|
|
|
At time
0.06 s |
|
|
|
At time
0.09 s |
|
|
|
At time
0.12 s |
When a vehicle collides with a rigid object such as
a barrier, the car’s frame structure suffers severe deformation, especially in
the front end and the area connecting the engine compartment and the passenger
cabin. A deformed front bumper can damage the engine and threaten driver safety
as the passenger compartment is intruded upon, reducing survival space.
To protect occupants, the cabin needs to be
reinforced with load-bearing beams at the doors, roof, and floor to limit
deformation during a collision. Analyzing the cabin
floor, particularly at the driver’s footrest area, helps assess intrusion
levels and propose design improvements.
According to IIHS standards [9], safety performance
is evaluated via crash simulations and the use of dummies to determine injury
severity. In numerical simulations, nodes on the vehicle floor are monitored to
measure displacement and intrusion into the passenger compartment. The results
are then compared with IIHS criteria to evaluate occupant protection and
suggest safer vehicle designs for the future.
Fig. 7. Measurement point for driver intrusion
The
research team measured the displacement of node 2039311 after the impact in two
velocity scenarios.
Fig. 8. Displacement graph of Node 2039311 along the X axis at
40 km/h
From
the displacement graph of Node 2039453 – representing the driver’s foot
location – it can be observed that from the moment of impact until
approximately 0.05 seconds, this point experienced significant continuous
deformation. The maximum displacement amplitude reached 316 mm, indicating a
strong direct impact that caused substantial movement in the vehicle floor.
After this moment, the displacement gradually decreased and stabilized around
0.12 seconds. While there was a slight recovery due to the material’s
elasticity, the deformation remained high and relatively unchanged post-impact.
According
to the Insurance Institute for Highway Safety (IIHS) [9], when floor
displacement exceeds 300 mm, the affected area is rated “Poor” – a serious
warning about the threat to the driver’s survival space. The displacement
exceeding this threshold at the footrest area indicates significant intrusion
into the cabin, potentially causing severe injuries to occupants, especially to
the legs and lower abdomen – vulnerable areas in frontal collisions.
From
these results, it can be concluded that the simulated Chevrolet vehicle
structure does not meet safety requirements for survival space in frontal
collisions with rigid objects at 40 km/h. This highlights the urgent need
to improve the design of load-bearing components at the front of the vehicle,
reinforce the cabin floor system, and optimize both the material and structural
geometry to better absorb and dissipate impact forces. Additionally, the
introduction of controlled crumple zones and reinforcements in the floor area
should be considered to reduce intrusion into the passenger cabin and enhance
occupant protection in severe crashes.
Fig. 9. Displacement graph of Node 2039311 along the X axis at
60 km/h
The
displacement graph of Node 2039311 at 60 km/h shows a peak displacement of
443.05 mm at 0.072 seconds, slightly decreasing to 427.76 mm at 0.12
seconds. Compared to the 40 km/h impact, the deformation reduces more slowly
due to the stronger force and insufficient material recovery time. The higher
impact speed leads to greater and longer-lasting deformation, causing more
severe structural damage to the vehicle.
According
to IIHS standards [9, 10, 11], a displacement exceeding 300 mm at the driver’s
foot area falls into the “red zone,” indicating a serious safety risk to the
passenger compartment. The results confirm that the vehicle fails to ensure
occupant survival space at both 40 km/h and 60 km/h, with a higher injury risk
at increased speeds.
Comparing
the two scenarios shows that increasing speed not only leads to greater
deformation but also reduces the structure’s recovery capability, emphasizing
the need for improved design to enhance safety across various collision speeds.
4.3. Barrier
Assessment
In
the crash simulation, the barrier is set in a fixed state, disallowing any
movement, to ensure that the resisting force is entirely concentrated on the
vehicle during the collision. This setup results in a sudden energy transfer
from the vehicle to the barrier, causing significant deformation to the
vehicle's frame structure and components such as the front bumper, engine
compartment, and body. Since the barrier does not move or deform significantly,
the collision energy is primarily absorbed by the vehicle.
In
reality, barriers have the capability to absorb collision energy through
deformation and displacement, which helps reduce the impact force on the
vehicle. Therefore, simulating a fixed barrier may limit the accuracy of
evaluating the energy absorption effectiveness of both sides. However, this
method simplifies the problem and provides a stable condition for collecting
data on displacement, deformation, and stress on the vehicle, even though it
does not fully reflect the actual interaction response between the vehicle and
the barrier under real-world conditions.
Tab.
4
Barrier model in two velocity cases
|
|
|
At time 0
s |
|
|
|
At time 0.024 s |
|
|
|
At time
0.12 s |
The crash simulation results show that the barrier
post experiences direct impact and significant deformation when the vehicle
crashes at a speed of 60 km/h. The strong impact force causes the post to bend
and fold right at the initial contact point; despite being reinforced, it still
undergoes considerable deformation. After the collision, the post’s cap and
base are pulled and displaced, leading to structural failure as the impact
force exceeds the load-bearing capacity of the barrier.
The post serves as the primary energy-absorbing
component of the barrier, thus undergoing the greatest deformation in the
entire system, including bending, breaking, or cracking, depending on the force
intensity and material properties. This deformation reflects the process of
converting collision energy into internal energy and the barrier’s ability to
dissipate force throughout the crash event.
Therefore, the post is the main load-bearing part
and the most severely damaged component of the barrier when the vehicle crashes
at high speed. This results in significant structural changes and
destabilization of the system's fixed points, reducing the overall protective
effectiveness of the barrier.
Fig. 10. Deformation of the strut at time 0.024 s in two cases
The greatest deformation during the collision
occurred at the connection point between the two support beams of the barrier,
where the vehicle’s impact force was directly applied. This location
concentrated the highest load, leading to significant structural deformation.
At a speed of 40 km/h, the maximum deformation at this point reached 104.2 mm,
indicating bending and shape change caused by the impact load.
When the speed increased to 60 km/h, deformation at
the same point rose noticeably to 127.5 mm. The stronger force over a
shorter period resulted in more kinetic energy being converted into internal
energy, leading to greater structural deformation.
The difference in deformation levels between the 40
km/h and 60 km/h crash scenarios clearly reflects the effect of collision speed
on the barrier’s structure. This also underscores the importance of designing
protective systems like barriers to withstand impact forces at various speed
levels. Barriers need to be optimized to absorb energy effectively without
sustaining severe damage in high-speed crash situations.
The stress distribution on the support beam is a
crucial indicator for evaluating the barrier's load-bearing capacity during a
collision. At a speed of 40 km/h, the maximum stress reaches 414.6 MPa, while
at 60 km/h, this value increases to 432.6 MPa due to the stronger impact force
and higher kinetic energy.
Although the stress remains within the material's
load-bearing limit – ensuring that the support beam does not fail immediately
and still performs its function of absorbing and dissipating energy – the
increase in stress can lead to plastic deformation or material fatigue over
time. This affects the support beam's ability to recover and its durability in
subsequent collisions, especially at higher speeds.
Fig. 11. Stress distribution of strut at time 0.024 s in two cases
Comparison between the two speed levels shows that
increased collision speed not only raises the impact stress but also
accelerates material degradation due to fatigue deformation. Therefore,
optimizing the material and design of the support beam is essential to ensure
both protective performance and long-term durability under various crash
conditions.
5. CONCLUSION
Amid the growing threat
of vehicle-based terrorist attacks targeting public areas and critical
infrastructure, the development of barrier systems capable of effective
interception and flexible deployment has become an urgent necessity. This study
developed a finite element model to simulate a frontal collision between a
heavy-duty truck and an emergency vehicle barrier system, thereby providing a
comprehensive assessment of the proposed system’s energy absorption capacity
and structural integrity.
Simulation results indicate that the proposed barrier structure is highly
effective in limiting cabin intrusion, maintaining displacement within safety
thresholds under both tested scenarios. To evaluate the level of intrusion into
the driver compartment, the research team employed the IIHS (Insurance
Institute for Highway Safety) standard. Energy analysis shows that most of the
vehicle’s kinetic energy was converted into internal and interaction energy,
confirming the system’s effective impact absorption capability and the
reliability of the simulation model. Additionally, the stress and deformation
distribution at major load-bearing areas provides a basis for structural
optimization to enhance post-impact durability.
Compared to conventional automatic bollard-type barriers, which require
fixed underground foundations and complex operating systems, the design
presented in this study demonstrates clear advantages in mobility, rapid
deployment, and adaptability to various terrain conditions. The system not only
fulfills the function of stopping unauthorized
vehicles but also improves occupant safety during impact scenarios.
In summary, this research has developed a reliable evaluation approach for
emergency barrier systems through high-fidelity numerical modeling,
integrating international safety standards and flexible structural design,
thereby offering a technically feasible solution for real-world application. In
the next phase, the authors will focus on fatigue analysis to assess the
operational lifespan of the system under repeated impact conditions, aiming to
ensure long-term performance and operational reliability.
References
1.
Bhugra D. 2017. „Violent radicalization”. International Review of Psychiatry 29. DOI: https://doi.org/10.1080/09540261.2017.1354516.
2.
Hoser R.S. „Democratization
of terrorism: an analysis of vehicle - based terrorist events”. Trauma
Surgery & Acute Care Open 7(1). DOI: https://doi.org/10.1136/tsaco-2022-000964.
3.
Liu G.R., S.S. Quek. 2003.
The
Finite Element Method: A Practical Course. Elsevier.
4.
Smith J., A. Brown. 2020. “Impact
behavior analysis of vehicle crash barriers under
dynamic loading”. International Journal of Crashworthiness 25(3):
215-227. DOI: https://doi.org/10.1080/13588265.2020.1712345.
5.
Zhang Y., L. Wang. 2021. “Energy
absorption characteristics of roadside safety barriers in vehicle impacts”. Engineering
Structures 236: 112045. DOI: https://doi.org/10.1016/j.engstruct.2021.112045.
6.
Lee K., H. Park, S. Kim. 2019. „Numerical simulation of vehicle collision with
safety barriers using finite element method”. Journal of Mechanical Science
and Technology 33(7): 3341-3350. DOI: https://doi.org/10.1007/s12206-019-0625-4.
7.
2014 Chevrolet Silverado 1500 Finite
Element Detailed Mesh Model Validation. DOI: https://doi.org/10.13021/f4yf-yd73.
8.
Brown Y.A., S. Windsor, A.P. Gaylard. 2010. “The
effect of base bleed and rear cavities on the drag of an SUV”. SAE Technical
Paper. No 2010-01-0512. DOI: https://doi.org/10.4271/2010-01-0512.
9.
IIHS. Insurance Institute for Highway Safety.
2024. Available at: https://www.iihs.org/.
10. Shao
B., D. Blass. 2020. “Case study: Implications of installing vehicle security
barriers in elevated structural slabs”. Structures Congress 2020: 11-23.
ISBN: 9780784482896. DOI: https://doi.org/10.1061/9780784482896.
Received 08.06.2025; accepted in revised form 02.08.2025
![]()
Scientific Journal of Silesian
University of Technology. Series Transport is licensed under a Creative
Commons Attribution 4.0 International License