Article
citation information:
Nguyen,
N.H.Q., Le, M.H., Dinh, T.B., Nguyen, P.K., Nguyen, T.T., Le, T.T.,
Nguyen, V.T.S., Nguyen, H.V.
A
performance-based approach to airspace optimization using wind-optimal tracks
network in Ho Chi Minh FIR. Scientific
Journal of Silesian University of Technology. Series Transport. 2025, 127, 207-222. ISSN: 0209-3324. DOI: https://doi.org/10.20858/sjsutst.2025.127.12
Ngoc Hoang Quan NGUYEN[1], Minh Hoang LE[2], Trinh Binh DINH[3],
Phuc Ky NGUYEN[4], Thu Thao NGUYEN[5], Toan Thinh LE[6], Van Tien Son NGUYEN[7], Hoang Vu NGUYEN[8]
A
PERFORMANCE-BASED APPROACH TO AIRSPACE OPTIMIZATION USING WIND-OPTIMAL TRACKS
NETWORK IN HO CHI MINH FIR
Summary. With the fast-paced
development of the aviation industry, air traffic is also increasing, leading
to the problem of how to control the traffic safely, and effectively, and
increase the capacity of airspace. Therefore, numerous approaches have been
taken to cope with this, including optimal models - an effective approach to
addressing airspace congestion issues worldwide. However, the application of
these models in Vietnam remains relatively limited. In this research, we aim to
address the issue of airspace congestion and how to enhance safety and
efficiency by developing an algorithm capable of automatically detecting and
resolving conflicts. This is achieved by adjusting the entry time and flight
level (FL) of aircraft operating within the Wind-Optimal Track Network (WOTN)
model that we have developed for the Ho Chi Minh Flight Information Region (HCM
FIR). The research contributes to the advancement of air traffic management
(ATM) systems, particularly in the context of HCM FIR, minimizing air traffic controller
(ATC) workload, and offering valuable insights for enhancing operational
efficiency and safety in the airspace.
Keywords: optimization method, Ho Chi Minh Flight information region, detect and
resolve conflicts, WOTN model, aircraft entry time, flight level
1. INTRODUCTION
The aviation industry is a highly dynamic field
worldwide, and this trend is particularly evident in Vietnam. Considering civil
aviation activities, Vietnam has experienced significant growth in the number
of flights and flight frequency. In 2023, the total air transport market
reached approximately 74 million passengers, a 34.5% increase compared to 2022
and 93.6% compared to 2019 (pre-Covid-19). Cargo transport also played a role,
with 1.1 million tons of goods transported, representing a 9.3% decrease from
2022 but still 87.3% of the 2019 level. International passenger transport
reached 32 million passengers, 1.7 times higher than in 2022 and 77% compared
to 2019. The Civil Aviation Authority of Vietnam (CAAV) and Vietnamese airlines
forecast this promising growth trend. The projected demand for air passenger
transport in 2024 is 80 million passengers, including 38.3 million domestic
passengers and 41.7 million international passengers. Evaluating the supply
capacity of Vietnamese airlines, the CAAV estimates that passenger transport
volume will reach 80.3 million passengers in 2024 (a 7.1% increase compared to
2023). Specifically, domestic passengers are expected to be 38.5 million (a
10.5% decrease from 2023), while international passengers will reach 41.8
million (a 30.6% increase from 2023) (Vietnam News, 2023). In the context of
rapid aviation growth, ensuring safety, efficiency, and cost-effectiveness
remains a priority for regulators and airlines. However, these objectives are
increasingly challenged by persistent congestion and structural bottlenecks – particularly
within the HCM FIR, one of the busiest and most complex airspaces in Southeast
Asia. Addressing these challenges requires strategies that optimize the use of
existing resources, as large-scale infrastructure expansion is often complex
and costly. Among the most promising approaches is the development of models
and algorithms to optimize airways. Numerous studies on optimizing flight
routes or flight trajectories have been conducted globally, including works by
Rosenow et al., Yan et al., Xiangyu
et al., and Nguyen et al. One of the challenges is optimizing flight tracks
based on existing factors, with the wind being a critical natural element.
After evaluating the Wind-Optimized Trajectory Network (WOTN) system applied to
the North Atlantic region, we conducted research on the applicability of the
WOTN model within HCM FIR. Our study considered wind conditions and the current
airspace structure, and yielded promising results regarding its applicability.
The ultimate goal is to explore the feasibility
of an optimization approach for airspace resource utilization, thereby reducing
congestion and workload for air traffic controllers. This research is conducted
in the context of Vietnam’s rapidly developing aviation management
capabilities. Regulatory agencies and airlines face pressure to find effective
solutions for airspace congestion, ensuring flight safety, and optimizing
operational costs. Moreover, the effective deployment of the flight track
optimization model and algorithms has the potential to draw aircraft from neighboring routes, thereby enhancing overall traffic
throughput within the HCM FIR. Developing flight path optimization models and
collision resolution algorithms will yield tangible benefits, enhancing overall
aviation performance and meeting the country's economic and social development
needs.
2.
INTRODUCTION TO HCM FIR
The
HCM FIR, formerly known as the Saigon FIR before 1975, was established at the
1959 Regional Air Navigation Meeting in Rome. Following 1975, portions of the
FIR were temporarily managed by Hong Kong, Bangkok, and Singapore, until full
control was returned to Vietnam on December 8, 1994. Covering a vast area over
Vietnam and the East Sea, and bordered by Laos and Cambodia, the HCM FIR faces
mounting challenges in managing rising air traffic volumes. In 2023, air
traffic within the region rebounded to pre-pandemic levels, with approximately
1,000 flights per day during peak periods, including 600 overflights, driven by
a 41.8% surge in passenger demand. However, infrastructure and air traffic
service (ATS) capacity have not kept pace, leading to congestion and delays,
especially during peak hours or adverse weather. The current airspace design,
characterized by overlapping routes and frequent intersections, further
exacerbates in-flight conflict risks, particularly during altitude transitions
(Figure 1). Notably, the Hanoi-Ho Chi Minh City route ranked as the fourth
busiest globally in 2024, with 10.6 million seats (OAG, 2024).
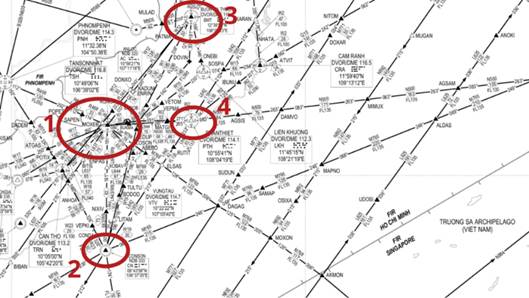
Fig. 1. Flight routes structure and
complex airway intersections in HCM FIR
The
congestion is further complicated by the FIR's complex airspace structure,
particularly at critical intersections like BMT. Military activities and
adverse weather conditions also contribute to delays, with heavy rainfall and
strong winds during the rainy season (May to December) exacerbating the
problem. Military flights at military airports such as Bien Hoa Air Base, or at
dual-use airports like Cam Ranh, may require civilian flights to alter their
routes or schedules to avoid these airport areas. This factor reduces the
optimization of airspace capacity for civilian purposes. Additionally, flight
operations must be designed to avoid restricted, prohibited, and dangerous
areas within the FIR, further complicating the challenge, described in Figure
2. Despite substantial investments in infrastructure and new technologies,
these challenges persist. As a result, finding more optimal solutions,
including the application of airspace optimization models such as the
Wind-Optimal Track Network (WOTN) in the HCM FIR, has become a top priority for
Vietnam's civil aviation sector (Figure 3).
Fig. 2. Chart of prohibited,
restricted, and dangerous areas in southern Vietnam

Fig. 3. The area for developing the WOTN model within HCM FIR
3. APPLICATION
OF WOTN MODEL IN HCM FIR
3.1. Model
construction
The
Wind-Optimal Track Network (WOTN), proposed by Imen Dhief
in 2018, represents an advanced route architecture tailored to leverage
prevailing jet streams, effectively minimizing flight time and fuel consumption
in transoceanic operations. By aligning parallel tracks with dominant wind
patterns, WOTN facilitates optimal utilization of tailwinds, resulting in more
efficient flight paths. Furthermore, the application of reduced separation
standards, made feasible through high-fidelity ADS-B surveillance, markedly
enhances airspace capacity while preserving strict safety margins. This novel
design accommodates controlled re-routing within the network, allowing traffic
to adapt more dynamically to variations in wind patterns or operational
constraints such as contingencies. Furthermore, because WOTN spans a broader
lateral corridor, it can better accommodate higher traffic volumes, alleviating
congestion around conventional oceanic waypoints. Overall, the WOTN approach
combines enhanced performance with improved flexibility, offering a sustainable
and robust solution that advances operational efficiency and cost-effectiveness
for airlines flying across oceanic airspace.
The
HCM FIR encompasses a vast expanse of oceanic airspace that is frequently
influenced by persistent monsoonal wind patterns (Nguyen et al., 2024). Given
the dynamic and seasonally varying nature of these atmospheric flows, the
implementation of the Wind-Optimal Track Network (WOTN) in this region presents
a particularly advantageous solution. The continuous presence of strong
prevailing winds over the South China Sea provides ideal conditions for
optimizing route structures in alignment with WOTN principles. By enabling the
dynamic alignment of flight tracks with dominant wind currents, the WOTN
architecture can significantly enhance fuel efficiency, reduce carbon
emissions, and increase overall operational predictability for flights
transiting this high-traffic, weather-sensitive region. Consequently, the HCM
FIR stands out as a highly suitable candidate for the application of WOTN,
supporting both the region’s growing air traffic demands and broader goals for
sustainable aviation.
To
apply the model to the HCM FIR, five evenly spaced entry points were
established along the eastern boundary of the HCM FIR, adjacent to the
Singapore FIR, specifically within sectors 4 and 5. The flight tracks extend
from the Tan Son Nhat DVOR/DME station to a point near ALDAS (Coordinates:
10° 48′ 59″ N,
112° 22′ 08″ E), with five corresponding exit
points. This configuration forms a system of five parallel westbound tracks,
each with a length of 336 nautical miles (NM). Each track comprises 13 nodes, and the lateral separation
between adjacent tracks is 20 NM. The resulting system covers an airspace of
approximately 336 × 80 NM². Nodes on the first (rightmost) flight track
are numbered sequentially from 1 to 13 in the westward direction, corresponding
to the direction of aircraft movement. Numbering continues consecutively across
the remaining tracks, forming a total of 65 nodes. This structure defines the
spatial and operational domain for model implementation (Figure 4).
Because
the parallel tracks in the system are already 20 NM apart by design, the system
assures lateral separation. The application of the 20 NM separation between
tracks is based on the communication, navigation, and surveillance requirements
for reduced oceanic separation. In terms of longitudinal separation, the system
will apply separation based on time. Based on the information provided by Imen Dhief, 2018, a 3-minute vertical separation standard is
considered reasonable. This standard is equivalent in terms of distance between
waypoints and can be applied to the new system in Vietnam, in comparison to the
30 NM separation mentioned above, provided that all aircraft comply with RNP 4.
In operation, a 3-minute separation is the time required for the fastest
commercial aircraft (Vmax = 600 kts = 10 NM/min) to fly through the
distance between the waypoints is 28 NM ≈ 30 NM. Additionally,
aircraft can be required to fly at specific Mach numbers over the ocean as part
of their clearance, so the separation between two aircraft will remain constant
if both use the same Mach number.
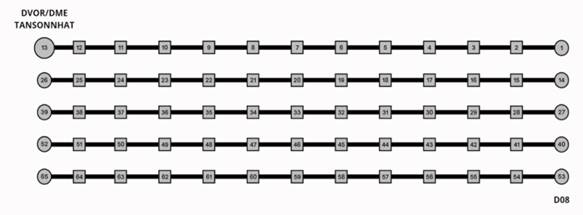
Fig. 4. Number of nodes in the
system
The
length of the route will be affected if the aircraft changes the flight track,
requiring adjustments in the separation requirements. Considering the 2D
trajectory, if the aircraft changes its flight tracks, it will require:
·
Distance:
![]() (1)
(1)
·
Angle: ![]() (2)
(2)
Fig. 5. Distance and angle when an
aircraft changes the track
The
aircraft will now need longer time to complete the remaining 4.5NM, compared to
3 minutes to fly 30NM on the same track. Considering the highest speed (![]() ), flying will
take an additional 0.4 minutes. Therefore, 3.4 minutes is the new vertical
separation standard if aircraft change their flight tracks.
), flying will
take an additional 0.4 minutes. Therefore, 3.4 minutes is the new vertical
separation standard if aircraft change their flight tracks.
As
all flight levels in RVSM airspace are available to aircraft operating from
east to west, each aircraft will comply with the vertical separation standard
by performing a vertical separation of one flight level at a distance of 1000
feet. To ensure a performance difference when the aircraft climbs to a flight
level, an additional 0.2 minutes will be added to the vertical separation of
3.2 minutes of flight time when an aircraft changes its flight level with other
aircraft on the same track (Imen Dhief, 2018).
3.2.
Comparison between the new model and existing airways in HCM FIR
To
conduct the comparison, flight route N500 was selected due to its alignment
with the direction of the proposed system. This route, when traversed from west
to east, terminates at the TSH waypoint—consistent with the construction
reference point of the system—and exhibits a flight direction closely matching
that of the intended track. Flight time data for the N500 route, specifically
between the PANDI and TSH waypoints, is analyzed
using records obtained from the FlightAware database. The study encompasses
aircraft types A20N, A320, A321, A330, and B737, with the corresponding results
summarized in Table 1.
Tab.
1
Total flight time and average speed of
different aircraft types on
the PANDI to TSH segment
|
Type of aircraft |
Speed (knots) |
Flight time (minutes) |
|
A20N |
484 |
57.5 |
|
A320 |
472.06 |
60.24 |
|
A321 |
490 |
56 |
|
A330 |
482.67 |
57.33 |
|
B737 |
474 |
59 |
·
Total
average flight time of the aircraft:

·
Average
velocity from PANDI point to TSH point:
![]()
The
next step in the comparison is to calculate the flight times within our system.
Since the system does not begin at the same point, PANDI, as the N500 flight
path, we calculate the time from when the aircraft enters the HCM FIR at PANDI,
until it enters the system, and continues until it reaches the end of the
system. The assumed flight path is depicted in Figure 6.
To
calculate the distance between two geographical coordinates based on known latitude
and longitude values, the Haversine formula is applied:

Including:
·
![]() : Distance between 2 points;
: Distance between 2 points;
·
![]() : The radius of the earth;
: The radius of the earth;
·
![]() : Latitude of 2 points;
: Latitude of 2 points;
·
![]() : Longitude of 2 points.
: Longitude of 2 points.
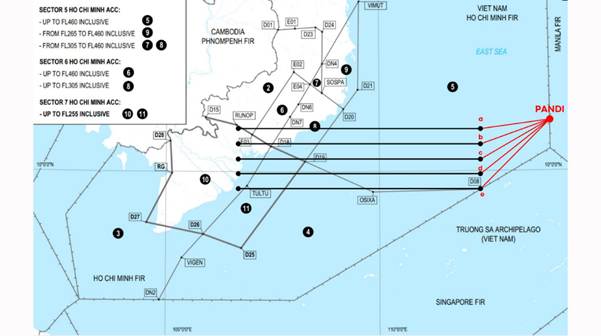
Fig. 6. Flight paths
from entering HCM FIR to entering the system
Based
on the above formula, we have the distance from point PANDI
(11°38′06″N, 114°00′00″E) to waypoint 1 in the system
(10°48′59″N, 112°22′08″E) - that is, the starting point
at the line (a) in figure 9 is 190.1 km and the distance from point PANDI
(11°38′06″N, 114°00′00″E) to waypoint 53
(09°33'53"N, 112°22′08″E) - that is, the starting point at
line (e) in figure 9 is 290.3 km.
We
have the shortest distance that the aircraft travels in the system is:
![]()
With
the aircraft being able to change its flight path up to 4 times in the system,
we can depict the longest distance an aircraft travels in the system in Figure
7.
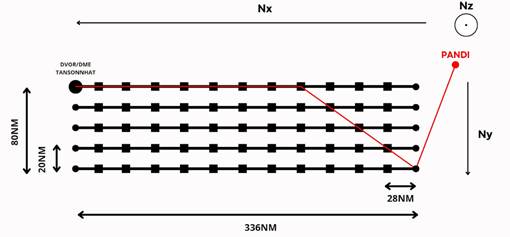
Fig. 7. The longest
distance an aircraft travels in the system
With
the two shortest and longest distances, combined with the average survey speed
of the aircraft, we have the total average flight time of the shortest and
longest in the system, respectively:
![]()
![]()
Based
on the calculated results, the average time for an aircraft to travel through
the system after entering the HCMFIR ranges between 54.78 minutes and 64.8
minutes. Compared to the average time on the N500 route, as surveyed earlier is
56.014 minutes. This indicates that the time of the proposed system can be
about 2 minutes less to possibly more than 8 minutes. While this difference may
not significantly impact flight time or fuel consumption, the system offers
more routing options for aircraft, helping to accommodate future increases in
air traffic. This, in turn, can bring economic benefits by enabling more
aircraft to use Vietnam’s airspace, thereby increasing revenue from ATS fees.
4. DETECTING
AND RESOLVING CONFLICTS ALGORITHM
When
introducing a new airway structure, it is essential to thoroughly evaluate its
potential for generating airspace conflicts during operation. Conflict
detection and prevention are critical to maintaining the safety and efficiency
of air traffic, especially in complex or high-density regions. Existing methods
for assessing conflict risk include geometric trajectory intersection analysis
(Xuesong et al., 2025), temporal separation models
(Roja Ezzati Amini et al., 2022), probabilistic conflict risk estimation (Jaime
de la Mota et al., 2021), and optimization-based approaches (Shafi Imran,
2023). Each of these techniques offers unique strengths in identifying
potential conflicts between aircraft. However, algorithm-based models have
shown superior performance due to their adaptability and ability to process
large-scale traffic scenarios. In this context, we propose an integrated model
that combines the Simulated Annealing (Rui Chibante,
2010) and Sliding Window algorithms (Vladimir Braverman, 2016). This hybrid approach
leverages the global search capability of SA and the real-time adaptability of
the SW technique to enhance both the detection and mitigation of conflicts. The
proposed model is designed to support strategic planning and operational
validation of the new airway system, ensuring safer and more efficient route
structures.
An
algorithm has been developed in the WOTN model to detect conflicts that may
occur at waypoints or links. At each node, conflict is detected between two
successive flights if the time gap between two flights passing a node is
smaller than the longitudinal separation (![]() ).
). ![]() equals 2 minutes for aircraft on the same
track, and 3 minutes for aircraft changing tracks. Conflict at links is
detected between two consecutive flights by comparing the sequence-in and
sequence-out at a link (an aircraft is considered to be in a link when it
enters the FIR node of a link and out when it enters the second node of a
link). If the sequence is switched between two flights, which means the
aircraft enters the link first and gets out second, the other aircraft enters
the link second and gets out first. Additionally, flight level constraints are
incorporated. Two flights are considered to be in conflict when they occupy the
same flight level and the required longitudinal separation is violated. To
resolve such conflicts, priority is given to adjusting the assigned flight
level by increasing it by 1000 feet. If the conflict persists, the flight level
is then decreased by 1000 feet. Should the conflict remain unresolved after
these adjustments, the entry time is subsequently modified.
equals 2 minutes for aircraft on the same
track, and 3 minutes for aircraft changing tracks. Conflict at links is
detected between two consecutive flights by comparing the sequence-in and
sequence-out at a link (an aircraft is considered to be in a link when it
enters the FIR node of a link and out when it enters the second node of a
link). If the sequence is switched between two flights, which means the
aircraft enters the link first and gets out second, the other aircraft enters
the link second and gets out first. Additionally, flight level constraints are
incorporated. Two flights are considered to be in conflict when they occupy the
same flight level and the required longitudinal separation is violated. To
resolve such conflicts, priority is given to adjusting the assigned flight
level by increasing it by 1000 feet. If the conflict persists, the flight level
is then decreased by 1000 feet. Should the conflict remain unresolved after
these adjustments, the entry time is subsequently modified.
4.1. Objective
function
With
the strategies of how to detect conflicts we have mentioned above, we resolve
conflict between two consecutive flights ![]() and
and ![]() . The
objective function for adjusting the entry time of the flight
. The
objective function for adjusting the entry time of the flight ![]() is:
is:
![]()
In
addition, we developed a new objective function for adjusting the assigned
flight level of the flight ![]() :
:
![]()
4.2. Flow
chart
The
algorithm begins by filtering the input flight data through each node in
chronological order. Based on the resulting sequence and timing, it identifies
potential conflicts by evaluating both flight levels and temporal conditions. A
conflict is considered to occur when two flights share the same flight level
and longitudinal separation requirements are violated. Conflict resolution is
initiated by adjusting the flight levels. If this adjustment fails to resolve
the conflict, temporal modifications are applied as a secondary strategy. Prior
to resolution, accurate conflict detection is essential. In addition to the
previously defined symbols x, y, and z, the algorithm also employs the
following notations:
·
a:
Distance of the straight path segment in the filter section;
·
b:
Distance of the diagonal path segment in the filter section;
·
c:
Distance of the straight path segment in the parallel section;
·
S:
Distance traveled by the flight when considering the conflict node;
·
V: Speed
of the aircraft;
·
![]() : Node j that the aircraft passes through;
: Node j that the aircraft passes through;
·
![]() : Node j+1 that the aircraft passes through;
: Node j+1 that the aircraft passes through;
·
![]() : Time the flight
: Time the flight ![]() passes through the
node;
passes through the
node;
·
![]() : Time the flight
: Time the flight ![]() passes through the
node;
passes through the
node;
·
![]() : Flight level of the flight
: Flight level of the flight ![]() ;
;
·
![]() : Flight level of the flight
: Flight level of the flight ![]() .
.
Next, the algorithm resolves conflicts based on flight levels as follows.
If
adjusting flight levels (Figure 9) fails to resolve a conflict, the algorithm
switches to timing adjustments, addressing time-based conflicts at nodes and links. Flowcharts in Figures
10 and 11 outline the time-based resolution for nodes and links, respectively. The algorithms
(Figures 8-11) are implemented in Python 3.
Fig. 8. Overall
process flow chart
4.3. Results
and Analysis
To
assess the system's conflict detection and resolution performance, a dataset of
500 real-time flights was analyzed, with LONsep values tested at 3, 4, 5, 6, and 7
minutes to evaluate their effects on conflict frequency and resolution
approaches. Table 2 summarizes the findings, detailing total conflict flights,
node and link conflicts, and resolution methods: increasing or decreasing
flight level (FL) and time adjustments.
The
data in Table 2 reveals several key trends. First, the model successfully
detected all conflicts across all LONsep
values, demonstrating its robustness in identifying potential conflicts in
real-time air traffic scenarios. As LONsep
increases from 3 to 7 minutes, the total number of conflict flights rises
consistently, from 98 at 3 minutes to 138 at 7 minutes. This increase suggests
that larger time separations between aircraft, while intended to enhance
safety, may inadvertently lead to more frequent conflict scenarios,
particularly at nodes. Specifically, conflicts at nodes rise from 50 at LONsep of 3 minutes to 110 at 7 minutes,
indicating that longer separation times may cause bottlenecks at critical
airspace intersections, where aircraft trajectories converge.
Tab.
2
Number of conflicts by type and resolution
method
|
value |
Total conflict flights |
Total conflict flights at nodes |
Total conflict flights at links |
Total conflict flights solved
by adjusting flight level |
Total conflict flights solved
by adjusting time |
|
|
Increasing flight level |
Decreasing flight level |
|||||
|
3 mins |
98 |
50 |
48 |
24 |
1 |
24 |
|
4 mins |
108 |
64 |
44 |
30 |
2 |
22 |
|
5 mins |
130 |
88 |
42 |
31 |
1 |
49 |
|
6 mins |
133 |
100 |
33 |
36 |
1 |
48 |
|
7 mins |
138 |
110 |
28 |
38 |
2 |
44 |

Fig. 9. Flowchart
for resolving conflicts by flight level
Fig. 10. Flowchart for resolving
conflicts at nodes by time
Fig. 11. Flowchart for resolving
conflicts at links by time
Conversely,
conflicts at links—representing interactions between aircraft along their
flight paths – exhibit a different trend. While the number of conflicts at
links increases modestly from 48 to 52 as LONsep
rises from 3 to 6 minutes, a notable decrease to 28 is observed at LONsep of 7 minutes. This reduction
suggests that a larger time separation effectively mitigates overtaking
scenarios along flight paths, as aircraft are spaced further apart temporally.
The inverse relationship between conflicts at nodes and links highlights a
trade-off: while increasing LONsep
reduces link conflicts by providing greater temporal buffers, it exacerbates
node conflicts due to the clustering of aircraft at airspace junctions.
The
resolution strategies employed further illuminate the system’s adaptability.
Across all LONsep values, the
majority of conflicts are resolved by adjusting flight levels, either by
increasing or decreasing them. For instance, at LONsep
of 3 minutes, 24 conflicts are resolved by increasing flight level, and only 1
by decreasing it, while 24 are addressed through time adjustments. As LONsep increases to 7 minutes, the
reliance on flight level adjustments remains dominant, with 38 conflicts
resolved by increasing flight level and 2 by decreasing it, alongside 44
resolved through time adjustments. This distribution indicates that flight
level adjustments are the preferred method for conflict resolution, likely due
to their immediate applicability in maintaining safe separation without
significantly altering flight schedules. However, the increasing use of time
adjustments at higher LONsep values
(e.g., 44 at 7 minutes compared to 24 at 3 minutes) suggests that temporal
adjustments become more critical as separation requirements grow, ensuring that
aircraft entry times into the system are staggered to avoid conflicts. An
important implication of these findings is the impact of LONsep
on airspace utilization efficiency. While a LONsep
of 3 minutes results in fewer conflicts (98 total) and allows for more frequent
aircraft movements (approximately 3 minutes per flight), a LONsep
of 7 minutes, despite reducing link conflicts, leads to a higher total conflict
count (138) and reduces the throughput of aircraft in the airspace. This
trade-off between safety and efficiency is a critical consideration for ATM.
For example, a 3-minute separation enables higher airspace utilization, which
is optimal for busy air traffic scenarios, whereas a 7-minute separation, while
safer in terms of link conflicts, may underutilize the airspace, potentially
leading to delays and increased operational costs.
Figure
12 showcases the results of the conflict detection and resolution algorithm,
detailing the adjusted entry times and flight levels determined by the system.
The dataset includes key flight parameters such as aircraft names,
pre-adjustment entry times, aircraft types, speeds, flight routes, and original
flight levels. Flights with adjusted flight levels are highlighted in green,
while those with modified entry times are marked in red for easy
identification. For example, FDX928 shows a flight level adjustment from FL370
to FL360, while VJC275 entry time shifts from 10:10 to 10:14 to avoid
conflicts. The algorithm demonstrates its capability to handle various types of
aircraft and differing speeds effectively.
The
results obtained through the model can serve as a decision-support tool for ATM
authorities. By simulating different separation standards and their impact on
conflict rates and resolution strategies, stakeholders can make data-driven
decisions to optimize traffic flows. The flexibility of the model also allows
for future integration with dynamic re-routing algorithms and machine
learning-based trajectory prediction systems, which can further enhance
conflict resolution efficiency.
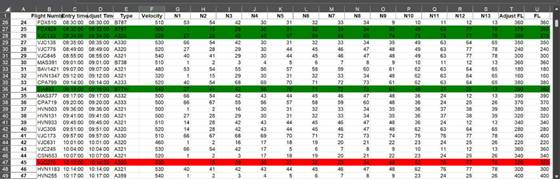
Fig. 12. Flowchart for resolving
conflicts at links by time
5. CONCLUSION
This
study introduces a novel airspace structure by applying the WOTN model to the
HCM FIR, along with the development of a conflict detection and assessment
program using a simulated dataset of 500 aircraft operating within the proposed
model.
The
application of the WOTN model in the Ho Chi Minh FIR is feasible and offers
substantial support for flight planning, conflict detection, and resolution. As
a result, the system has the potential to reduce the workload of air traffic
controllers. Additionally, it enables more flexible and optimized routing
options for individual flights, supplementing the existing structured ATS route
system without limitations on the number of usable routes.
The
findings demonstrate the system’s effectiveness in detecting and resolving
conflicts across various LON_sep values.
Nevertheless, the observed increase in total conflicts with higher LON_sep values highlights the importance of a balanced
approach when determining separation standards, ensuring both safety and
operational efficiency. Future research may investigate hybrid strategies that
dynamically adjust flight levels and timing, possibly incorporating machine
learning techniques for real-time conflict prediction and mitigation.
Furthermore, examining the impacts of aircraft type, speed, and route
complexity on conflict patterns could further improve system performance under
varying traffic conditions.
References
1. Imen Dhief. 2018. „Optimization
of aircraft trajectories over the North Atlantic Airspace”. PhD thesis. Toulouse, France: Université
Paul Sabatier.
2. Jaime de la Mota, María
Cerezo-Magaña, Alberto Olivares, Ernesto Staffetti. 2023. „Data-Driven
Probabilistic Methodology for Aircraft Conflict Detection Under Wind
Uncertainty”. Transactions on Aerospace and Electronic Systems 59(5):
5174-5186. ISSN: 1557-9603. DOI: https://doi.org/10.1109/TAES.2023.3250204.
3. Nguyen Ngoc Hoang Quan, Le Minh
Hoang, Dinh Trinh Binh, Nguyen Thu Thao, Le Toan Thinh, Nguyen Van Tien
Son, Vu Nguyen Hoang Vu. 2024. „Constructing optimization model based on WOTN
model in Ho Chi Minh flight information region”. In: International Symposium on
Aircraft Technology, MRO & Operations”. Vietnam Aviation Academy,
Hochiminh city, Viet Nam. 27-29 August 2024.
4. Nguyen Ngoc Hoang Quan,
Vladimir N. Nechaev, Vyacheslav B. Malygin. 2025. „Mathematical model and
application of the A-star algorithm to optimize ATS routes in the area control
center Ho Chi Minh airspace”. Crede Experto: Transport, Society, Education,
Language 3: 64-85. ISSN: 2312-1327. DOI: https://doi.org/10.51955/2312-1327_2025_1_64.
5. OAG. 2024. The busiest flight
routes of 2024. Available at: https://www.oag.com/busiest-routes-world-2024.
6. Roja Ezzati Amini, Kui Yang,
Constantinos Antoniou. 2022. „Development of a conflict risk evaluation model
to assess pedestrian safety in interaction with vehicles”. Accident Analysis
& Prevention 175: 106773. ISSN: 0001-4575. DOI: https://doi.org/10.1016/j.aap.2022.106773
7. Rosenow Judith, Martin Lindner,
Joachim Scheiderer. 2021. „Advanced Flight Planning and the Benefit of
In-Flight Aircraft Trajectory Optimization”. Sustainability 13(3). ISSN: 2071-1050. DOI: https://doi.org/10.3390/su13031383.
8.
Rui Chibante. 2010. Simulated
Annealing, Theory with Applications. London: Intechopen. ISBN:
978-953-307-134-3.
9.
Shafi Imran, Muhammad
Fawad Mazhar, Anum Fatima, Roberto Marcelo Alvarez, Yini Miró, Julio César
Martínez Espinosa, and Imran Ashraf. 2023. „Deep
Learning-Based Real Time Defect Detection for Optimization of Aircraft
Manufacturing and Control Performance”.
Drones 7(1): 31. ISSN: 2504-446X. DOI: https://doi.org/10.3390/drones7010031.
10. Shangyao Yan, Ching-Sheng Sun, Yi-Hsuan Chen. 2023. „Optimal
routing and scheduling of unmanned aerial vehicles for delivery services”. Transportation Letters 16(7):
764-775. ISSN: 1942-7867. DOI: https://doi.org/10.1080/19427867.2023.2237736.
11. Viet Nam News. „Vietnamese
aviation predicted to transport over 80 million passengers next year”.
Available at: https://vietnamnews.vn/society/1638458/vietnamese-aviation-predicted-to-transport-over-80-million-passengers-next-year.html.
12. Vladimir Braverman. 2016. Sliding
Window Algorithms. In: Kao M.Y. (eds). Encyclopedia of Algorithms. Springer, New York, NY.
13. Xiangyu Wang, Yanping Yang, Dong Wang, Zijian Zhang.
2022. „Mission-oriented cooperative 3D path planning for modular
solar-powered aircraft with energy optimization”. Chinese Journal of Aeronautics 35(1): 98-109. DOI: https://doi.org/10.1016/j.cja.2021.04.015.
14. Xuesong Wang, Ruolin Shi,
Andreas Leich, Hagen Saul, Alexander Sohr, Xiaoxu Bei. 2025. „Conflict extraction and characteristics analysis at
signalized intersections using trajectory data”. International Journal of Transportation Science and Technology 16(7):
764-775. ISSN: 1942-7867. DOI: https://doi.org/10.1080/19427867.2023.2237736.
Received 01.03.2025; accepted in revised form 01.05.2025
![]()
Scientific Journal of Silesian
University of Technology. Series Transport is licensed under a Creative
Commons Attribution 4.0 International License