Article
citation information:
Solarz, A., Borowiec, N. Airborne laser scanner as a data
source for building selected elements of an intelligent database for
transportation. Scientific Journal of Silesian University of
Technology. Series Transport. 2024, 124,
197-216. ISSN: 0209-3324. DOI: https://doi.org/10.20858/sjsutst.2024.124.14.
Agnieszka SOLARZ[1],
Natalia BOROWIEC[2]
AIRBORNE
LASER SCANNER AS A DATA SOURCE FOR BUILDING SELECTED ELEMENTS OF AN INTELLIGENT
DATABASE FOR TRANSPORTATION
Summary. In this study, the main
objective was to detect the road network and key road infrastructure elements
based on airborne laser scanning data. The study included identification of the
road network and determination of its axes using three independent methods, as
well as detection of horizontal signs such as pedestrian crossings. The
analysis process was based mainly on digital image processing methods, based
solely on lidar data, without using information from
other sources. The results of the analysis showed that the use of lidar data provides a fast and effective method for
continuously updating information on road infrastructure and expanding the
transportation database. This potentially opens the door to effectively
updating relevant data in the area of transportation infrastructure.
Keywords: airborne laser scanner, detection, image
processing, transport
1. INTRODUCTION
The road network is the main tool involved in
individual and public transportation, both in cities and areas covered with
scattered buildings, but also in intercity and international sections. Road
transport is the most common form of movement, so it is important to have an
up-to-date data set. Knowledge of the road network is vital information, used
by a wide range of users, who have different ways of using the available data.
They can serve, among other things, as a basis for the introduction of the
Intelligent Transportation System (ITS) [1]. An intelligent transportation system is an
advanced system based on information and communication technologies that aims
to optimize transportation management and operations [2]. ITS uses various
technologies, such as vehicle-to-vehicle (V2V)
communication, vehicle-to-road infrastructure (V2I)
communication, advanced traffic control systems, and data collection and
analysis [3].
The goal of intelligent transportation systems
is to improve the safety, traffic flow, efficiency and environmental
performance of transportation systems. This includes applications in various
modes of transportation, including roads, public transportation, airports,
marine ports and other transportation areas [4].
For the smooth implementation of
Intelligent Transportation Systems, their proper functioning and the sharing of
results with the user, it is necessary to know the structure and elements of
the road system in the area. Without this basic information, it is impossible
to introduce further, more advanced information. Such data is collected and
compiled in Poland by the General Directorate of National Roads and Highways.
Management of the national road
network is an important issue, as it enables the proper operation and
functioning of the nationwide transportation network. The road data bank built
supports this task. It implements the issues and provisions of the decree of
the Minister of Infrastructure in Poland [5]. According to these documents, the General
Director of National Roads and Highways is required to collect data related to
the network of public roads, bridges, tunnels, and ferries. The collected
information is grouped in the form of databases, in which information on the
state of the road network is available. Data describing the transportation
network and characterizing the phenomena that occur within the road are
collected in the Road Data Bank system. The detailed description of the components
of the transportation network, coupled with statistical data pertaining to
usage or traffic volume, enables one to observe the happenings, model the
requirements of users, and effectively develop the transportation network to
meet the expectations of the traveling public and meet the demands of society.
And for the proper functioning and effective management of the road network, it
is necessary to regularly update the database.
2. TRANSPORTATION NETWORK DATABASES
A transportation
network database is a collection of structural information and data on the
infrastructure, roads, routes, modes of transportation and other elements that
constitute an area's transportation system. This database is used to analyse, plan, manage and optimize traffic and
communications in a region. It stores vital information that enables the
effective operation and development of the transportation system. Elements of
the transportation network database may include, among others, road information,
i.e., data on road types (highways, national roads, local roads), road
numbering, length, width, number of lanes, location of road junctions, traffic
circles, bridges and tunnels, information on traffic signs, traffic lights,
pedestrian crossings, information signs and their location.
The transportation
network database is a key tool for government institutions, local authorities,
transportation companies and others involved in planning and managing traffic
and transportation infrastructure. With proper analysis of this data, decisions
can be made to improve the efficiency, safety, and sustainability of the
transportation system. Developing infrastructure: investments in expanding and
upgrading roads, highways, and public transportation systems can increase
traffic capacity and fluidity.
Various methods and
sources of information can be used to collect data for the construction of a
road base. The most common method to collect data on the road network is field
surveying. However, such a solution is very time-consuming and expensive,
especially for extensive areas. With the development of technology,
opportunities for faster data collection have emerged. One way to collect data
can be through maps and geospatial information systems (GIS), such data information
on road locations, road signs, pedestrian crossings [7]. Mobile and GPS
technologies provide another method of spatial data collection and analysis.
The use of mobile applications equipped with GPS technology enables the
collection of information on location, travel routes and speed. Among
researchers and professionals, there are some who focus on the basics of deep
learning to better process and analyse the collected
data [7]. Others, however, focus on applications that run on mobile devices and
discuss a wide range of applications, from basic navigation to complex traffic
analysis systems [8].
Another group of researchers focuses on the
applications of these technologies in urban areas. They describe in detail how
mobile applications and GPS sensors can be used to monitor and manage urban
traffic, optimize public transport, and urban planning [9].
Other very frequently used data for the
construction of a road infrastructure base is photogrammetric data, which,
using photogrammetric methods, allows precise detection and analysis of the
road network. Among these methods, two streams are noticeable.
The first current uses high-resolution aerial
photographs. In this group, solutions based on image segmentation are
introduced, which allow the identification of individual road infrastructure
elements. Segmentation is often supported by techniques for tracing the road
structure in the images and shape analysis, allowing a more accurate
representation of the road network. The authors of [10] describe a method using
vector field learning to extract roads from high-resolution images. In
contrast, the paper [11] reviews various road extraction techniques,
highlighting the importance of shape analysis and image segmentation. They also
use morphological operators [12] and thresholding techniques [13] to extract
road structures from satellite images, enabling accurate detection and analysis
of shapes and road structures in images. On the other hand, the paper [14]
introduced solutions for updating vector road maps from high-resolution images,
using change detection at road intersections and directed road tracking. All of
these approaches, whether based on high-resolution aerial images or using
morphological operators and thresholding techniques, are key to the effective
management of road infrastructure and the monitoring of changes in the
landscape. They allow databases to be updated on an ongoing basis and decisions
to be made regarding the development and maintenance of the road network based
on the most up-to-date and precise information available through modern
photogrammetric and remote sensing technologies.
A second approach to road network detection
based on photogrammetric data is the use of airborne laser scanning data. LiDAR
data allows precise mapping of terrain heights and objects on the ground
surface, which is extremely useful for landscape change analysis and urban
planning. These techniques also allow for point density analysis and the
detection of anomalies in terrain structure, which can lead to the identification
of new or altered roads and paths [15].
Both approaches, whether based on
high-resolution aerial images or using laser scanning, are crucial for the
effective management of road infrastructure and the monitoring of changes in
the landscape. They allow databases to be updated on an ongoing basis and
decisions to be made regarding the development and maintenance of the road
network based on the most up-to-date and precise information available through
modern photogrammetric and remote sensing technologies.
3. AIRBONE LASER SCANNER AS A DATA SOURCE
LiDAR is an active remote sensing system that
first generates a laser pulse and then records the energy reflected from a
given surface. Knowing the time the signal was generated and when it was received,
as well as the properties of the generated light wave, it makes it possible to
determine the distance to the object [16].
The obtained information is collected and
stored as a spatial point cloud. Each point, in addition to three coordinates
(X, Y, Z), can be assigned such information as reflection echo, reflection
intensity, scanning angle, information on R, G, B components, as well as the
layer to which the point belongs after classification. The classification
process involves dividing the cloud points into a dozen layers. These layers
are defined by ASPRS (American Society for Photogrammetry and Remote Sensing),
the main ones being 2 – Ground, 3 – Low Vegetation, 4 – Medium
Vegetation, 5 – High Vegetation, 6
– Building. The primary and compatible data
exchange format is LAS. Additional information significantly expands the areas
of data use [17]. A large part of
point cloud-based road detection algorithms involve rasterizing the data using
attributes, i.e. the height and slope of adjacent pixels [18], features of
continuousness and homogeneity [19], and reflection
intensity, based on which pixels are grouped [20].
The purpose of the present research was to
test the effectiveness of methods using airborne laser scanning for the rapid
detection and completion of selected road infrastructure elements, which are an
important part of transportation databases. The research specifically focused
on roadway centreline identification and pedestrian crossing extraction using
data acquired from airborne laser scanning.
4. DATA AND DETECTION
OF SELECTED ELEMENTS OF ROAD INFRASTRUCTURE
The research used a point cloud derived from
airborne laser scanning, which was acquired as part of the ISOK project. The
ISOK project is an IT system for country protection against extreme hazards,
aimed at protecting the environment, economy, and society against disasters,
mainly flooding. The ISOK project is co-financed by the European Regional
Development Fund as a part of the Innovative Economy Operational Program – Priority Axis 7.
In the present project, the study was carried
out for a fragment of the area of the city of Kraków. The analysis covers
district II – Grzegorzki in the
area of Starowislna, Dietla, Grzegorzecka, Pokoju Avenue, Podgorska, Kotlarska,
Powstania Warszawskiego Avenue and Grzegorzeckie Roundabout, as well as part of
district XIII – Podgorze, in the
area of Kotlarski Bridge and a fragment of Gustaw Herling – Grudzinski Street. The area with an area of about 2.25 km2 is
mainly built up with compact buildings, with facilities for various types of
services and office space, as well as residential areas. The Vistula River
flows through the study area, and the Krakow-Tarnow railroad line is carried
out.
The point cloud used in the study, is of a
density of 12 points/m2, with an average distance between points of
about 0.3 m, is recorded in the PL-1992 plane rectangular coordinate system and
the PL- RON86-NH altitude system. The data is classified according to ASPRS
standards and saved in files in LAS format. Nine files described by symbols
were used in the project: M-34-64-D-d-2-3-1-2, M-34-64-D-d-2-3-1-4,
M-34-64-D-d-2-3-2-1, M-34-64-D-d-2-3-2-2, M-34-64-D-d-2-3-2-3,
M-34-64-D-d-2-3-2-4, M-34-64-D-d-2-3-3-2, M-34-64-D-d-2-3-4-1,
M-34-64-D-d-2-3-4-2 (Fig. 1).
Fig. 1. The study area on the background of the
orthophoto with
a split into the ranges of each file
4.1. Detection of road
network
In order to build and develop the
transportation network and ways of efficient management and management, there
are automatic and semi-automatic methods of road detection. These methods are
mainly based on the use of photogrammetric and laser data. In general, road
network detection methods are based on the construction of point cloud rasters.
The rasters can be built based on elevation, echo, or reflection intensity. In
the next steps, the extraction of information on linear elements (roads) is
possible through the use of digital image processing methods [21].
The first stage of the present study involved
the extraction of the road network. For this purpose, the point cloud was
classified into two layers: road and non-road. First, a raster with a mesh
equal to 0.5m was constructed using single reflection intensity. A pseudo
raster was created using inverse distance interpolation. The use of these types
of points allows extracting from the entire set of points reflected from “hard”
surfaces (road), which completely return the signal and do not allow
registration of subsequent echoes. Wanting to perform classifications using
reflection intensity, it is necessary to know the ranges of pixel brightness
values for each class. For this purpose, a test field consisting of 115 pixels
was made, which makes it possible to determine the limits. The points included
in the samples represent the surface of wide and multi-lane main roads and
local roads. A breakdown by type of pavement was not performed, due to the
small variety of them in the study area and the difficulty of manually
separating them. The distribution of the selected points along with the
intensity image is shown in Figure 2. Intensity values from the raster
generated earlier were assigned to the indicated points. Based on these, limit
values corresponding to roads were calculated.
Fig. 2.
Distribution of points representing roads on the intensity raster
The classification
of points, which involves separating road areas, was done using the maximum
likelihood method. In this method, one of the conditions is that the intensity
values of the points representing the roadway assume a Gaussian normal
distribution, which makes it possible to use the likelihood function described
by the following formula (1):
![]() (1)
(1)
where:
X - intensity values assigned to a raster
cell,
L(X) - the probability
of X belonging to a specified class,
μ - the average
intensity value for the tested sample of points,
σ - standard
deviation.
In order to
implement the above equation, the mean value of the points, standard deviation
and threshold values were calculated. The maximum value of L(X) is taken when X is
equal to the size of the sample mean, while the minimum threshold is reached
for the smallest value of X from the
test sample [21]. The calculated
values are shown in Table 1, where the intensity raster was recalculated based
on them (Fig. 3a).
Analysing Figure 3a above, the outline of the
road network is noticeable, but pixels representing other land cover elements
have also been classified as roads. This has to do with signal reflection
values, which can be similar for different types of surfaces. The use of
intensity alone in the classification process is not sufficient to correctly
detect the road network. Therefore, further processing was performed to narrow
down the areas representing roads. First, pixels that represent land cover
elements were eliminated. These elements are mainly areas located in the
regions of buildings, where the intensity value of roofs was close to the
limits of the selected intensity samples. For this purpose, a normalized
Digital Surface Model (Digital Surface Model – Digital Terrain Model) was generated from the points of the last
reflection with a pixel size of 0.5 m. Using the nDSM, which contains height
information, it is possible to eliminate those pixels whose value is greater
than 0 (roads lie on the ground, so their height on the nDSM = 0m). The
resulting raster is shown in Figure 7b. (Fig. 3b).
Intensity values
used in the road classification process
|
Parameter |
Value |
|
average (μ) |
20,6 |
|
standard deviation (σ) |
6,0 |
|
L(X) min (for X = 11) |
0,018 |
|
L(X) max (for X = 20,6) |
0,067 |
Fig. 3. Binary images: black colour -
detected areas (road network), white colour - surrounding areas a) obtained by
performing the classification process, b) obtained by raster algebra using nDSM
(normalized Digital Surface Model)
The obtained raster (Fig. 3b) clearly shows
the road network. By introducing the height condition, it was possible to
eliminate areas that represent the river, buildings and other elements that are
not roads. These treatments significantly improved the detection of elements of
the transportation network, but the image still has a lot of noise, single
pixels that do not belong to the detected group. Furthermore, there are
noticeable errors in the form of parking lots or other objects with flat
surfaces, whose intensity is within the limits accepted for roads. Examples of
errors are shown in the figure below (Fig. 4).
The next step was
to use a median filter, which removed the noise in the image. Next, an opening
operator was applied to the image. This transformation combines an erosion
operation with a subsequent dilation based on the same structural element. The
next transformation is a combination of functions related to the size of the
objects, which is the extraction and subsequent removal of objects with a
certain number of pixels. The raster was also subjected to transformations
related to filling in “holes” in the road, created at pedestrian crossings or
standing cars. A closure operator was used to fill “holes” occurring on
detected linear elements [22]. All the
processing of the digital image mentioned above significantly increased its
readability (Fig. 5).
Fig. 4.
Examples of incorrectly detected surface elements (playfields, parking)
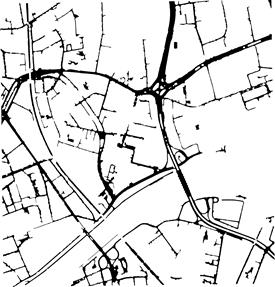
Fig. 5. The
resulting raster with the detected road network
To determine the
exact course of the road network, the axes of the road network were detected.
This process was performed by three independent methods. Two of them are related
to the use of morphological transformations of the binary image, and the third
solution is automatic vectorization.
The first
morphological transformation is thinning, which reduces detected objects in the
image until the element reaches a specific width, such as a single pixel.
Filled objects are reduced to curves of a specific thickness, while when an
object has gaps, a ring is created. The result obtained is shown in Figure 6a.
It is noticeable that there are short sections that are not actually roadway
axes.
The second method
by which road axes were detected is skeletonization. This function is also
designed to obtain a line of one pixel thickness from the elements in the
image. In the process, a centreline with a preserved topology is extracted. In
addition, there is an option to enter the minimum value of the segment, which
allows removing from the image, short and at the same time incorrect fragments.
The result is presented in Figure 6b.
The third solution tested is the process of
automatic vectorization. This tool is mainly used to automatically determine
the position of plot boundaries or contours from a scanned map. During
automatic vectorization, a line smoothing parameter is defined. The results are
vectors that have been rasterized so that a direct comparison with other
methods is possible (Fig. 6c).
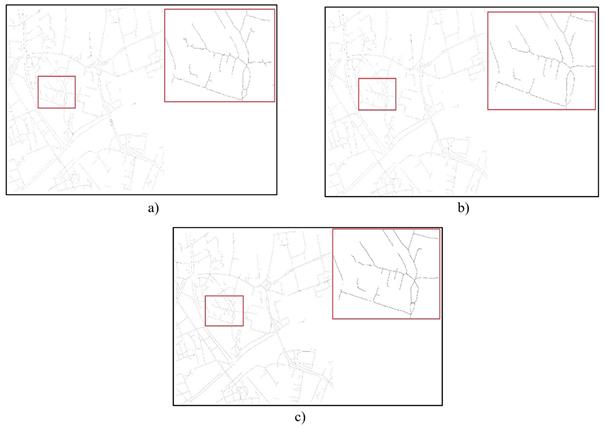
Fig. 6. The
resulting raster with the detected road network – detection of road axes, by
various methods: a) thinning, b) skeletonization, c) automatic vectorization
4.2. Extracting pedestrian crossings
Indicating the location of pedestrian
crossings can be vital information for both pedestrians and drivers, but also
for traffic managers. Such information may also be helpful in the context of
special groups of pedestrians, which include children [23] or the disabled [24].
Collecting this type of data manually can be time-consuming. Therefore, an
attempt was made to detect pedestrian crossings by a semi-automatic method
using lidar data. The intensity of the reflections, as well as the RGB values
that were assigned to the cloud points, were used to detect these elements.
Horizontal signs, of their high importance in transportation and the need to
make them highly visible in various conditions, are painted with reflective
paint, which should also make them much easier to detect in rasters. The pixels
representing pedestrian crossings painted on the asphalt stand out
significantly from their surroundings, and the high contrast of the signs in
relation to the pavement provides an opportunity to use such information in the
processing of intensity images.
The first stage, of detecting pedestrian
crossings, was performed analogously to road detection. The generated intensity
image indicated 90 points, which were then assigned intensity values from the
raster. From these, the mean value, standard deviation and limits were
calculated according to formula 1. The range of intensities indicated for
horizontal markings is too wide and includes pixels with different types of
use. Therefore, an additional step that was introduced to improve the quality
of detection is to act on the rasters obtained from the R, G and B channels.
After generating the raster from the coloured points of the last reflection,
the values from each channel at the test points were extracted. Based on the
collected values, mean values, standard deviations and then limits were
calculated, which were determined at distances of one standard deviation
(σ) from the mean values. The calculated elements are summarized in Table
2.
Values of
parameters based on which pedestrian crossings were detected
|
Parameter |
Intensity value |
Value - R channel |
Value – G channel |
Value - B channel |
|
Average (μ) |
86,9 |
47156,5 |
46670,0 |
48853,5 |
|
Standard deviation (σ) |
23,1 |
10229,0 |
9690,0 |
8509,3 |
|
L(X) min (for X = 42) |
0,003 |
- |
- |
- |
|
L(X) max (for X = 86,9) |
0,017 |
- |
- |
- |
|
Minimal |
- |
36927,5 |
36980,0 |
40344,2 |
|
Maximum |
- |
57385,5 |
56360,0 |
57362,8 |
After calculating
the limit values, the common part was extracted from the areas determined in
each channel (R, G, B) and from the image obtained after classification using
the intensity parameter. The detected elements are not only pedestrian
crossings, so a mask was applied in the form of a raster obtained in Section
4.1 presenting the detected road network. The result of the combined rasters is
presented in Figure 7.
In this approach, in addition to the detected pedestrian
crossings, additional elements painted on the roadway are extracted. In
particular, the lines separating individual roadway lanes are well represented.
To reduce the number of elements that do not represent the desired objects,
image transformations were applied. Combinations of operations related to
counting and removing groups of pixels of a certain number, morphological
closure with a defined structural element, as well as basic operations, i.e.
image difference, were used. When performing transformations, it was noted that
the separation of pedestrian crossings from erroneous elements is not fully
possible, despite the selection of various parameters. However, the achieved
result makes it possible to easily perform the identification of the road
horizontal marking elements in question (Figure 8).
Fig. 7. The
image resulting from the combination of the classification result and the mask
formed from the detected roads – an enlarged fragment (elements detected are
black)
5. ANALYSIS AND ASSESSMENT OF THE ACHIEVED RESULTS
In order to practically implement new methods or use existing solutions
for object detection, it is crucial to accurately estimate the precision and
completeness of the detected elements. Therefore, this chapter provides a
detailed evaluation of some of the results obtained.
5.1. Completeness of detection of specific
elements
The completeness of the detected elements of the road network is crucial
in evaluating the results. Too much generalization is associated with a
reduction in the set of detected elements, at the same time, the “uncleared” data has too much incorrect information.
Therefore, it is necessary to optimize the methods used accordingly. Detection
of a road network from airborne laser scanning data using only intensity
information does not give satisfactory results. Therefore, additional
attributes, i.e. height and RGB, were used for the
study. The analyses showed that the completeness of road detection is largely
related to the width of the street. For wide and multi-lane traffic lines, the
proposed algorithm performs better, as the object is mapped by a larger number
of pixels. Small streets running through residential neighbourhoods or access
roads were not included in the detected network in several cases. In addition,
within residential roads, where cars park on the side of the road, the width of
the road is incorrectly determined. The discontinuity of the band of the
detected road also appeared in places where the road runs under a bridge or
overpass. On the resulting raster, there are also areas assigned to roads that
are not actually roads. These are elements that have similarity in intensity,
but are often large flat areas that can be eliminated by applying appropriate
image transformations and filtering, e.g. using shape, surface. The transport
network has been largely correctly extracted. Figure 9 shows where there are
deficiencies of only narrow streets in residential areas. In contrast, Figure
10 draws in sections of undetected streets. These sections account for about
21% of all streets located in the area. A portion of the undetected roads are
not covered with asphalt pavement, which was included in the analyses.
Another aspect of the performance evaluation is to check the
completeness of detection of pedestrian crossings. Some of them may have been
filtered out due to insufficient size or number of recorded lines, which may
have been caused by cars left within the sign limits or problems in their
detection related to physical wear and tear of the sign painted on the pavement.
The number of detected crossings is also influenced by the shape and detail of
the road network defined at an earlier stage, which acts as a mask limiting the
areas of the extracted elements. Where roads have gaps, the error carries over
to subsequent passages. The resulting map derived from the horizontal sign
detection stage includes elements of other signs, such as fragments of lines
separating adjacent roadway lanes. Therefore, only whether crosswalks were
missed was considered in assessing completeness and correctness. Undetected
pedestrian crossings are marked in Figure 9. Identification and inspection were
performed manually using an up-to-date orthophoto.
The automatic detection of pedestrian crossings is satisfactory, as in an area
of more than 2 km2, only a dozen is
missing. About 75% of the horizontal signs (pedestrian crosses) present were
correctly detected.
5.2. Accuracy of road axis detection
The completeness of the detected data is the basis for evaluating the
accuracy of road axis detection. In this
study, three different methods were used to generate axes. The purpose of this
subsection is to determine how accurately the axes are represented and which of
the methods used is the most advantageous.
A visual analysis was performed first. The image generated by the
automatic vectorization process has the smoothest lines, but the joints of
individual edges, e.g. intended to represent an intersection, are not smoothed
and do not transition smoothly from one to another. Thus, the image does not
reflect the actual shape of the axis and looks unnatural. The use of a
smoothing filter gives more satisfactory results visually. The edges of the
streets are clear, and the corners and intersection areas smoothly reproduce
the transition between lines. The downside of the image derived from the
discussed function is the occurrence of “branches.” These are small lines,
misrepresenting the axis of the road, but significantly disrupting the visual
perception and evaluation of the method. Similar anomalies are formed using skeletonization, but in this case, already at the stage of
determining its parameters, it is possible to eliminate such sections when
adopting a length criterion for them.
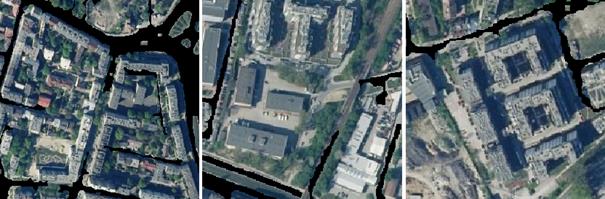
Fig. 9. Final rasters overlaid on the orthophoto with
examples of areas where the road was not detected (red, enlarged sections) and
pedestrian crossings that were not detected (yellow dots)
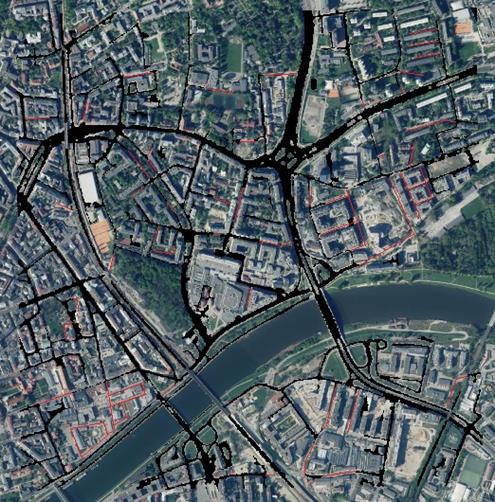
Fig. 10. Detected roads and drawn in segments representing missing roads
(red)
Such a solution combined with the shape of the line similar to that
created from the application of the smoothing filter gives a certain advantage.
From this, it can be judged that, performing the evaluation from a visual point
of view, the most favourable results were achieved using the skeletonization method. When performing visual analysis of
the detected axes, attention should be paid to the traffic circle, which is
located within the area. It is a heavy element to extract axes due to its
shape. An additional complication is the streetcar tracks running through the
centre and crossing each other, which were also detected. Axis detection in
this area was not performed correctly. Each of the tested algorithms showed
problems with drawing the axes in this area, failing to define which elements
should be connected to each other. The results produced using the subsequent
functions are shown in Figure 11, but they could have been used for subsequent
analyses, some refinements and transformations in the methods would have to be
made, other tools would have to be sought, or the problematic section would
have to be worked out manually.
To check the accuracy of road axis detection, reference data was used. A
road network manually vectorized from an orthophoto was used as reference data. A database of 82
points located on road axes was constructed. These points served as reference
points. The points were distributed on both main and side roads, on straight
sections and on curves. In the next step, the distances from each identified
reference point to the detected road axis were determined for each method
separately. Based on the collected length values, the average values for each
method and their mean-square errors were calculated (Tab. 3).
Fig. 11. Drawn axes road in the traffic circle area: orthophotos
(a), application of smoothing (b), skeletonization
(c), automatic vectorization (d)
Tab. 3
Summary
of the calculated distance values for the various methods of extracting the
road axes
|
Methods: |
Thinning |
Skeletonization |
Automatic vectorization |
|||
|
82 points |
71 points |
82 points |
71 points |
82 points |
71 points |
|
|
Average reference point-axis distance [m] |
1,75 |
0,86 |
1,84 |
0,92 |
2,42 |
1,43 |
|
MSE [m2] |
7,52 |
1,17 |
8,33 |
1,38 |
12,48 |
4,79 |
|
RMSE [m] |
2,74 |
1,08 |
2,89 |
1,17 |
3,53 |
2,19 |
Analysing the results obtained from the conducted
tests, it is noticeable that the average distance between the reference points
and the generated axis achieves the best results when using the thinning
technique. This method was favourably evaluated, considering the visual aspects
and the shape of the detected axes. However, its significant limitation is the
generation of “branches” that limit correct identification and introduce
erroneous elements. Such an imperfection is not present in the result using the
skeletonization method, which positively influences the final perception of
this method despite obtaining weaker RMSE values. The lowest accuracy was
obtained in the automatic vectorization method. It is worth noting that all 82
points were used for the initial analysis. It was noted that for some distances
significantly differ in the three methods studied. Particularly, this situation
was observed in the case of streets consisting of two carriageways, where there
is a green belt or a tramway track between them. After digital image processing
operations, the area between the carriageways was also identified as a road,
resulting in the generation of a single axis running through the centre of the
dividing lane, with the reference point placed in the centre of one of the
carriageways. Similar situations occurred when there was a bicycle path or
plaza in close proximity to the edge of the road. These objects were partially
identified as part of the road, resulting in a shift of the generated road axis
and significant differences in position. Another case that distorts the results
is a traffic circle located within the study area. In the case of this element,
the analysis for the algorithms became difficult because streetcar tracks
crossed in the middle of the traffic circle, which proved to be unmovable.
These elements introduced additional disturbances, which caused the functions
used for axis extraction to not work properly. In order to eliminate the impact
of such cases on the accuracy assessment, in the example studied some points
were excluded from the analysis, leaving 71 points. As a result, two columns of
points are summarized in Table 3 for comparison.
6. CONCLUSION
The aim of this study was to detect selected elements
of the road infrastructure using, exclusively, airborne laser scanning data.
The first element focused on was the shape of the road network. This was based
on the point intensity attribute, and detection was performed on the generated rasters. One of the key issues in image
classification is identifying the right number and location of points with the
right intensity. In the area analysed, most of the road surface was asphalt,
but despite the same material, the range of reflection intensities was quite
wide. The intensity is influenced not only by the type and colour of the
pavement, but also by the angle of incidence of the pulse. So the input set of
points with a certain intensity is wide, resulting in the detection of a much
larger number of objects on the ground surface. But using appropriate digital
image processing, redundant elements can be automatically eliminated. However,
the algorithms used did not cope very well with the automatic detection of roundabouts.
In this case, manual correction is necessary. Narrow roads can also be
problematic, especially on housing estates, where their detection is also
adversely affected by shadow. Despite a few undetected elements, the final
results can be described as satisfactory. The main roads were detected
correctly, and it must be borne in mind that only lidar
data was used.
The detection of pedestrian
crossings is the next stage of the study. This stage was based on indicating
test points and then calculating boundary quantities from the intensity
parameter values. Identifying the points proved to be a relatively difficult
task so that they represented the entire intensity range for all crossings.
Horizontal signs painted with specialized paint have a characteristic level of
pulse reflection, but not all stripes are renewed frequently enough. The worn-out
paint looks slightly different on the intensity raster, and the range that
needs to be extracted increases significantly, making the task of subsequent
filtering more difficult. Even despite the integration of the classification
results from the intensity image and the individual RGB
channels, as well as the overlay of a mask related to the road network, many
elements were incorrectly indicated. The mask itself, created in the previous
project stage, can result in transitions located on roads not previously
detected being removed from the image. A large proportion of the redundant
areas included other horizontal signs painted on the street surface, i.e. lines
separating individual carriageway lanes. The difficulty in image processing is
to use filters that allow pedestrian crossings to remain while removing
unnecessary objects. It is a very time-consuming process to choose the right
function parameters to get the desired result. However, despite these
difficulties, the end result was satisfactory and the extracted data
(pedestrian crossings) can be used to complete the database.
LiDAR provides a broad set of data
which, once the appropriate attributes have been selected and transformed to
suit the type of object, offers the possibility to gather such information,
which both on its own and in combination with others collected in the database,
can provide unique knowledge that is crucial in the intelligent management of
the road network, as well as the entire city. Observing the appearance of the
developed point cloud derived from airborne laser scanning, it should be noted
that its density may not be sufficient to detect point features such as
vertical road signs or traffic lights. Such objects are too small, to LiDAR
ensure respectively large coverage of their points, which would give the chance
to their distinction. However, the accumulation of such data may be possible
after the integration of e.g. with the scanning of the terrestrial or mobile
scanning, or lidar acquired from UAV. The lidar data
offers a range of possibilities for the detection of road infrastructure
elements, which can significantly facilitate activities related to the creation
and expansion of the database used for transport.
Comparing the results of the
research carried out with the latest developments in the detection of road
infrastructure using LiDAR, several important aspects can be noted. Nowadays,
methods using deep neural networks [25] and hybrid techniques [26], which
improve the precision of detection and automation, reducing the need for manual
correction, are increasingly being applied. These new approaches have the
advantage of being better able to deal with pavement heterogeneity and shading,
which was problematic in this study. In addition, the latest technologies using
high-resolution remote sensing images for detection improve classification
accuracy, enabling better differentiation of pavement materials [27].
Contemporary research indicates that the use of advanced machine learning and
artificial intelligence algorithms can significantly speed up the data analysis
process, while eliminating many of the errors associated with manual
interpretation. Nevertheless, some challenges, such as the detection of complex
structures (e.g. roundabouts) and narrow roads, still require further algorithm
improvements. Detection of point infrastructure elements such as road signs
also remains problematic, which can be improved by integrating data with
terrestrial or mobile laser scanning. Additionally, data from sources such as
drones [28] can provide more detailed information that is difficult to obtain
with traditional airborne laser scanning. Overall, the latest technologies
offer promising solutions that can significantly increase the efficiency and
accuracy of future research in this area. The integration of different scanning
techniques and advanced data processing could be the key to fully automating
and the optimization of road infrastructure management processes.
Acknowledgment
The article was prepared under the research subvention of AGH University No. 16.16.150.545 in 2024.
The data presented in this study: (.las files) are available in ISOK project – available at: https://isok.gov.pl/index.html
and also ortophotos are available on National
Geoportal Available – https://www.geoportal.gov.pl.
References
1.
Chojnacki B., M. Kowalewski, A.
Pękalski. 2013. „Importance of national ITS architecture”. Prace Naukowe Politechniki Warszawskiej. Transport 95.
2.
Ibáñez J., S. Zeadally,
J. Contreras-Castillo. 2015. “Integration challenges of intelligent
transportation systems with connected vehicle, cloud computing, and Internet of
Things technologies”. IEEE Wirel Commun 22: 122-128. DOI: https://doi.org/10.1109/MWC.2015.7368833.
3.
Zhang J., F.Y. Wang, K. Wang, W.H. Lin, X. Xu, C. Chen. 2011. “Data-driven intelligent transportation systems: A survey”. IEEE
Transactions on Intelligent Transportation Systems 12: 1624-1639. DOI: https://doi.org/10.1109/TITS.2011.2158001.
4.
Oladimeji D, K. Gupta, N.A. Kose, K. Gundogan,
L. Ge, F. Liang. 2023. “Smart Transportation: An overview of technologies and
applications”. Sensors 23(8): 3880. DOI: https://doi.org/10.3390/S23083880.
5.
Generalna Dyrekcja
Dróg Krajowych i Autostrad – Portal Gov.pl. [In
Polish: General Directorate for National Roads and Motorways]. Available at: https://www.gov.pl/web/gddkia.
6.
Fendi K.G,
S.M. Adam, N. Kokkas, M.
Smith. 2014. “An Approach to Produce a GIS Database for Road Surface
Monitoring”. APCBEE Procedia 9: 235-240. DOI:
https://doi.org/10.1016/J.APCBEE.2014.01.042.
7.
Balado J., E. González, P. Arias, D. Castro. 2020.
“Novel approach to automatic traffic sign inventory based on mobile
mapping system data and deep learning”. Remote Sensing 12(3): 442. DOI: https://doi.org/10.3390/RS12030442.
8.
Elhashash
M., H. Albanwan, R. Qin. 2022. “A Review of Mobile
Mapping Systems: From Sensors to Applications”. Sensors 22(11): 4262. DOI: https://doi.org/10.3390/S22114262.
9.
Wang Y., Q. Chen, Q. Zhu,
L. Liu, C. Li, D. Zheng. 2019. “A survey of mobile laser scanning applications and
key techniques over urban areas”. Remote Sensing 11(13): 1540. DOI: https://doi.org/10.3390/RS11131540.
10. Liang
P, W. Shi, Y. Ding, Z. Liu, H. Shang. 2012. “Road Extraction from High
Resolution Remote Sensing Images Based on Vector Field Learning”. Sensors
21(9): 3152. DOI: https://doi.org/10.3390/S21093152.
11. Wang W., N. Yang, Y. Zhang, F. Wang,
T. Cao, P. Eklund. 2016. “A review of road extraction from remote sensing images”.
Journal of Traffic and Transportation Engineering 3(3): 271-82. DOI: https://doi.org/10.1016/J.JTTE.2016.05.005.
12. Gaetano R., J. Zerubia,
G. Scarpa, G. Poggi. 2011. „Morphological road segmentation in urban areas from high
resolution satellite images”. 17th DSP 2011 International Conference on
Digital Signal Processing, Proceedings. DOI:
https://doi.org/10.1109/ICDSP.2011.6005015.
13. Raziq A., A. Xu, Y. Li, A. Raziq, A. Xu, Y. Li. 2016. “Automatic
Extraction of Urban Road Centerlines from
High-Resolution Satellite Imagery Using Automatic Thresholding and
Morphological Operation Method”. Journal of Geographic Information System 8(4): 517-525. DOI:
https://doi.org/10.4236/JGIS.2016.84043.
14. Sui
H., N. Zhou, M. Zhou, L. Ge. 2023. “Vector Road Map Updating from
High-Resolution Remote-Sensing Images with the Guidance of Road Intersection
Change Detection and Directed Road Tracing”. Remote Sensing 15(7): 1840.
DOI: https://doi.org/10.3390/RS15071840.
15. Chen Z.,
L. Deng, Y. Luo, D. Li, J.J Marcato, W. Nunes Gonçalves. 2022.
“Road extraction in remote sensing data: A survey”. International
Journal of Applied Earth Observation and Geoinformation
112: 102833. DOI: https://doi.org/10.1016/J.JAG.2022.102833.
16. Vosselman G., H-G. Maas. 2010. Airborne and Terrestrial Laser
Scanning. Whittles.
ISBN: 978-1904445876.
17. Narwade R., V. Musande, 2014. „Automatic Road Extraction from Airborne LiDAR : A Review”. Engineering,
Environmental Science 4(12): 54-62.
18. Hu X., Y. Li, J. Shan, J. Zhang, Y.
Zhang. 2014. “Road centerline extraction in complex urban scenes from
LiDAR data based on multiple features”. IEEE Transactions on Geoscience and
Remote Sensing 52(11): 7448-7456. DOI: https://doi.org/10.1109/TGRS.2014.2312793.
19. Clode S., F. Rottensteiner,
P. Kootsookos. 2005. “Improving city model determination by using road
detection from LIDAR data”. IAPRS. Vol. XXXVI, Part 3/W24.
20. Gong L., Y. Zhang, Z. Li, Q. Bao. 2010. “Automated road extraction from LiDAR data based
on intensity and aerial photo”. Proceedings – 2010 3rd International Congress on Image and Signal
Processing: 2130-2133. DOI:
https://doi.org/10.1109/CISP.2010.5647354.
21.
Upadhayay S., M. Yadav, D. Singh. 2018. “Road
network mapping using airborne LiDAR data”. The International Archives of
the Photogrammetry, Remote Sensing and Spatial Information SciencesXLII-5: 707-711. DOI: https://doi.org/10.5194/ISPRS-ARCHIVES-XLII-5-707-2018.
22.
Bhutada S., N. Yashwanth, P. Dheeraj, K. Shekar.
2022. “Opening
and closing in morphological image processing”. Journal of Advanced Research and
Reviews 14(03): 687-695. DOI: https://doi.org/10.30574/wjarr.2022.14.3.0576.
23.
Czech Piotr. 2017. „Underage pedestrian road users
in terms of road accidents”. Advances in Intelligent Systems and
Computing 505: 33-44. DOI: https://doi.org/10.1007/978-3-319-43991-4_4.
Springer, Cham. ISBN: 978-3-319-43990-7; 978-3-319-43991-4. ISSN: 2194-5357.
In: Sierpinski Grzegorz (eds), Intelligent transport systems and travel
behaviour, 13th Scientific and Technical Conference „Transport Systems Theory
and Practice”, Katowice, Poland, September 19-21, 2016.
24.
Czech Piotr. 2017. „Physically disabled pedestrians
- road users in terms of road accidents”. Advances in Intelligent Systems and
Computing 505: 33-44. DOI: https://doi.org/10.1007/978-3-319-43991-4_4.
Springer, Cham. ISBN: 978-3-319-43990-7; 978-3-319-43991-4. ISSN: 2194-5357.
In: Sierpinski Grzegorz (eds), Intelligent transport systems and travel
behaviour, 13th Scientific and Technical Conference „Transport Systems Theory
and Practice”, Katowice, Poland, September 19-21, 2016.
25.
Simegnew Y., J. Alaba, E. Ball.
2022. “A Survey on
Deep-Learning-Based LiDAR 3D Object Detection for Autonomous Driving”. Sensors
22(24): 9577. DOI: https://doi.org/10.3390/s22249577.
26. Soilán M., A. Sánchez-Rodríguez, P. del Río-Barral, C. Perez-Collazo, P. Arias, B. Riveiro. 2019. “Review of Laser Scanning
Technologies and Their Applications for Road and Railway Infrastructure
Monitoring”. Infrastructures 4(4): 58. DOI:
https://doi.org/10.3390/infrastructures4040058.
27.
Shaoyi M., S. Yufeng Shi, Y. Qi, L. Mingyue. 2024.
“A Survey of Deep Learning Road Extraction Algorithms Using High-Resolution
Remote Sensing Images”. Sensors 24(5):
1708. DOI: https://doi.org/10.3390/s24051708.
28.
Zhang Y., Z. Zuo, X. Xiaobin, W. Jianqing, Z.
Jianguo, H. Zhang, W. Jiewen, Y. Tian. 2022. “Road damage detection using UAV
images based on multi-level attention mechanism”. Automation in Construction
144: 104613. DOI: https://doi.org/10.1016/j.autcon.2022.104613.
Received 03.01.2024; accepted in revised form 30.04.2024
![]()
Scientific
Journal of Silesian University of Technology. Series Transport is licensed
under a Creative Commons Attribution 4.0 International License