Article
citation information:
Sistuk, V. A comparative study of
headway-based and transport system-based assignments of public transport in Visum: the city of Kryvyi Rih case. Scientific Journal of
Silesian University of Technology. Series Transport. 2024, 124, 171-182. ISSN: 0209-3324. DOI: https://doi.org/10.20858/sjsutst.2024.124.12.
Volodymyr SISTUK[1]
A
COMPARATIVE STUDY OF HEADWAY-BASED AND TRANSPORT SYSTEM-BASED ASSIGNMENTS OF
PUBLIC TRANSPORT IN VISUM: THE CITY OF KRYVYI RIH CASE
Summary. Many researchers have
explored public transport assignment methodologies employing transport
modelling software. Nevertheless, there remains a gap in evaluating real-world
public transit networks utilizing diverse assignment procedures within Visum software. This paper introduces a thorough comparison
of algorithms involved in public transport assignment processes, using the
transport model of the city of Kryvyi Rih in Ukraine. The three scenarios of the model were
developed depending on the public transport assignment procedure:
headway-based, transport system-based utilized to all links, turns, and major
turns in the network graph, and transport system-based applied only to the
links, turns, and major turns traversed by the active public transport lines. The
model of the network comprises 13 transport systems, 7 transport modes, 27598
links, 10097 nodes, 83270 turns, 238 zones, 1748 connections for private
transport, 3013 connections for public transport, 534 stops, 1165 stop areas,
1190 stop points, 130 lines and 218 line routes. The transport demand model
encompassed 14 demand segments. Compared to the outputs of the model
calculation using the headway-based procedure, in the scenarios with transport
system-based assignment, passenger flows on rail tram lines significantly
decreased. Also, the results of scenarios with transport system-based
assignment showed that the passengers extremely use parallel streets for travel
from an origin to a destination. The modelling outputs for an actual urban
network illustrate that the choice of the shortest route in the transport
system-based assignment is closely linked to the main urban roads. This
circumstance could potentially result in a rise in the number of transfers
needed to sustain accessibility to districts residing far from the central
highway.
Keywords: transport modelling, public transport,
headway-based assignment, transport system-based assignment, impedance, demand
model, Visum
1. INTRODUCTION
For many
years, development of a new urban passenger transport (PuT)
network and improving existing ones has been a significant concern. The success
of these efforts relies heavily on the expertise of transport modellers and the resources at their disposal [1]. The task
involves analysing modelling outcomes, which
necessitates a proficient transport modeller. The modeller interprets the results, typically employing a
graph-based analytical approach, and devises customized solutions for
optimizing the network. In essence, the process of optimizing and routing PuT is carried out manually by the modeller.
Additionally, guidance from transportation macro-modelling manuals [2, 3, 4], various analytical methods [5], and heuristic algorithms
[6, 7, 8] are utilized in developing new routes for PuT
networks. It is also possible to optimize the existing network using
meta-heuristic methods, such as the genetic algorithm [7], or the ant colony
algorithm [8], which is applied to urban transport models [8]. The reliability
indicators can act as indicators to gauge the effectiveness of the measures
taken to optimize the transport network [9].
In [6], an
effort was made to bridge the gap between theoretical exploration of the urban
transit routing problem (UTRP) and practical
transport planning, utilizing the Visum software as a
research tool. A procedure was devised to automate the problem-solving
concerning the optimal PuT
routing, which involved extracting connectors between PuT
stops from the Visum model using a Python script and
the Visum COM-API. This process generated a UTRP graph with an undirected list of stops. Subsequently,
this graph was optimized using a hyper-heuristic algorithm, and the adjusted
routes (oriented stop lists) were converted into PuT
routes in Visum for assessment. The criteria for
optimizing the PuT route network on a global scale
included both passenger and operator total costs. The outcomes of the global
optimization indicated the effectiveness of the hyper-heuristic algorithm for
networks of various sizes, from small to large cities.
The
algorithms mentioned above for PuT routing and
optimization entail either: a) optimizing routes for networks with indirect
connections, which are not reliant on transport macro-modelling software, or b)
intricate transition processes between software environments and the UTRP interface. These aspects render these algorithms
rather complex for practical implementation in transport models of real cities,
which often comprise numerous links, nodes, zones, and demand segments. As a
result, there are significant gaps between the theoretical approaches to
determining the best routing for PuT networks and the
actual implementation of applicable algorithms in real-world transport planning
practices [6].
Meanwhile,
procedures for PuT demand assignment within transport
modelling software incorporate the utilization of shortest path-search
algorithms, which are based on customizable criteria. Essentially, optimal
routing algorithms are inherently integrated into the mathematical network,
often utilizing implicitly derived indicators. Consequently, conducting a
comparative analysis of modelling outcomes using various PuT
assignment procedures becomes essential. These assignment results can then be
effectively employed to optimize existing networks and/or develop new ones.
Many researchers
have studied the PuT assignment procedures [10-19].
Paper [12] introduces a strategy for addressing the challenge of PuT distribution, focusing on networks characterized by
line routes with headway- and schedule-based traffic patterns. The mathematical
model is tested on the example of the Copenhagen metropolis. Paper [13]
presents an approach to the use of agent-based modelling for PuT assignment. In the context of assessing the PuT demand, work [14] modelled the distribution of
passenger traffic on bus routes using the Simulation of Urban Mobility (SUMO)
software. In [15], a model was developed to analyse
the distribution of passenger flows along bus lines based on headway,
considering uncertainty in the impedance function. Additionally, the Method of
Successive Averages (MSA) was introduced.
Study [16]
presents the development of an integrated multimodal model for mode choice and PuT assignment, which allows users to combine passenger
transport on predefined routes (Fixed PT) and on-demand transport (Flexible PT)
in such a way as to minimize travel costs. In a PuT
system, the vehicle fleet is managed by a central control centre,
which allocates incoming transportation requests among vehicles in real time.
The authors of [17] used the Connection Scan Algorithm to model PuT assignment, in which passengers choose a line route
based on travel time, number of transfers, walking time, waiting time, and
delays. Paper [18] presents the results of model PuT
assignment based on timetables (logistic regression to describe the assignment
of passenger flows was applied) using the Visum
software on the example of sparsely populated regions in the Republic of
Lithuania.
Despite
numerous studies on modelling urban PuT networks,
including those utilizing specialized software, there has been a lack of
assessment of real PuT networks using various
assignment procedures within the Visum software.
Given the
information provided, the objectives of this study are as follows:
- conducting
a comprehensive comparison of algorithms involved in the processes of PuT assignment within the Visum
software;
- modelling
an actual PuT network in Visum,
employing various assignment procedures (illustrated with the city of Kryvyi Rih, Ukraine as an
example);
- analysing the outcomes of PuT modelling concerning different assignment procedures.
2. MATERIALS AND METHODS
In the classical
transport model, the PuT assignment procedure, along
with private transport (PrT) assignment, constitutes
the fourth and final stage. This stage follows the trip generation,
distribution, and mode choice. Previously, the Visum
software [10] offered transport planners two procedures for PuT
assignment demand: line-based (based on average headway) and schedule-based.
Assignment based on the average headway involved considering the sequence of PuT stops and travel time between them, as well as the
headways on the line route. The route assessment considered the perceived
journey time (PJT). The timetable-based assignment
already considered, in addition to PJT, the
passenger's utility of a particular departure time for choosing the shortest
route between two transport areas in the network. The latter variant of the
assignment procedure is typically used for rail and bus networks with long
headways (more than 15 minutes) and strict adherence to the schedule.
In addition to the
previously mentioned procedures for the PuT assignment, modern versions of the Visum software also incorporate assignments based on a
transport system (Tsys-based). Transport systems
encompass various individual transport vehicles such as cars and motorcycles,
as well as the vehicles of PuT like buses, trams,
trolleybuses, metros, and taxis. This procedure is often employed for schematic
planning of PuT lines within an “ideal” network.
Using the Tsys-based PuT assignment
procedure allows for preliminary planning of lines, considering both the
existing network and hypothetical PuT lines independently.
By comparing the modelling outcomes obtained from the Tsys-based
procedure with those from the “basic” assignment procedure used in the
transport model, conclusions can be drawn regarding the alignment of the
existing transport network with its idealized concept.
For instance, Kryvyi Rih exemplifies a city
profoundly influenced by open pit mining activities, including iron ore open
pits and tailings dumps, which significantly shape the city's master plan. For Kryvyi Rih, the primary
assignment procedure for PuT
modelling is the Headway-based procedure (HB). This preference stems from the
fact that up to 65% of passenger traffic within the city relies on private bus
routes, operating at intervals of up to 30 minutes.
Accordingly, the task
that is relevant today is to compare the Tsys-based
and HB assignment algorithms to use their advantages in optimizing the
passenger transport network.
2.1. Transport
system-based assignment
The procedure calculates the
shortest routes (minimum required time), which are then compared with the
demand for transportation. The obtained passenger flows represent the
“preferred route network” for the users.
PuT lines are not affected by the Tsys-based assignment. The modelling of transport supply
only considers links of the basic network with specific travel times.
There are three possible methods for
determining the shortest route [4]:
- considering all links (connections), turns, and main turns within the
network graph (road and rail connections);
- considering links, turns, and main turns used by PuT lines;
- considering links, turns, and main turns utilized by active PuT lines.
The Tsys-based
assignment defines a particular route to every combination of origin and
destination areas. This route includes an origin connection, a destination
connection, and the permissible links and turns for the specified transport
system. For each pair of origin and destination, the lowest impedance is
calculated for the available links, turns, and connections within the transport
system, utilizing the associated function.
![]() (1)
(1)
where RT is the ride time on the link, TP is the “transfer penalty” when changing the
transport system, nTP is the “transfer
penalty” for a specific type of node.
In the search for the shortest path,
transfer times between PuT stops are not considered
because specific PuT lines are not differentiated.
Transfers are simply viewed as a switch between different transport systems. In
the impendance function, transfers are regarded as a time
“penalty” during path searching, occurring only at specific nodes. The total
transfer time comprises a penalty for a particular node type and an additional
penalty for the transfer itself.
Links that are accessible to
multiple PuT systems with varying travel durations
have their minimum ride time established. The total demand for a specific
origin-destination pair is then assigned to the route with the least impedance.
Consequently, each passenger selects the route with the shortest travel
duration, irrespective of the existing PuT network or
schedules.
The Tsys-based
assignment exhibits the following characteristics [4]:
- it disregards PuT frequency and waiting times for transfers;
- frequent transfers between different transport systems are common;
- the travel time between two parallel routes within the same transport
system is averaged;
- journey times can only be estimated when there are short PuT headways;
- the number of transfers and the time spent during transfers cannot be
estimated.
The developer of the Visum software recommends the procedure of Tsys-based assignment as an effective method for
elaborating the model of a new route network. However, the Visum
user manual [4] underscores that this procedure cannot entirely substitute timetable
or HB assignments.
2.2. Headway-based assignment
The HB PuT
assignment procedure includes three operational steps.
1. Calculation of the headway of the
line.
2. Search and select a line.
3. Loading the line.
The line headway calculation can be
performed by the software in several ways:
a) from the
user-defined attribute of the time profile on the line route;
b) from the
average value of the headway according to the schedule on the line route;
c) from the
average waiting time according to the line route schedule.
For the third case, if the set of
departure times on the line Tl = {y1,
y2, …, yn} in the time interval l=[a,
b], the first departure after time b is denoted as y'. We
also consider a fictitious departure when the interval is extended by l
in the form of the dependence y'' = y1
+ (b-a). To calculate the waiting time at the end of period l,
we use the departure {y', y''}. The interval is calculated
according to the formula [4]:
![]() (2)
(2)
where ![]() is defined by
is defined by ![]() for all i ∈ {1, ...,
n-1}.
for all i ∈ {1, ...,
n-1}.
The
search and choice of a route (line) in the HB procedure consists of two stages:
- routes are evaluated in terms of their impedance (total cost);
- a choice model is used based on logistic regression.
The
impedance function includes the perceived journey time (PJT) and a component
that considers the fare or the share of fare points.
![]() (3)
(3)
where IMP is the indicator of an impedance, PJT is perceived
journey time, α, β – coefficients, FP – fare.
The impedance function is determined
using the following equation:
![]() (4)
(4)
where IVT is
the time spent in the vehicle, RIT is the
travel time between the initial and final stops, ACT is the walking time
to the initial stop, EGT is the walking
time from the stop to the final destination, WKT
is the total walking time, OWT is the waiting
time at the first stop, TWT is the
waiting time for a transfer, NTR is the
number of transfers, λ1 - λ8
are the coefficients of the impedance function.
Tab. 1 presents a comparison of the PJT components for which appropriate skim
matrices can be calculated for Tsys-based and HB
assignments [4]. The main distinction between the two procedures, as indicated
in Tab. 1, lies in the inclusion of waiting time at the initial stop and
transfer duration within the HB assignment method.
Tab. 1
Skims of time in PuT assignment procedures
|
Outcomes |
Notation |
Procedure |
|
|
Tsys-based |
Headway-based |
||
|
Journey ride time |
JRT |
+ |
+ |
|
Ride time |
RIT |
+ |
+ |
|
In-vehicle time |
IVT |
+ |
+ |
|
Run time with PuT Aux transport systems |
AXT |
+ |
+ |
|
Origin wait time |
OWT |
- |
+ |
|
Weighted origin wait
time |
WOWT |
- |
+ |
|
Transfer wait time |
TWT |
- |
+ |
|
Weighted transfer
wait time |
WTWT |
|
+ |
|
Access time |
ACT |
+ |
+ |
|
Egress time |
EGT |
+ |
+ |
|
Walk time |
WKT |
+ |
+ |
In the transport model of the city of Kryvyi Rih, the PJT parameter of impedance is as follows:
![]() (5)
(5)
When HB assignment is used, the
decision model for passengers choosing to board a vehicle assumes that their
behaviour is influenced by the information accessible to them. The software
provides four distinct models of passenger awareness, as described in
references [4, 19]:
- No information, where headways on routes adhere to an exponential
distribution law.
- No information but with constant headways on the lines.
- Information available regarding waiting time.
- Information available on the next departure time from the line stop.
In this paper, we consider the
second option as the one that best reflects the state of awareness of users of
the passenger transport system in Kryvyi Rih.
Let the set of available PuT lines be given by M = {1, ...,
n}. Each line i ∈ M is characterized by a specific travel time ti
≥ 0 and a travel interval hi > 0. The frequency of
movement on the line is defined by λi=1/
hi.
For simplicity, we further assume
that the lines are sorted in ascending order according to the remaining travel
time. Thus, the following expression applies t1
≤ t2 ≤ ... ≤ tn. The set of i-th
lines is encoded as follows: Mi =
{1, ..., i}. The
travel time ti means the total cost
of line i using, which includes the
components of impedance.
Based on the available information,
the choice model calculates the optimal set M*⊆ Mі and, for each line
i ∈ M*,
the demand shares di ≥ 0. The waiting time applied when
choosing any network M' before boarding is denoted as WL*,
and the corresponding costs are obtained from the following equation:
![]() (6)
(6)
These parameters are random
variables, as they depend on the random arrival of vehicles at the stops. For
the optimal set M*, the following condition is also satisfied with the
corresponding probabilities:
P(![]() ) ≤ P(
) ≤ P(![]() ) (7)
) (7)
for any value of M’⊆ M.
In the absence of information and a
constant headway, a passenger chooses the line that arrives first from the
optimal set of lines M* = Mi*.
The demand share for a particular
line is determined by the expression:
![]() (8)
(8)
where h/=
min {hi} is the minimum headway, and w is the waiting time.
Hence,
the probable waiting time is determined:
![]() (9)
(9)
where i* is the
optimal line.
Since i*= argmini{P![]() }, the
optimal route network consists of those lines that reduce the expected
remaining cost.
}, the
optimal route network consists of those lines that reduce the expected
remaining cost.
Apart
from the methods for PuT assignment, another crucial
aspect in evaluating the performance of the urban passenger transport network
is the calculation of PuT operating indicators. These
indicators enable the analysis of network links or specific lines in attribute
form.
3.
RESULTS
The
demand assignment for PuT was studied using a transport
model of the city of Kryvyi Rih,
which was developed in the Visum software.
The
passenger transport model consists of a network model and a 4-step transport
demand model. The network, in turn, includes 13 transport systems (bicycles,
cars, buses, light (two-axle), medium (two-axle) and heavy (three-axle,
long-haul) trucks, light rail, tram, trolleybus, taxi, suburban bus,
pedestrian, pedestrian walking to PuT), 7 transport
modes (bicycle, passenger car, light, medium and heavy truck, pedestrian and PuT), 27598 links, 10097 nodes, 83270 turns, 238 zones,
1748 connections for PrT, 3013 connections for PuT, 534 stops, 1165 stop areas, 1190 stop points, 130
lines and 218 line routes.
The
transport model contains 14 demand segments according to different travel
purposes. The sequence of calculation procedures included initialization, trip
generation and attraction procedures, travel cost calculation, assignment of
correspondences, mode selection, calculation of border area traffic,
combination of correspondence matrices, PrT
assignment, PuT assignment, blocking back model, and
assignment analysis.
The
travel costs between areas are computed by considering travel distance and the
impedance value, which varies based on different time components for distinct
transport modes. The distribution of correspondences across demand segments and
the mode choice were conducted utilizing the Kirchhoff function. Within the
passenger transport model, there are four modes, each associated with a
distinct demand segment, resulting in the calculation of 56 matrices for mode
choice.
The
modelling of assignment in the transport system of Kryvyi
Rih was carried out for one variant of the assignment
procedure for PrT (the Bi-conjugate Frank Wolfe) and
three variants of the assignment procedure for PuT.
The
following procedures were employed for PuT
assignment:
- HB approach - scenario 1.
- TSys-Based approach:
Applied to all links (connections), turns, and major turns in the
network graph (including road and rail links) - scenario 2.
Applied only to the links, turns, and major turns traversed by the
activated (existing) PuT lines - scenario 3.
Hence,
the assessment was conducted across three assignment scenarios within the
transportation system.
Comparing
the passenger flow maps generated through HB PuT
assignment (scenario 1) and TSys-based PuT assignment (scenario 2) across all links in the network
graph, alongside TSys-based PuT
assignment (scenario 3) for links with routes, enables us to pinpoint network
sections exhibiting significant changes in the analysed indicator.
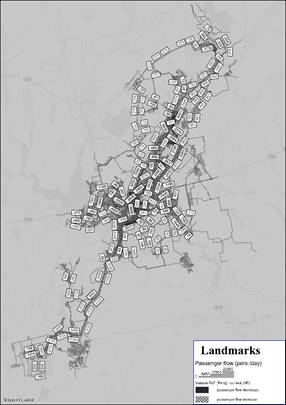
Here, an
“increase in passenger traffic” refers to a rise in passenger flow observed
with TSys-based assignment over HB (indicating
positive values on the cartogram). Conversely, a “decrease in passenger
traffic” denotes a decline in passenger flow observed with TSys-based
assignment compared to HB (manifesting as negative values on the cartogram, see
Fig. 1, Fig. 2).
Scenario
2, considering all links of the network graph to find the shortest route, is
characterized by the following features in the formation of passenger flows on PuT:
- a new route with the shortest route between the southern and northern
parts of the city is proposed along Het'mans'ka Street, where there is no PuT
in the current situation;
- transport link between Metalurhiinyi and Dovhyntsivskyi districts is
provided by a new section along Nikopolske shose Street;
- involvement of parallel streets (V. Gurova street) and bypass roads (Dovhyntsivskyi
district) in the use of PuT;
- increase passenger traffic on the city's main streets in Saksahans'kyi
and Pokrovskyi districts;
- decrease in passenger traffic on Universytets'kyi Avenue;
- increase in passenger traffic on Starovokzalna Street;
- increase in passenger traffic in the southern part of the city towards
the geographically separated districts of Pivdennyi GZK and Inhulets'kyi
district;
- decrease in passenger traffic on the high-speed tram lines.
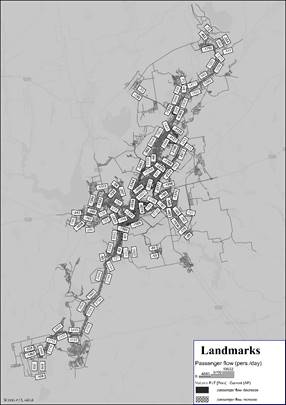
Scenario
3, considering the existing passenger transport network, differs in the PuT flow distribution from scenario 2. The main differences
between scenario 3 and scenario 1 are as follows. Reduced demand for PuT will be observed for the following streets: Ukrainska, Sviato-Mykolaivska,
and Shyrokivska Streets, Kobylianskoho
– Pisochna direction, Universytetskyi
Avenue, Dniprovske Shose
Street, Volonteriv Street and Spaska
Street, S. Rziankina Street. The streets experiencing
a decrease in demand for PuT include Kryvorizhstal Street, Metalurhiv
Avenue, V. Gurova Street, Sobornosti
Street, Kokchetavska Street, towards Pivdennii GZK and Inhulets'kyi district.
The
following features are common to scenarios 2 and 3:
- a significant increase in passenger traffic on the central (main) streets
of the city from south to north for Myru Avenue, V. Velykogo Street,
200th-richchia Kryvoho Rohu Avenue;
- decrease in passenger traffic on the streets of the historic part of the
city such as Ukrainska, Svyato-Mykolaivska;
- increase in passenger traffic on Kobylianskoho Street towards Nikopolske
Shose Street;
- decrease of passenger traffic on the main street of Universytetskyi
Avenue and further along Dniprovske Shose Street;
- increase in passenger traffic on parallel streets in the Metalurhiinyi
District;
- decrease in passenger traffic on the alternative route along Volonteriv
Street, including the exit to the central highway;
- decrease in passenger traffic bypassing the central highway through the
adjacent Zarichnyi and 129th neighbourhoods.
4. CONCLUSIONS
This study aimed to conduct a comparative analysis of modelling
outcomes using different PuT assignment procedures in
the Visum software, utilizing the transport model of
the city of Kryvyi Rih as
an example. In summary of the modelling results, the following conclusions can
be drawn.
|
|
|
|
Fig. 1. The differences in the PuT passenger flow values obtained from TSys-based (scenario 2) and HB PuT
assignment (scenario 1) |
Fig. 2.
The differences in the PuT passenger flow values
obtained from TSys-based (scenario 3) and HB PuT assignment (scenario 1) |
In the TSys-based PuT
assignment, the demand for PuT is primarily
concentrated along the main streets connecting various city districts from
south to north. This shift prioritizes road transport over rail public
transport, leading to decreased passenger flows on rail tram lines and their
corresponding links in the network graph. Consequently, the significance of
rail tram lines, serving as alternative routes in the historic city centre,
diminishes. Notably, there is an increase in demand along the main streets
leading towards the southern, isolated districts. Additionally, parallel
streets see increased utilization, especially in areas with a nearly
rectangular development layout. The connection between the central (Metalurhiinyi) and eastern districts (Dovhyntsivskyi)
is established through the shortest route. Furthermore, employing the shortest
path method implies that rather than circumventing high-rise neighbourhoods (Skhinyi-1, 2, 3), demand is anticipated for exit routes
from these neighbourhoods. Alternative routes, like those through streets
bypassing the central highway such as Volunteers Street, are largely
disregarded. However, when PuT assignment considers
all network links to find the shortest route, a notable difference in results
emerges significant passenger flow is redirected from the central highway to a
diagonal street, Het'mans'ka, which is frequently
utilized by PrT along the south-north axis of the
city.
Using TSys-based PuT
assignment allows for estimating the transport supply possibilities with the
existing demand for PuT without fully considering
many existing constraints to explore alternative solutions in the network. This
method is particularly valuable for sketch planning of new lines or routes.
However, the results of the PuT assignment for a real urban network demonstrate that the choice
of the shortest route in the TSys-based assignment,
closely tied to the central highway, can detrimentally impact residents of
districts distant from it in selecting alternative transportation options. This
could lead to an increase in the number of transfers required to maintain
accessibility to appropriate districts.
The utilization of the
investigative approach delineated in this paper may represent an initial stride
towards enhancing the PuT network through
the employment of appropriate transport modelling software.
References
1.
Jing
Dian, Enjian Yao, Rongsheng
Chen, Xun Sun. 2023. “Optimal Design Method of Public
Transit Network Considering Transfer Efficiency.” IET
Intelligent Transport Systems 17(6): 1118-36. DOI:
https://doi.org/10.1049/itr2.12349.
2.
2024.
Transport Analysis Guidance (TAG). TAG unit M3-2 public transport
assignment modelling, including forthcoming changes for May 2024. Department for Transport.
3.
2014.
JASPERS Appraisal Guidance (Transport). The Use of Transport Models in
Transport Planning and Project Appraisal.
4.
2024.
PTV VISUM User Manual. PTV Planung Transport Verkehr GmbH.
5.
Farahani Reza Zanjirani, Elnaz Miandoabchi, W.Y. Szeto, Hannaneh
Rashidi. 2013. “A Review of Urban Transportation Network Design Problems.” European
Journal of Operational Research 229(2): 281-302. DOI:
https://doi.org/10.1016/j.ejor.2013.01.001.
6.
Soares Philipp Heyken,
Leena Ahmed, Yong Mao, Christine L. Mumford. 2020. “Public Transport Network
Optimisation in PTV Visum
Using Selection Hyper-Heuristics.” Public Transport 13(1): 163-96. DOI: https://doi.org/10.1007/s12469-020-00249-7.
7.
Soares Philipp Heyken. 2020.
“Zone-Based Public Transport Route Optimisation in an Urban Network.” Public
Transport 13(1): 197-231. DOI: https://doi.org/10.1007/s12469-020-00242-0.
8.
Zhongyi Lin, Yang Cao, Huasheng
Liu, Jin Li, and Shuzhi
Zhao. 2021. “Research on Optimization of Urban Public Transport Network Based
on Complex Network Theory.” Symmetry 13(12): 2436. DOI:
https://doi.org/10.3390/sym13122436.
9.
Cats
Oded, Gert-Jaap
Koppenol, Martijn Warnier. 2017. “Robustness Assessment of Link Capacity
Reduction for Complex Networks: Application for Public Transport Systems.” Reliability
Engineering & Safety System 167: 544-53. DOI:
https://doi.org/10.1016/j.ress.2017.07.009.
10. Friedrich Markus, Thomas Haupt, Klaus Noekel. 1999. “Planning
and Analyzing Transit Networks: An Integrated
Approach Regarding Requirements of Passengers and Operators.” Journal of
Public Transportation 2(4): 19-39. DOI: https://doi.org/10.5038/2375-0901.2.4.2.
11. Horbachov Peter, Oleksandr
Makarichev, Olha Svichynska. 2022. “A New Route Choice Model for Urban
Public Transit with Headway-Based Service.” Periodica
Polytechnica Transportation Engineering 51(1): 22-30.
DOI: https://doi.org/10.3311/pptr.15864.
12. Eltved Morten, Otto Anker Nielsen, Thomas Kjær Rasmussen. 2019. “An Assignment Model for Public Transport Networks with Both Schedule-
and Frequency-Based Services.” EURO Journal on Transportation and Logistics
8(5): 769-93. DOI: https://doi.org/10.1007/s13676-019-00147-4.
13. Gentile Guido, Michael Florian, Younes Hamdouch, Oded Cats, Agostino Nuzzolo. 2016.
“The Theory of Transit Assignment: Basic Modelling Frameworks.” Modelling
Public Transport Passenger Flows in the Era of Intelligent Transport Systems
2016: 287-386. DOI: https://doi.org/10.1007/978-3-319-25082-3_6.
14. Orlando Victoria M., Enrique G. Baquela,
Neila Bhouri, Pablo A. Lotito. 2022. “Analytical
and Simulation-Based Estimation of Public Transport Demand.” Transportation
Research Procedia 62: 727-34. DOI: https://doi.org/10.1016/j.trpro.2022.02.090.
15. Tan Qian, Xiangdong
Zhou, Wusheng Liu. 2021. “Transit Assignment Modeling Approaches Based on Interval Uncertainty of Urban
Public Transit Net Impedance.” Tehnicki vjesnik - Technical Gazette 28(5): 1582-1589. DOI: https://doi.org/10.17559/tv-20210520044802.
16. Narayan Jishnu,
Oded Cats, Niels van Oort,
Serge Hoogendoorn. 2020. “Integrated Route Choice and
Assignment Model for Fixed and Flexible Public Transport Systems.” Transportation
Research Part C: Emerging Technologies 115: 102631. DOI:
https://doi.org/10.1016/j.trc.2020.102631.
17. Briem Lars, Sebastian Buck, Holger Ebhart, Nicolai Mallig, Ben
Strasser, Peter Vortisch, Dorothea Wagner, Tobias Zündorf.
2017. “Efficient Traffic Assignment for
Public Transit Networks.” In: 16th International Symposium on Experimental Algorithms
(SEA 2017): 20:1-20:14. 2017.
18. Kieu Le Minh. 2011. „ Public
transportation modeling in urban areas.” Master thesis. Norrkoping, Sweden:
Linköping University.
19. Ranceva Justina, Rasa
Ušpalytė-Vitkūnienė. 2024. “Specifics
of Creating a Public Transport Demand Model for Low-Density Regions: Lithuanian
Case.” Sustainability 16(4): 1412. DOI: https://doi.org/10.3390/su16041412.
20. Hildebrand Cisilia,
Stina Hörtin. 2014. „A
comparative study between Emme and Visum with respect to public transport assignment.” Master thesis. Linköping, Sweden:
Linköping University.
Received 20.05.2024; accepted in revised
form 20.07.2024
![]()
Scientific
Journal of Silesian University of Technology. Series Transport is licensed
under a Creative Commons Attribution 4.0 International License