Article
citation information:
Passarella, R., Nurmaini,
S., Rachmatullah, M.N., Veny, H., Ubaya, H., Firdaus, F. Data investigation of PK-LQP
airplane vertical deviation using class 1 and tier 1 datasets. Scientific Journal of Silesian University of
Technology. Series Transport. 2024, 124,
127-142. ISSN: 0209-3324. DOI: https://doi.org/10.20858/sjsutst.2024.124.9.
Rossi PASSARELLA[1],
Siti NURMAINI2,
Muhammad Naufal RACHMATULLAH3,
Harumi VENY4, Huda UBAYA5,
Firdaus FIRDAUS6
DATA
INVESTIGATION OF PK-LQP AIRPLANE VERTICAL DEVIATION
USING CLASS 1 AND TIER 1 DATASETS
Summary. The vertical deviation
is one of the important stages in commercial aircraft flights because
indications of malfunction can be detected faster by the pilot rather than in
other flight phases. The purpose of this study is to investigate whether the PK-LQP airplane experienced unusual altitude movements
during the vertical deviation phase since the airplane taking off from Seattle
(Boeing Manufacture's home base) until the airplane crash. The airplane, which
is of the type B737 MAX8,
had operated for 83 days, during which it completed 438 flights using a total
of 107 flight codes, and it travelled to 36 airports. According to the findings
of an investigation of the data, we found that only 69 (39%) were included in
tier 1, which had an ADS-B data update interval message below 10 seconds,
complying with ICAO and FAA-AVN
standards. With this class 1 and tier 1 dataset, we conducted an EDA to find
the data insight, which revealed that there was a disturbance in the speed and
altitude indications on the airplane instrumentation, causing a misperception
for the pilot and causing the airplane to drastically drop in altitude (more
than 100 feet).
Keywords: airplane accident investigations, ADS-B data
quality, message interval updates, vertical deviation phase
1.
INTRODUCTION
Aviation is a mode of transportation commonly
employed by people for holidays and business travels, with the main focus on
decreasing travel time. Thus, airplanes play a pivotal role in human society.
Since the Wright brothers' first machine-powered airplane in 1903, airplane
technology's speed, fuel economy, size, system and control, and safety have
been continually evolving [1]. Rather, the advancements in airplane
technology and the aviation sector have boosted airplane technology development
[2].
According to the IATA (International Air
Transport Association) [3], the aviation sector is growing yearly. Based on the
global traffic-schedule passenger reports for 2004-2021, the number of
passengers in 2004 was 1,994 million, and the number of passengers in 2019 grew
up to 4,543 million [4]. Despite the interruption caused by the spread of COVID-19 since 2020, examples include turnaround operations
following the post-pandemic [5], the management lessons learned by General
Aviation in Australia following a virus outbreak [6], and research on the
impact of the COVID-19 outbreak on the global airline
industry [7]. The growth rate of passengers using air transportation is 1.278,
or 128 percent, from 2004 to 2019, or an average of 8.522 percent/year, which
depicts one of the positive consequences of aviation safety and security measures.
The remarkable safety record of the aviation
industry in recent years is likely related to technological advancements that
were introduced and then improved throughout the second half of the 20th
century. Safety has become a global concern [8], [9]. Airplane safety is a
significant concern for this industry to achieve its goal [10]. The
manufacturer and other sectors need to follow many regulations before launching
commercial flights [11]. Thus, technology is deemed as the primary knowledge
field behind the formation of airplanes. Nowadays, technology often promises
safety by reducing human errors when operating airplanes by implementing
semi-autonomous or autonomous (autopilot) technologies, for instance, studies
on shared control between human pilots and adaptive autopilots [12], the behaviour of pilot patterns in autonomous driving [13], and
fly-by-wire technology [14] are examples. Furthermore, the aviation sector is
expected to apply new processes or integrate new facility designs within
airplanes [15].
One of the proposed changes is to replace
conventional radar with tracking technology using GPS (Global Positioning
System), namely ADS-B (Automated Dependent Surveillance-Broadcast System). The
ADS-B technology is one of the novel technologies proposed by the Next
Generation Air Transportation System (NextGen) in the
United States in 2005. NextGen is an FAA (Federal
Aviation Administration)-led modern agency to make air transportation
efficient, safer, and predictable. The FAA mandates all general aviation
airplanes to be equipped with ADS-B. Airplanes flying in the United States
below a transitional altitude of 18,000 feet are more likely to mount the ADS-B
UAT (Universal Access Transceiver). According to NextGen, the benefits of ADS-B implementation include its
facilitation of more frequent position update rates than radar, ensuring more
precise location information of airplanes. The second advantage relates to
in-cockpit traffic and weather information, and the third benefit includes
improved safety for pilots [16].
ADS-B is a technology for airplane monitoring
that is increasingly being employed in commercial aviation. The airplane
tracking system sends data related to the airplane's altitude, speed, heading,
and position to air traffic controllers (ATCs) and
flight information service providers (FISPs). This
data also contains a text display that shows information such as the time of
day, weather conditions, and the airplane's unique identifying number.
According to Meyer [17], ADS-B data can be a source of analytical solutions for
traffic behaviour in the airspace. Therefore, the
usage of flight history data produced by the ADS-B system can be used for the
investigation of airplane accidents. The experimental subject of this study is
a B737MAX8 airplane with the registration number PK-LQP that is registered in Indonesia.
After reviewing the National Transportation
Safety Committee (Komite Nasional Keselamatan
Transportasi-KNKT)
report and analysis of the PK-LQP accident [18], it
was evident that the pilot had reported problems in the phase of take-off,
initial climbing, and climbing (vertical deviation) with the plane's altitude
movements on October 28, a day before the fatal accident. The vertical
deviation is one of the important stages in commercial aircraft flights because
indications of malfunction can be detected faster by the pilot rather than in
other flight phases. Based on Boeing's official report, currently, the total
percentage of aircraft accidents from 1959 until 2020 is 23% of all fatal
accidents. In addition, the report also revealed that fatalities occurring
based on CICTT (the CAST/ICAO
Common Taxonomy Team) aviation occurrence categories on commercial jet fleets
from 2011 to 2020 were 694 out of 1775 events, or 39% and had occurred due to
loss of control factors in flights [19].
Therefore, we seriously considered the accident
summary report made by Boeing as the basis of our research. The fact that
commercial airplanes performing vertical deviation have a high percentage of
accidents raises the question of whether the PK-LQP
aircraft experienced unusual altitude movements during the vertical deviation
phase. Since the airplane taking off from Seattle (Boeing Manufacture's home
base) until the airplane crash. This also refers to the KNKT's
official report on the accident investigation, which states that there was a
disturbance in the information on the speed and altitude indication on the day
before the accident, especially in the vertical deviation phase.
To answer this question, we used the PK-LQP flight history data generated by the ADS-B
transponder stored on flightradar24 [20] on the
airplane to check all the flight data of PK-LQP and
ascertain if there were any oddities in altitude movements as reported on
October 28, 2018, and on the day of the ill-fated accident (October 29, 2018).
If it can be proven that there was an odd altitude movement during the vertical
deviation period outside the KNKT report based on the
pilot's report and FDR (flight data recorder), then this becomes new
information. Before utilizing the ADS-B data, we analysed
the data quality and selected the best data according to message interval data
for assessing the altitude of PK-LQP airplane
movements during the vertical deviation phase. This is done because the data
evaluated must be of high quality in order to maintain confidence in the study.
The organization of this paper is as described
below. The materials and method section discussing the data sources used and
the framework for answering the research objectives are presented in Section 2.
Thereafter, the results are discussed in detail in Section 3, while the
conclusions are presented in Section 4.
2.
MATERIAL
AND METHODS
This section explains the
applicability and usage of data. Data analysis and investigation methods are
applied, which include EDA (Exploratory Data Analysis), to generate data that
answers the research question objectively.
2.1. Material
In commercial operations (scheduled
passenger flights), the flight phase must follow a pre-set standard according
to CICTT. The flight phases include taxi, take-off,
initial climbing, climbing cruise, descent, and landing. Based on the
commercial flight phase standards and the advancement of ADS-B technology that
stores flight history data, we can trace the phase of flight that has been
executed by the airplane. The availability and quality of ADS-B data are the
keywords of the approach to analysing the flight
phase. If we know the stages through which the flight has passed, we might even
be able to find strange facts that were not covered in the KNKT
report.
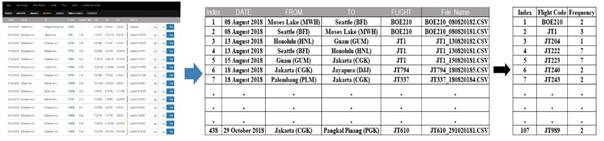
Fig 1. Experimental
materials for detecting anomalies in vertical deviation prior to the accident
flight: process of data collection and tabulation
The data used in the study came from
Flightradar24 [20], which is a web-based application
that stores flight data of PK-LQP in a *.CSV format
file, with a total volume of data stored for 438 flights. The next step is to
download the data one by one and save it on the local hard drive by naming the
file with a unique identifier, such as "JT795_220920186.csv", where JT795 is the flight route code, "22092018" is the
date of the flight, and "6" indicates that PK-LQP
has flown on that particular day. A unique identifier assignment is mainly done
to make the file identification process easier. The detailed process of
downloading and tabulating PK-LQP flight data can be
seen in Fig. 1.
Generally, each flight file (*.CSV
file) has a timestamp, callsign, position (latitude
and longitude), altitude, speed, and direction linked details. All flight
phases according to the commercial airplane, such as taxi, take-off, initial
climbing, climbing, cruise, descent, and landing, are recorded for each line in
the recorded data. Later, only the vertical deviation phase will be examined
from the whole flight data (raw data).
2.2. Methods
The methodology of this research
starts with downloading and tabulating the raw data, which is then separated
into three classes based on the ADS-B altitude value recorded during the
vertical deviation phase performed for each flight.
Based on the cause of the crash, as reported by KNKT
[18], there was a flight disturbance or alarm instrumentation in the flight
take-off and initial climb phase. Therefore, the separation of ADS-B flight
data based on altitude or flight phase needs to be done to see the facts.
Considering and assessing the ADS-B data quality, it is a reasonable assumption
that the ADS-B flight history data are comprehensive and can be used for
analysis and flight safety. The ADS-B altitude data was divided into three
classes based on the flight phase. Class 1 includes flight data that detect
altitude at 0 feet, also known as the taxi phase; Class 2 implies the initial
airplane detected during the take-off and initial climb phase (greater than 0
feet but less than 1000 feet), and Class 3 is the airplane detected altitude
during the climb phase (greater than 1000 feet).
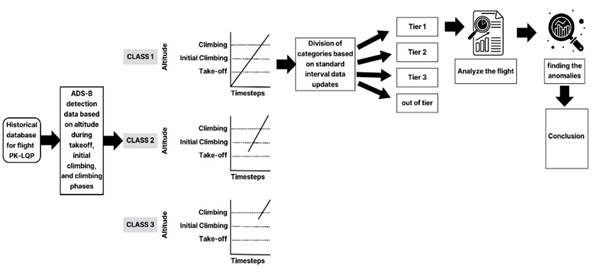
Fig. 2. The scientific
process used to find unusual vertical deviations from the past data ADS-B PK-LQP
The time interval between successive
position reports is defined as the interval update. This characteristic is
examined by gathering all timestamps from reports received on a single airplane
and determining the time difference between a row of
data. The taxi phase refers to the airplane being at an altitude of 0 feet or
equal to the airport surface. The take-off and initial climb phases are the
airplane's position at an altitude between 1–1000 feet [21], [22]. The climbing
phase is the process of raising an airplane to an altitude of more than 1000
feet above the airport surface and increasing the specified cruising speed and
altitude [23] [24]. The Python programming language was used to separate the
data into three groups and visualization of data using Scimago
Graphica [25].
The first class was grouped for flight data starting from altitude 0 at the departure airport (X0= 0), indicating the completion of the taxi phase. The second class was the flight data grouped for altitudes above 0 feet to greater than or equal to 1000 feet (0<X0≤1000); this data group showed that the transponder was turned-on and detected when the airplane was in the take-off phase and initial climbing. The third class collected data from an altitude above 1000 feet (X0>1000), meaning that the airplane’s transponder data was detected during the climbing or cruise phases. Furthermore, once the raw data has been separated by class, the next step is to investigate the data in class 1. The data in class 1 is analysed again to receive good flight data according to predetermined standards. This division is based on the message quality tier of the ADS-B update interval. After separating by tier, the best quality ADS-B flight data points will fall under tier 1. Thereafter, this data will be further analysed to get insight into the abnormal altitude changes in the vertical deviation phase. In other words, we examine the interval update data quality with a focus on class 1. Afterward, flight data that satisfy the international civil aviation organization (ICAO) requirements for interval update data quality in class 1 will be examined to detect any abnormalities. The process is depicted in Fig. 2.
3.
RESULTS
AND DISCUSSION
PK-LQP was a Boeing 737 MAX 8 airplane
with serial number 43000 LN: 7058 using 2 x CFMI
LEAP-1B engines. This airplane was manufactured in
2018 with a certificate of airworthiness issued on August 15, 2018, valid until
August 14, 2019. Since its dispatch from the factory, the airplane completed
895 hours and 21 minutes of operation with 443 engine cycles [18].
The airplane served 438 commercial
flights for 83 days with 107 flight codes and 36 departure airports. The
airplane had made an average of 145 flights per month. This airplane was
operated by an Indonesian airline, serving domestic and international passenger
flights. PK-LQP was the 10th airplane received by
Indonesian Airlines on August 16, 2018. It was part of the historic commitment
order made by Lion Air Group for 201 units of 737 MAX airplanes on November 17,
2011 [26], [27]. PK-LQP had an OEM (Original
Equipment Manufacturer) amended ADS-B Out type certification, ensuring that the
Boeing airplane was compliant with FAA and EASA
(European Union Aviation Safety Agency) requirements. The 737 MAX model uses a
certified ATC (Air Traffic Control) transponder DO-260B
[28].
A flight link map was obtained based
on PK-LQP's historical record data of its operation
spanning from August 8, 2018, to October 29, 2018. A connection map is a graph
of node-airport relationships with geospatially positioned nodes. The
relationship between nodes refers to departure and arrival (flow map). Fig. 3
depicts the airport connectivity map that PK-LQP
generated. According to the studied data, from the 438 flight records of PK-LQP, 11 international commercial flights have been
completed, and 427 flights were domestic flights. In other words, 98.6 percent
of this airplane's flights were operated within Indonesian airspace.
After the 438 flight data points
have been viewed, the next step is to view each flight data point, which
contains timestamps, time, GPS, altitude, speed, and direction. This data was
obtained from ADS-B. But before that, it must first be ensured that the quality
of the recorded ADS-B signal is good enough.
According to a document from the
International Civil Aviation Organization Asia and Pacific Office [29], there
are five things that must be taken into account when implementing and operating
ADS-B to monitor its performance: The percentage of an airplane with good
integrity reports; ADS-B horizontal position accuracy (based on reference
sensors); the difference between geometric and barometric altitude; the number
of position jumps; and message interval update. In this study, we monitor the
performance of ADS-B data based on the message interval update.
ADS-B transmits data signals from an
airplane. These data messages are transmitted at intervals of roughly 0.5
seconds and received by compatible ground stations. In particular, ICAO determines the standard for the update of ADS-B
airplane parameters, as presented in Tab 1 [29]. Meanwhile, according to Thomas
& DiBenedetto [30], the FAA Office of Aviation
System Standards (AVN) sets the ADS-B TIS-B (Traffic
Information Services-Broadcast) Verification Update Interval to less than 12.1
seconds. This difference does not reduce our enthusiasm for investigating the PK-LQP ADS-B data's quality. As a result, for the purpose
of this investigation, we decided to adopt the parameters that have been
established by the ICAO because the data update time
employs a short range of pauses, which increases the likelihood that the
position of the airplane will be identified. Additionally, we have introduced
one category, which is known as “out of tier.” This category indicates that the
ADS-B data that is sent from airplanes and received by the ground station is
delayed by more than sixty seconds (1 minute).
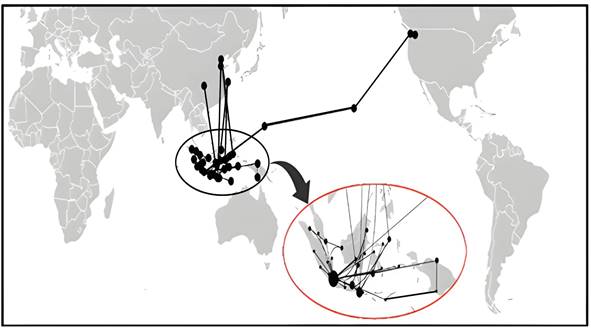
Fig. 3. Historical PK-LQP connection map based on departure and arrival
airports covered
Tab. 1
Baseline ADS-B service
performance parameter
|
Parameter |
Guidance Interval (x) |
Tier 1 Seconds |
Tier 2 Seconds |
Tier 3 Seconds |
Out of Tier Seconds |
|
Airplane updates |
Recommended |
0.5 < x < 5 |
0.5 < x < 20 |
0.5 < x < 60 |
x > 60 |
|
Maximum |
0.5 < x < 10 |
- |
- |
- |
To evaluate the raw data set (n =
438) as indicated in Fig. 4(A), it is necessary to divide the data into three
classes in accordance with the intended method (Fig. 2). We employed the Python
programming language to make the process more efficient. As a result, grouping
was simpler for us because the flight data point corresponds to the file name
data, which already has a unique identifying name. The data point plot was
divided into three classes, as indicated in Fig. 4(B), which were then
segregated based on the average message update interval data (Tier), resulting
in the data visualization depicted in Fig. 4(C). The following phase focuses on
the data in class 1, which is then plotted as a histogram. The resulting
histogram data are displayed in Fig. 4(D). This is done to display the
frequency (number of occurrences) of class 1 data points.
According to the histogram plot of
the data in Fig. 4(D), there are 179 flight data in class 1 (41% of the raw
data set). When we dig deeper into class 1, we discover that 69 flights, or 39%
of the 179 flights, fall into category 1 (tier 1), with an average message data
interval update of 0.5 seconds to less than 10 seconds. The entire tier 1 data
for these 69 class 1 flights yielded an average value of 9.46 seconds.
According to Tab 1, this average value indicates that this data tier 1 is not
included in the recommendation guidance but is included in the maximum guidance
data for the ADS-B update for airplanes. However, we conclude that these tier 1
data can still be utilized for additional in-depth study. Furthermore, this
average number is below the FAA-AVN standard of fewer
than 12.1 seconds.
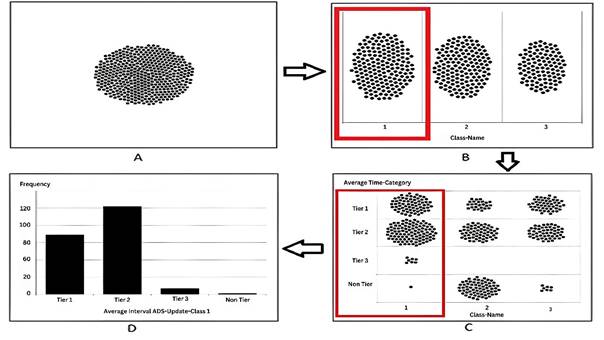
Fig 4. Data processing: analysis
of ADS-B insight data from historical PK-LQP flights:
A. Unprocessed Information: the total number of
flights recorded (438 flights);
B. Distribution of data points per class for
identifying altitude at take-off;
C. Data by class in a histogram graphic for
determining take-off starting altitude;
 D. Distribution of
data points by average level tier (data update interval) and altitude detection
class at take-off
D. Distribution of
data points by average level tier (data update interval) and altitude detection
class at take-off
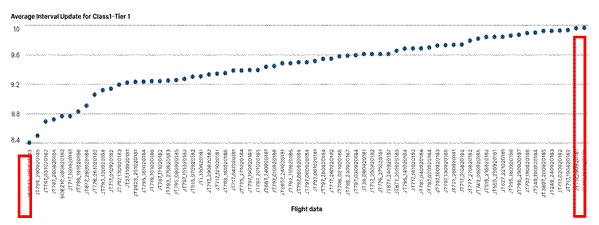
Fig. 5. The distribution data point of class 1 with tier 1 message
interval updates according to data flight name
With just 69 flight data points (16%) of the raw
data for 438 flights included in tier 1 data, we believe that the ensuing
analysis will not be able to detect 100% of the altitude anomalies in the
vertical deviations of the PK-LQP airplane, but we
believe that the manoeuvring characteristics augmentation system (MCAS) and AoA (angle of attack-sensor) disturbances as reported by KNKT can be discovered in 16% of these data. 16% of this
data is therefore spread to illustrate the distribution of the average ADS-B
update interval and order from the shortest to the longest average update
interval, as shown in Fig. 5
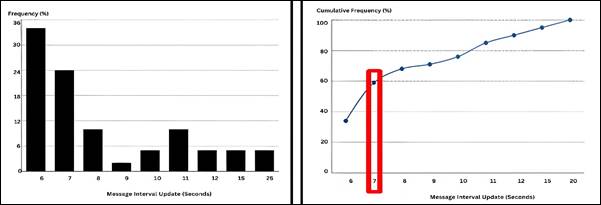
Fig. 6. The data insight of JT2622_261020183:
the plot of percentage of frequency versus message interval update and the plot
of percentage of cumulative frequency versus message interval update
Fig. 5 depicts a distribution from
which we sampled the shortest and longest values. The shortest sample has the
minimum average update interval value (JT2622_261020183
with 8.4 seconds), whereas the longest sample has the maximum update interval
value (JT797_190920185 with 9.9 seconds). From these
two samples, the data is examined in greater detail to determine the quality of
the data and to provide the representation of data analysis.
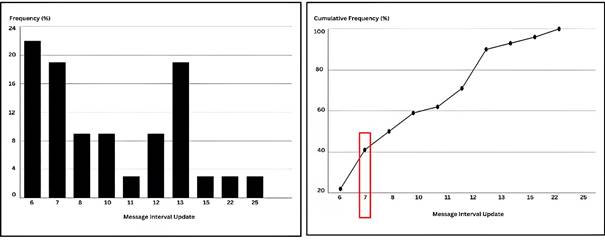
Fig 7. The data insight of JT797_190920185:
the plot of percentage of frequency versus message interval update and the plot
of percentage of cumulative frequency versus message interval update
The histogram plot
(Fig. 6) of the update interval time of the recorded ADS-B messages shows that
34% of JT2622_261020183 of the vertical deviation
data is distributed at a 6-second update interval time. Meanwhile, the
cumulative frequency distribution shows that airplane PK-LQP
contributed 59% of all places claimed to have an update every 7 seconds.
According to these explanations and observations, update intervals will be
increased in areas with poor reception of airplane ADS-B data. This claim is
identical to the one made by Verbraak [31].
If we examine the
flight data with the highest data interval in Fig. 7, we can see that the
frequency of occurrence of message update intervals for 6 seconds is 22%, while
the cumulative frequency distribution shows that 41% of the data is updated
every 7 seconds. Therefore, the difference in message interval update duration
between JT2622_261020183 and JT797_190920185
for 6 seconds is -12.2% (minus indicates a decrease) from the shortest to the
longest span data point in tier 1 at class 1, and the duration of the 7-second
update interval message demonstrates a disparity of -18%.
The FAA requires
pilots to avoid losing more than 100 feet of altitude during manoeuvres in
vertical deviations [32]-[34]. This is because the movement of airplanes,
especially commercial airplanes, when taking off and manoeuvring in the air,
must maintain the stability of the plane and the passengers it carries. If
there is a manoeuvring movement in this position, the airplane loses 100 feet
in less than 10 seconds, causing passenger discomfort and air pressure
disturbances in the cabin. From the history data of PK-LQP,
totalling 438 flights, we focused on class 1 data.
Tab. 2
Flight data for JT43_281020182
from 0 to 10000 feet altitude
|
Timestamps |
Altitude (feet) |
Speed (knots) |
Direction (degree) |
Altitude gap (feet) |
Message Interval Update |
|
1540736503 |
0 |
171 |
87 |
0 |
0 |
|
1540736509 |
175 |
172 |
87 |
1 |
6 |
|
. |
. |
. |
. |
. |
. |
|
. |
. |
. |
. |
. |
. |
|
. |
. |
. |
. |
. |
. |
|
1540736559 |
1575 |
190 |
90 |
50 |
7 |
|
1540736580 |
1350 |
234 |
86 |
-225 |
21 |
|
1540736586 |
1525 |
242 |
86 |
175 |
6 |
|
. |
. |
. |
. |
. |
. |
|
. |
. |
. |
. |
. |
. |
|
. |
. |
. |
. |
. |
. |
|
1540736721 |
5550 |
282 |
88 |
725 |
18 |
|
1540736742 |
4850 |
307 |
90 |
-700 |
21 |
|
1540736748 |
4625 |
324 |
90 |
-225 |
6 |
|
1540736773 |
5400 |
303 |
87 |
775 |
25 |
|
. |
. |
. |
. |
. |
. |
|
. |
. |
. |
. |
. |
. |
|
. |
. |
. |
. |
. |
. |
|
1540736960 |
9800 |
335 |
1 |
75 |
6 |
In class 1, which
consists of 179 flight data points, there are three tiers of average message
interval updates: 69 data points in tier 1, 102 in tier 2, and 8 data points in
tier 3. Then, we search for altitude data demonstrating the airplane's altitude
loss throughout the vertical deviation (0–10,000 feet) in each tier. In the
results obtained, we did not find an altitude drop of more than 100 feet during
the vertical deviation phase on 69 flight data in tier 1. While on 102 data
flights in tier 2, we found one flight data that experienced an altitude drop,
namely flight JT43_281020182. This flight flew from
Denpasar (DPS) to Jakarta (CGK) and was the last
flight on October 28, 2018. Only 2 flights, namely JT775_281020181
and JT43_281020182, were detected to have been
operated on this date according to the PK-LQP data.
In the PK-LQP
accident report, it was explained that flight JT775_281020181
was reported by the pilot to have experienced interference with airspeed and
altitude indications. When the JT775 airplane landed
safely in Denpasar, further action was taken by ground maintenance teams to
replace the AoA sensor and conduct an installation
test in accordance with the procedure. When the airplane was declared
airworthy, it completed flight JT43. On this flight,
the airplane successfully landed in Jakarta, but the pilot reported that the
airplane had problems with "IAS and ALT Disagree shown after
take-off" and "FEEL DIFF PRESS light illuminated." This causes
abnormal movement or behaviour of the airplane in vertical deviations. Trace
data from this anomaly can be detected with our approach, which found altitude
drop data of more than 100 feet, namely 225 feet to 775 feet, at several
altitude points. Evidence of an altitude drop is shown in Tab 2. To get a
detailed view, we visualized the flight data of JT43_281020182
in 3D, as shown in Fig. 8(A).
As illustrated in Fig 8(A),
according to the data, the PK-LQP airplane's altitude
first dropped by 225 feet as detected by ADS-B data at the 77th second or about
1 minute 29 seconds after take-off from Denpasar airport. This altitude drop
occurred again 162 seconds later at an altitude of 5550 feet. In just 21
seconds, the plane dropped 700 feet. This 3D visualization is based on the data
given in Tab 2, which also shows that the airplane lost cruising altitude in a
speed position that increased by 25 knots (307 knots to 282 knots), or the
equivalent of 12.9 meters per second. Meanwhile, the airplane was not in a
turning position because the data shows only a 2-degree change in direction. We
believe that the pilot received incorrect information from the onboard data instrumentation about its speed and altitude
position, so the pilot attempted to control and reposition the airplane, which
resulted in an anomalous movement in the phase vertical deviation. Despite JT43_281020182 flight disturbances based on the data
insight and KNKT report, the airplane made a
successful landing at the airport in Jakarta (CGK).
After examining the data from
class 1 in tiers 1 and 2, the final stage was to examine the information from
tier 3. We followed the same procedures on the tier 3 flight data as we did on
tier 1 and tier 2 flight data, although we did not discover any substantial
altitude loss (more than 100 feet).
For further conviction, we
also visualized the data from the day of the accident, that is, October 29,
2018, from the Jakarta to Pangkal Pinang flight with
flight code JT610. In our dataset, this flight is
stored in the file JT610_291020181.csv, and based on our approach, this data is
included in class 2. Since the flight data began to be detected at an altitude
of 350 feet with an average ADS-B message update of 12.5 seconds, it is
included in tier 2. The JT610 flight visualization
image is shown in Fig. 8(B). Based on the results of the 3D plot visualization,
flight JT43 experienced only 3 times loss of altitude
of more than 100 feet (Fig. 8(A)), while flight JT610
indicated 10 instances of the plane losing more than 100 feet of altitude until
the plane fell into the Java Sea (Fig. 8(B)).
|
JT43_281020181 |
JT610_291020181 |
|
A |
B |
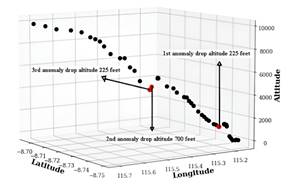
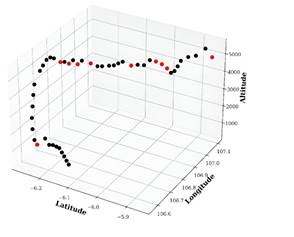
Fig. 8. Data point visualization between two flight concerns:
A. Vertical deviations phase 3D plot for JT43_281020182
data;
B. Vertical deviations phase 3D plot for JT610_291020181
data
To gain more certainty, we
performed 2 sample 3D plots for flight data that are in class 1 and are
included in the message interval update in tier 1. These two flights are JT775_271020184 and JT877_240920187,
as shown in Fig. 9. From these two plots, it is clear that when an airplane
makes a vertical deviation, the position of the airplane, which is shown by the
detected point, does not lose the predetermined altitude, even if the airplane
moves in the direction of flight, which means that its latitude and longitude
change.
|
|
|
|
JT775 |
JT877 |
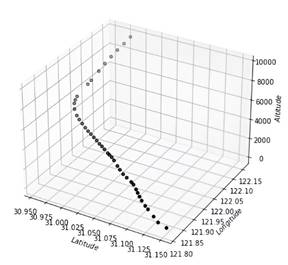
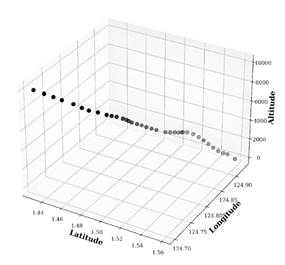
Fig. 9. Sample flight data from Class 1 tier 1 that did not experience
an altitude loss of more than 100 feet in the vertical deviation phase
The research's findings
demonstrate that ADS-B data can serve as a preliminary analysis for aircraft
accidents or as a preventive measure to avoid similar incidents in the future.
ADS-B data can be used to analyse an airplane accident or prevent future incidents
involving the Boeing B737 MAX 8. This research
demonstrates the closeness of ADS-B data to actual events. This validates the
studies conducted by [35] that validate ADS-B position data.
The obtained results also
demonstrate that accident investigators, during the process of searching for
the black box, can analyse flight data during the
incident or historical data to identify traces of a system failure influencing
changes in altitude, flight direction, or speed. This initial analysis will
provide an opening for the accident investigator to understand what happened.
However, the final analysis must refer to the voice recorder and other box
data. Furthermore, according to the research reported by [36] in his report,
the establishment of an obligation for each aircraft to install and turn on the
ADS-B transmitter has led to a very significant reduction in accidents by 89%.
These findings are in line with the concept of using more ADS-B data for
preventive purposes.
4.
CONCLUSION
According to the findings of
an investigation of the data, the PK-LQP airplane,
which is of the type B737 MAX 8, had operated for 83
days, during which it completed 438 flights using a total of 107 flight codes,
and it travelled to a total of 36 airports. We categorized these 438 data
points into one of the three classes based on the initial altitude detection
provided by the ADS-B data. Class 1 contains the most valuable information. The
amount of data collected in class 1 is 179 (41%). From the results of the
in-depth examination of class 1 data, we found that only 69 (39%) were included
in tier 1, which had an ADS-B data update interval message below 10 seconds,
complying with ICAO and FAA-AVN
standards. While for tier 2, there are 102 (59%) update interval messages below
20 seconds, and the last is tier 3, for below 60 seconds, as many as 8 (4%).
With this class 1 and tier 1
dataset, we conducted an EDA to find the data insight, which revealed that
there was a disturbance in the speed and altitude indications on the airplane
instrumentation, causing a misperception for the pilot and causing the airplane
to drastically drop in altitude (more than 100 feet). The trace of this
abnormality should be visible in the ADS-B data record.
As a result, we discovered
abnormal data in class 1 data, specifically JT43_281020182.
According to ICAO regulations, this data is included
in tier 2; however, FAA-AVN includes the JT43 281020182 flight data in its standard (below 12.1
seconds). Thus, this is consistent with the KNKT's
conclusions, which allege that on the day before the accident of flight JT43 281020182, there were anomalies in the speed and
altitude indicators in the vertical deviations phase based on the pilot's
written report.
Aside from flight JT43_281020182, we found no indicators of anomaly detection
in class 1 data; however, data in classes 2 and 3 were not evaluated because
the stored ADS-B data could not be processed as it did not meet ICAO or FAA-AVN criteria. As a
result, we can state that the analysis has a 41% confidence level. This
proportion is determined by the amount of data examined, which is the total
class 1 data divided by the total number of flights (438).
Based on the findings of this
study, we believe that with the improvement in ADS-B technology and the
increase in the number of ground station receivers, the message update interval
will be reduced, and all flight data will be class 1 and tier 1. If this is
done, we think that in the future, ADS-B data, along with data from the FDR on
the black box, can be used as a second opinion while investigating an incident
involving a commercial airplane.
Acknowledgment
The research/publication of
this article was funded by DIPA of Public Service
Agency of Universitas Sriwijaya
2024. Number SP DIPA 023.17.2.677515/2024, On
November 24, 2023. In accordance with the Rector's Decree Number: 0013/UN9/LP2M.PT/2024, On May 20, 2024.
References
1
Federal Aviation Administration. 2016. Pilot’ s Handbook of Aeronautical Knowledge.
2
Bowen Jhon. 2019. Low-cost carriers in emerging
countries. Elsevier. ISBN: 9780128113943. DOI: https://doi.org/10.1016/C2016-0-01658-3.
3
IATA. „International Air Transport Association
Annual Review 2020”. 76th Annu. Gen. Meet.
Available at: https://online.fliphtml5.com/uzvev/hfuf/?_cldee=MTQzNTg1NDk5NUBxcS5jb20%3D&recipientid=contact-3499a7a1cc88e711810be0071b6ea591-89269a2310ba4125810decaa62f1de8b&esid=ee9bde04-ffbc-ea11-a812-000d3a49dd7d#p=1.
4
Statista Research Department. „Global air
traffic - scheduled passengers 2004-2021”. Available at: https://www.statista.com/statistics/564717/airline-industry-passenger-traffic-globally/.
5
Schultz Michael, Jan Evler, Ehsan Asadi, Henning
Preis, Hartmut Fricke, Cheng-Lung Wu. 2020. „Future aircraft
turnaround operations considering post-pandemic requirements”. Journal of Air Transport
Management 89: 101886. DOI: https://doi.org/10.1016/j.jairtraman.2020.101886.
6
Tisdall Lucas, Yahua Zhang. 2020. „Preparing for
‘COVID-27’: Lessons in management focus – An Australian general aviation
perspective”. Journal of Air Transport Management 89: 101922. DOI: https://doi.org/10.1016/j.jairtraman.2020.101922.
7
Maneenop Sakkakom, Suntichai Kotcharin. 2020. „The impacts of
COVID-19 on the global airline industry: An event study approach”. Journal of Air Transport
Management 89: 101920. DOI: https://doi.org/10.1016/j.jairtraman.2020.101920.
8
Blalock Garrick, Vrinda Kadiyali, Daniel H. Simon
.2007. „The
impact of post-9/11 airport security measures on the demand for air travel”. Journal of Law and Economics 50(4): 731-755. DOI: https://doi.org/10.1086/519816.
9
Kondrasuk Jack N. 2004. „The effects of
9/11 and terrorism on human resource management: Recovery, reconsideration, and
renewal”. Employee Responsibilities and Rights Journal 16(1): 25-35. DOI: https://doi.org/10.1023/B:ERRJ.0000017518.06989.85.
10 Stamford Krause Shari. 2003. Aircraft
Safety. McGraw-Hill. DOI: https://doi.org/10.1036/0071433937.
11 FAA Flight Standards Service.
2016. „Aircraft
Performance & Specifications”. Available at: https://www.faa.gov/regulations_policies/handbooks_manuals/aviation/phak/media/13_phak_ch11.pdf.
12 Farjadian Amir B., Annaswamy Anuradha
M., Woods David. 2017. „Bumpless Reengagement Using Shared Control
between Human Pilot and Adaptive Autopilot”. IFAC-PapersOnLine 50(1): 5343-5348. DOI: https://doi.org/10.1016/j.ifacol.2017.08.925.
13 Trösterer Sandra, Alexander
Meschtscherjakov, Alexander Mirnig, Artur Lupp, Magdalena Gärtner, Fintan
McGee, Rod McCall, Manfred Tscheligi, Thomas Engel. 2017. „What we can
learn from pilots for handovers and (de)skilling in semi-autonomous driving: An
interview study”. In: AutomotiveUI 2017 - 9th International ACM
Conference on Automotive User Interfaces and Interactive Vehicular Applications: 173-182. DOI: https://doi.org/10.1145/3122986.3123020.
14 Yeh Y.C. 1998. „Design
considerations in Boeing 777 fly-by-wire computers”. Proc. – 3rd IEEE Int.
High-Assurance Syst. Eng. Symp. HASE: 64-72. DOI: https://doi.org10.1109/HASE.1998.731596.
15 Desai Prathamesh S., Nihar Sawant,
Andrew Keene. 2021. „On COVID-19-safety ranking of seats in
intercontinental commercial aircrafts: A preliminary multiphysics computational
perspective”. Build Simulation. 14(6): 1585-1596 DOI: https://doi.org/10.1007/s12273-021-0774-y.
16 FAA. 2020. „Next Generation
Air Transportation System (NextGen)”. Available at: https://www.faa.gov/nextgen.
17 Chenyu Huang. 2017. „Applying the
ADS-B Out to Facilitate Flight Data Analysis for General Aviation”. PhD Dissertation. Faculty of Purdue
University. School of Aviation and Transportation Technology. Available at: https://docs.lib.purdue.edu/open_access_dissertations/1566.
18 KNKT. 2019. „FINAL
KNKT.18.10.35.04 Aircraft Accident Investigation Report”. Available at: https://www.aaiu.ie/sites/default/files/FRA/2018%20-%20035%20-%20PK-LQP%20Final%20Report.pdf.
19 Boeing. 2021. „Statistical
summary of commercial jet airplane Accidents: Worldwide Operations 1959-2020”. Available at: https://www.boeing.com/resources/boeingdotcom/company/about_bca/pdf/statsum.pdf.
20 Flightradar24. 2022. „How flight
tracking works”. Available at: https://www.flightradar24.com/how-it-works.
21 FAA. 2021. Airplane flying
handbook. (FAA-H-8083-3c). Flight Sta. United States
Department of Transportation. Available at: https://www.faa.gov/regulations_policies/handbooks_manuals/aviation/airplane_handbook.
22 Cashman John E., Brian D. Kelly, Brian N. Nield. 2000. „Operational uses
of angle of attack on modern commercial jet airplanes”. Aero Boeing 12.
Available at: https://www.boeing.com/commercial/aeromagazine/aero_12/attack.html.
23 Sadraey Mohammad H. 2017. Aircraft
Performance: An Engineering Approach. ISBN: 9781498776585.
CRC Press.
24 Goblet Valentine Pascale. 2016. „Phase of flight
identification in general aviation operations”. Master of Science in Aeronautics and Astronautics. Purdue
University. Available at: https://docs.lib.purdue.edu/open_access_theses/772.
25 SCImago. 2022. „Viz tools-scimago
graphica”. Available at: https://www.scimagojr.com/viztools.php.
26 Saragih H.P. 2018. „Lion Air has 10
Boeing 737 Max 8, most in Asia”. CNBC Indonesia. Available at: https://www.cnbcindonesia.com/news/20181029102911-4-39420/lion-air-punya-10-boeing-737-max-8-paling-banyak-di-asia.
27 Boeing. 2011. „Boeing, Lion Air
Announce Historic Commitment for up to 380 737s”. Available at: https://boeing.mediaroom.com/2011-11-17-Boeing-Lion-Air-Announce-Historic-Commitment-for-up-to-380-737s.
28 Boeing. 2019. „ADS-B OUT
CERTIFICATION-The Future of Avionics Is Built Here”. Available at: http://www.boeing.com/commercial/services/adsb-out-certification.page.
29 ICAO ASIA and Pacific Office.
2021. „ADS-B Implementation and Operations Guidance Document. Edition 14.0”.
Available at: https://www.icao.int/APAC/Documents/edocs/Revised ADS-B Implementation
and%0A Operations Guidance Document (AIGD) Edition 14.pdf %0A.
30 FAA. 2008. „Review of the
Automatic Dependent Surveillance-Broadcast (ADS-B) system and development of
ADS-B flight inspection requirements, methodologies, and procedures”. Technical
memorandum OU/AEC 08-09TM15689/0007-1.
31 Bonifazi Alberto, Junzi Sun, Gerben van
Baren, Jacco Hoekstra. 2021. „Modeling and
Detecting Anomalous Safety Events in Approach Flights Using ADS-B Data”. Fourteenth USA/Europe Air
Traffic Management Research and Development Seminar (ATM2021). Available at: http://resolver.tudelft.nl/uuid:fc0b5739-0cf2-403a-a6f1-6f9e1b9dd4e8.
32 Federal Aviation Administration. 2013. „Takeoffs and
Departure Climbs”. FAA-H-8083. Available at: https://www.faa.gov/regulations_policies/handbooks_manuals/aviation/airplane_handbook/media/07_afh_ch5.pdf.
33 Guthrie Joseph. A. 1974. „Report
number: AFFTC-TIH-74-2. Stability and control Volume I of II stability and control
flight test techniques”. California. Available at: https://apps.dtic.mil/dtic/tr/fulltext/u2/a011561.pdf.
34 FAA. 2019. „Basic Flight
Maneuvers, Helicopter Fly
Handbook”. Available at: https://www.faa.gov/regulations_policies/handbooks_manuals/aviation/helicopter_flying_handbook/.
35 Dy Luigi Raphael I., Mott John H. 2022. „Validating ADS-B
Data for Use in Noise Modeling Applications”. Collegiate Aviation Review
International. 40(2): 19-32. DOI: https://doi.org/10.22488/okstate.22.100214.
36 Collins Mike. 2019. „With ADS-B in,
Data could lead to more ground station”. AOPA. Available at: https://www.aopa.org/news-and-media/all-news/2019/april/18/study-shows-accidents-less-likely-with-ads-b-in.
Received 10.03.2024; accepted in revised
form 30.05.2024
![]()
Scientific
Journal of Silesian University of Technology. Series Transport is licensed
under a Creative Commons Attribution 4.0 International License