Article
citation information:
Matyja, T. Determining the optimal
number of stretch film layers for ensuring palletized cargo stability: a
simulation study. Scientific Journal of Silesian University of
Technology. Series Transport. 2024, 124,
93-108. ISSN: 0209-3324. DOI: https://doi.org/10.20858/sjsutst.2024.124.7.
Tomasz MATYJA[1]
DETERMINING
THE OPTIMAL NUMBER OF STRETCH FILM LAYERS FOR ENSURING PALLETIZED CARGO
STABILITY: A SIMULATION STUDY
Summary. Numerical simulation
tests were carried out to determine the influence of the characteristic
features of a load unit (such as: weight, height, number of load layers,
coefficient of friction between the layers) per number of wraps with stretch
film necessary to ensure unit stability. Manufacturers of stretch film
sometimes provide guidelines on how many layers of film should be used
depending on the weight and height of the load. But they do not explain on the
basis of which studies these values were determined. Performing simulations
similar to those made in this work in laboratory conditions would be very
expensive. The work attempts to determine such relationships by simulation
methods. A developed by the author in his earlier works dynamic model of a
layered cargo unit wrapped with stretch film was used. The study plan was to
check 108 cases. On the basis of the collected data, an attempt was made to
develop a mathematical formula that would allow to estimate the optimal number
of foil wraps when certain parameters of the load unit are known. In the
author's opinion such an estimate could reduce film consumption, which would
have a positive impact on the environment.
Keywords: palletized cargo, stretch film, dynamic model, linear
regression
1. INTRODUCTION
Goods are commonly transported in
the form of pallet loading units. A
properly protected loading unit, secured against disintegration and excessive
deformation, guarantees the safety of transport operations. During transport,
the load is exposed to short-term pulses of inertia forces and vibrations,
which may lead to the movements of packages forming a pallet unit relative to
each other and relative to the pallet in the cargo space of the vehicle [3, 9,
15]. Under certain circumstances, this may lead to excessive deformation of the
load unit, its disintegration or damage to the goods. The possible effect of
such events is not only the loss of value of commercial goods, but also a
danger in vehicle traffic.
A common and inexpensive method of
securing a pallet load unit against excessive packaging movement is to wrap it
with pre-stretched stretch film. The so-called stability (or stiffness) of the
load unit [6] is primarily ensured by the containment force [2] obtained by appropriately
pre-stretching the film. In addition, the stability is influenced by the
friction forces and elastic forces appearing as a result of further stretching
of the film in relation to the “sweet spot” [1, 11].
The more layers of film applied,
the greater the load unit's stability. However, in the author's previous work
it was shown, using methods of numerical simulation of the loading unit’s
dynamics [10], that there is a certain limit number of film wraps, beyond which
no clear benefits are observed. Determining the optimal number of wraps is of
utmost importance in reducing packaging costs and waste generated. Especially
that the global consumption of stretch film can be calculated in millions of
tons per year [7, 12, 16].
The literature includes attempts to
use numerical methods to study the stability of the cargo [4]. The presented
study conducted simulation tests to establish the relationship between the
characteristic parameters of a load unit (weight, height, number of layers,
friction coefficient) and the number of wraps with a stretch film necessary to
ensure stability. During the tests, the model of a stratified loading unit
developed by the author was used [10]. A Formula to estimate the optimal number
of wraps, based on the cargo characteristics mentioned above, can reduce film
consumption. In the case of road transport, the law [5] recommends carrying out
experimental stability tests of the loading unit [8, 13]. Being able to
pre-estimate the number of wraps could also limit the number of experimental
tests performed.
2. SIMULATION
MODEL OF A LOAD UNIT WRAPPED WITH STRETCH FILM
The simulation model of the dynamics of a
layered load unit secured with a stretch film used in the research was
described in detail in the author's work [10]. The model was implemented in the
Matlab environment. The main features of the dynamic model are presented below
in order to show both its possibilities and limitations.
It was assumed that the loading unit consists
of a number of homogeneous layers, which are treated in the model as rigid
bodies. The layers can only move in a direction parallel to the pallet surface.
This greatly simplifies the equations of the model’s motion (Fig. 1):
|
|
|
(1) |
where: ![]() – the mass of the layer,
– the mass of the layer,
![]() – the acceleration of the global system
(vehicle cargo space),
– the acceleration of the global system
(vehicle cargo space),
![]() – the friction force between layer i and i-1,
– the friction force between layer i and i-1,
![]() – the resultant reaction (restoring) force of
the stretch film acting on the layer (arising from the containment force and
film tensions),
– the resultant reaction (restoring) force of
the stretch film acting on the layer (arising from the containment force and
film tensions),
![]() – the displacement of the layer
– the displacement of the layer ![]() relative to the global system.
relative to the global system.
|
|
|
Fig. 1.
Simulation model of a load unit [10]
In the case of very large displacements of
layers, the stack may become unstable. Since the equations of motion do not
take this effect into account, the algorithm automatically detects this
condition and terminates the simulation. Loss of stack stability is equivalent
to cargo instability in the sense of the norm EUMOS 50409.
In the
dynamic model, a stick-slip friction model was implemented between the layers
of the load and between the bottom layer and the pallet. In the case of slip,
the Stribeck effect as well as kinetic and viscous friction were taken into
account:
|
|
|
(2) |
where: ![]() – kinetic friction force,
– kinetic friction force,
![]() – kinetic friction coefficient between
layers
– kinetic friction coefficient between
layers ![]() and
and ![]() ,
,
![]() – speed threshold of the Stribeck phenomenon,
– speed threshold of the Stribeck phenomenon,
![]() – Coulomb speed threshold,
– Coulomb speed threshold,
![]() – viscous friction coefficient.
– viscous friction coefficient.
A special
algorithm was developed to model the interaction of the stretch film with cargo
layers depending on their displacement. The idea of the algorithm is to
introduce checkpoints on the edges of the load unit. The algorithm works
recursively and consists in successively span foil sections on the most
protruding layers of the load. The edge of the foil is visible in the 2D model
in the form of a polyline. This is a considerable simplification, since the
side surface of the film actually curves. However, such a simplification is
acceptable if the purpose of the simulation calculations is to assess the
number of wraps with the stretch film necessary to ensure its stability, i.e.,
in the case of sufficiently small layer displacements [10].
By knowing
the displacements of individual layers and their interaction with the foil,
the value of the restoring forces can be determined. It is the result of
the containment force (depending on the initial stretching of the film in the
wrapping process) and the elastic forces resulting from the additional
stretching of the film in the horizontal and vertical direction[2],
as a result of the layers moving relative to the pallet surface. Part of the
force from the horizontal tension of the film can be expressed by the formula
(3):
 (3)
(3)
where: ![]() – layer height,
– layer height,
![]() – dimensionless containment force vanishing
factor (e.g.
– dimensionless containment force vanishing
factor (e.g. ![]() ,
,
![]() – assumed distance of containment force
disappearance (e.g.
– assumed distance of containment force
disappearance (e.g. ![]() m),
m),
![]() – tension force obtained initially in the
wrapping process (containment force/edge length),
– tension force obtained initially in the
wrapping process (containment force/edge length),
![]() ,
, ![]() where
where ![]() ,
,
![]() – horizontal stiffness of the wrapped film
[N/m],
– horizontal stiffness of the wrapped film
[N/m],
![]() – coordinates of the foil control points on
the left and right side,
– coordinates of the foil control points on
the left and right side,
![]() – pallet length.
– pallet length.
Additionally, horizontal projections of forces
caused by vertical tension of film will modify the values of the restoring
forces. The vertical force2 of film stretching per unit length on
the left (same on the right) side of the loading unit can be calculated using
pallet depth and the following formula:
|
|
|
(4) |
where: ![]() – pre-tension of the film due to wrapping,
– pre-tension of the film due to wrapping,
![]() – vertical film stiffness,
– vertical film stiffness,
![]() – distance between foil control points on the
left (right) side,
– distance between foil control points on the
left (right) side,
![]() – load unit height.
– load unit height.
Variable acceleration (e.g., during emergency
braking) may act on the layers of the load unit. The simulation model allows,
inter alia, to determine the maximum values of displacements in the elastic
range and the maximum permanent displacements. This is information that can be
used to assess the stability of a load unit (EUMOS 40509).
3. EXPERIMENT PLAN
Using the
above-described dynamic model, simulation tests were carried out in order to
determine the optimal (ensuring stability) number of stretch film wraps of
different load units with respectively variable parameters. Four basic
parameters of the load unit were modified: the coefficient of friction ![]() between the layers of the load and between the
pallet and the lower layer (the same value was assumed), the total weight of
the load
between the layers of the load and between the
pallet and the lower layer (the same value was assumed), the total weight of
the load ![]() (without the weight of the pallet), the total
height of the load
(without the weight of the pallet), the total
height of the load ![]() (without the height of the pallet), and the
number of load layers
(without the height of the pallet), and the
number of load layers ![]() .
.
Three
different values of the friction coefficient ![]() , three
total weight values
, three
total weight values ![]() , three
different total heights
, three
different total heights ![]() , and four
values for the number of layers of cargo
, and four
values for the number of layers of cargo ![]() were selected. The method of generating the
individual cases is explained by the hierarchical tree in Figure 2. A total of
108 different cases were analysed.
were selected. The method of generating the
individual cases is explained by the hierarchical tree in Figure 2. A total of
108 different cases were analysed.
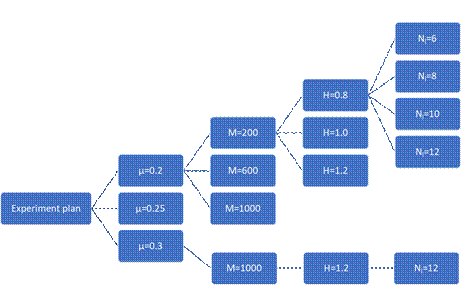
Fig. 2.
Part of the hierarchical tree to generating experiment plan
The
tensile properties of the stretch film remained the same in all tested cases.
It was assumed that the containment (bonding) force of one foil layer per unit
of height is ![]() 85N/m. A 50% reduction in bonding force as a
result of the relaxation phenomenon was taken into account. The value of this
type of force can be easily determined experimentally by measuring the corner
force [2, 14]. The stiffness, representing the elastic properties of the
pre-stretched film, in the horizontal and vertical directions are equal 1.7N/m
per one wrap. To ensure the stability of the load unit, the value of the
containment force is crucial. For this reason, in the case of stretch films
with different parameters, the obtained simulation results can be used to
estimate the number of film wraps using the proportion rule:
85N/m. A 50% reduction in bonding force as a
result of the relaxation phenomenon was taken into account. The value of this
type of force can be easily determined experimentally by measuring the corner
force [2, 14]. The stiffness, representing the elastic properties of the
pre-stretched film, in the horizontal and vertical directions are equal 1.7N/m
per one wrap. To ensure the stability of the load unit, the value of the
containment force is crucial. For this reason, in the case of stretch films
with different parameters, the obtained simulation results can be used to
estimate the number of film wraps using the proportion rule:
|
|
|
(5) |
The
simulation tests were performed in accordance with the recommendations of the
EUMOS50409 standard. Numerical tests simulating the braking of the loading unit
were carried out. Such tests in real conditions are performed on specially
adapted mobile platforms [8]. Recommended braking acceleration reached 0.8g and
changed over time as shown in Fig. 3.
An
algorithm was prepared in the Matlab environment that analysed individual cases
selected for the experiment and automatically determined the minimum number of
wraps necessary to obtain a stable load unit by an iterative method. A typical
diagram of the displacements of the cargo layers during the simulated
acceleration test is shown in Fig. 4. On its basis, it is possible to control
extreme temporary elastic displacements and also the permanent displacements of
the layers.
The
algorithm checks four criteria that must be met simultaneously. The first three
result directly from the EUMOS 40509 [6, 8] standard:
1.
Elastic displacements must not exceed 10% of the
load height.
2.
In the case of a layered cargo, the relative
displacements of the layers may not exceed 2% of the load height.
3.
Permanent displacements must not exceed 5% of the
load height. When the height of the load does not exceed 1200 mm, the
limit is fixed at 60 mm. In addition, permanent displacements of the lower
layers, located at a height of up to 200 mm, must not exceed 40 mm.
The fourth
criterion checks whether the cargo layers remain at rest after the acceleration
test. For this purpose, the algorithm compares the displacement values in 1.9
seconds and at the end of the test (Fig. 4). The differences should be close to
zero.
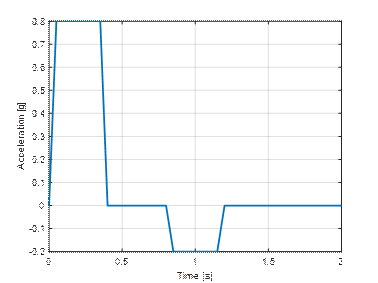
Fig. 3.
Graph of the acceleration acting on the load over time
4.
ANALYSIS OF THE RESULT DATA SET
As a result of the simulation, a set of data was
obtained![]() , where
, where ![]() is the number
of wraps ensuring the stability of the load unit in accordance with the
standard EUMOS 40509. Analysis of variance was performed on the dataset to
establish the relationship between the independent (explanatory) variables
is the number
of wraps ensuring the stability of the load unit in accordance with the
standard EUMOS 40509. Analysis of variance was performed on the dataset to
establish the relationship between the independent (explanatory) variables ![]() and the dependent variable (response)
and the dependent variable (response) ![]() .
.
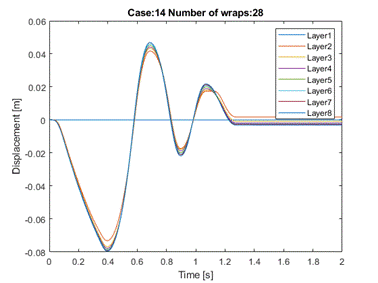
Fig. 4. A
typical graph of the cargo layers displacements during the acceleration test
Based on the main effects plot for grouped data
(Fig. 5) it can be seen that none of the lines in the chart is horizontal and
that all four independent variables have an influence on the average number of
wraps. The number of wraps increases with increasing weight and decreases with
increasing height and, to a lesser extent, with increasing values of the
friction coefficient. The influence of the number of cargo layers on the main
effect is the smallest, with a global minimum for 8 layers. It appears that the
number of cargo layers can be omitted from the regression analysis. The above
observations are also confirmed by the analysis of “multivari chart” for data
with four grouping variables (Fig. 6).
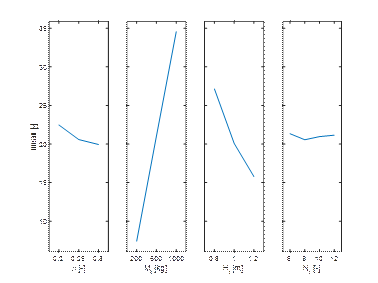
Fig. 5. Main effects plot of grouped data
The study of interactions between the variables
(Fig. 7) leads to the conclusion that the most non-parallel lines in the plot
occur in the case of combinations of variables ![]() and
and ![]() . Since the weight and height of the load have the
greatest impact on the number of wraps, an attempt was made to divide the data
set into 9 clusters using the k-means method. The overlap of the data presented
in the subspace
. Since the weight and height of the load have the
greatest impact on the number of wraps, an attempt was made to divide the data
set into 9 clusters using the k-means method. The overlap of the data presented
in the subspace ![]() with the
clusters obtained by the k-means method would mean that the number of wraps
depends only on the weight and height. However, based on the diagram (Fig. 8),
it can be concluded that such a thesis is not true. In particular, this applies
to low-height heavy loads, which have been classified into 4 different
clusters.
with the
clusters obtained by the k-means method would mean that the number of wraps
depends only on the weight and height. However, based on the diagram (Fig. 8),
it can be concluded that such a thesis is not true. In particular, this applies
to low-height heavy loads, which have been classified into 4 different
clusters.
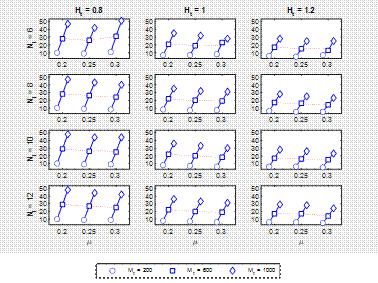
Fig. 6. Multivariant chart for data with four
grouping variables
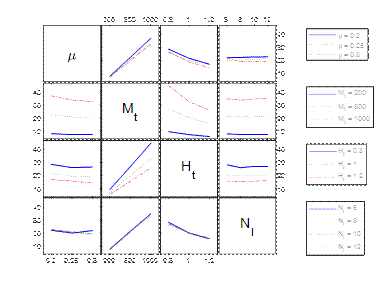
Fig. 7. Interaction plots for the four factors
5.
MULTIVARIATE LINEAR REGRESSION MODEL
The first
tested multivariate linear regression model included all linear and quadratic
factors, as well as products obtained from two-element combinations from a set
of four independent variables. A good fit of the model was obtained, as shown
in the chart (Fig. 9). Relatively few measuring points go beyond Cook's
standard distance (Fig. 10). The error between the number of wraps estimated
from the model and the number of wraps determined by the simulation is
acceptable (Fig.11 and Fig.12). The mean of the absolute error values is 0.73,
which is less than one foil wrap. However, the analysis of Table 1 shows that
in the case of some regression factors, the null hypothesis cannot be rejected,
i.e. that some determined regression model coefficients may be equal to zero
(p-value greater than 0.05). In all presented tables, the Wilkinson
notation was used.
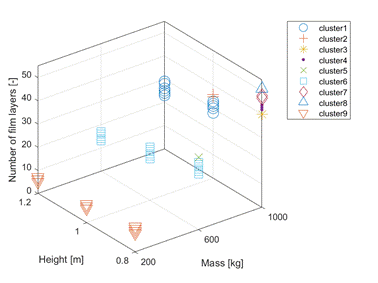
Fig. 8. Cluster data using k-means clustering
algorithm
Tab. 1
First
regression model
|
Linear regression
model: y ~ 1 + x1*x2 +
x1*x3 + x1*x4 + x2*x3 + x2*x4 + x3*x4 + x1^2 + x2^2 + x3^2 + x4^2 Estimated
Coefficients: |
||||
|
|
Estimate |
SE |
tStat |
pValue |
|
(Intercept) |
45.682 |
12.212 |
3.7406 |
0.000317 |
|
x1 |
-66.694 |
60.598 |
-1.1006 |
0.27391 |
|
x2 |
0.091788 |
0.00437 |
21.002 |
4.54E-37 |
|
x3 |
-70.538 |
15.15 |
-4.6561 |
1.07E-05 |
|
x4 |
-0.66713 |
0.78578 |
-0.849 |
0.39806 |
|
x1:x2 |
-0.04583 |
0.009805 |
-4.6744 |
9.94E-06 |
|
x1:x3 |
-14.583 |
19.61 |
-0.74365 |
0.45896 |
|
x1:x4 |
-4.6111 |
1.4321 |
-3.2197 |
0.001768 |
|
x2:x3 |
-0.04766 |
0.002451 |
-19.441 |
1.60E-34 |
|
x2:x4 |
0.000174 |
0.000179 |
0.9698 |
0.33466 |
|
x3:x4 |
0.625 |
0.35804 |
1.7456 |
0.084178 |
|
x1^2 |
250 |
110.93 |
2.2536 |
0.026571 |
|
x2^2 |
-2.60E-07 |
1.73E-06 |
-0.15024 |
0.8809 |
|
x3^2 |
34.375 |
6.9333 |
4.9579 |
3.19E-06 |
|
x4^2 |
0.060185 |
0.032684 |
1.8414 |
0.068748 |
|
Number of
observations: 108. Error degrees of freedom: 93 Root Mean Squared
Error: 1.36 R-squared: 0.99.
Adjusted R-Squared: 0.988 F-statistic vs.
constant model: 639. p-value = 7.47e-86 |
||||
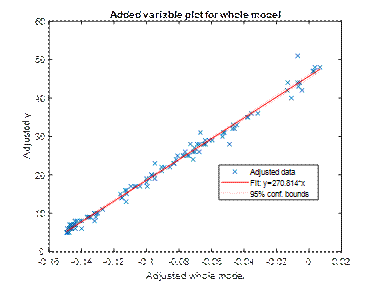
Fig. 9.
Whole model fitting
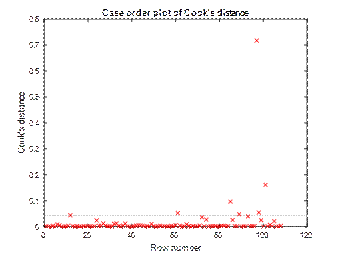
Fig. 10.
Cook’s distance plot
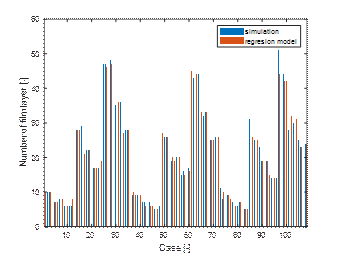
Fig. 11.
Comparing the estimate from the first regression model with the simulation
results
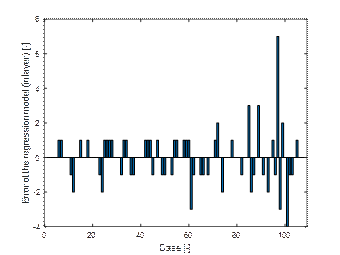
Fig. 12.
Errors of the full (first) regression model
In the
second linear regression model (Table 2), all polynomial factors that did not
meet the null hypothesis criterion were rejected. Model errors are comparable
to the full model (Fig. 13). The mean of the absolute error values is 0.87.
In the second model, again, some of the polynomial coefficients do not meet the
null hypothesis criterion. After their rejection, the third model was obtained,
maximally simplified, in which all p-values are less than 0.05 (Tab. 3).
The mean model error 0.85 (Fig. 14). All regression models are compared
in Fig. 15.
Tab. 2
Second
regression model
|
y ~ 1 + x1:x2 + x2*x3 + x1:x4 + x1^2 + x3^2 Estimated Coefficients: |
||||
|
|
Estimate |
SE |
tStat |
pValue |
|
(Intercept) |
33.587 |
7.544 |
4.4522 |
2.21E-05 |
|
x2 |
0.093598 |
0.003742 |
25.01 |
7.95E-45 |
|
x3 |
-68.559 |
15.02 |
-4.5645 |
1.43E-05 |
|
x1:x2 |
-0.04808 |
0.010486 |
-4.5848 |
1.32E-05 |
|
x2:x3 |
-0.04766 |
0.002636 |
-18.079 |
2.78E-33 |
|
x1:x4 |
-0.16726 |
0.24803 |
-0.67433 |
0.50166 |
|
x1^2 |
10.941 |
14.964 |
0.73119 |
0.46638 |
|
x3^2 |
34.375 |
7.4559 |
4.6105 |
1.19E-05 |
|
Number of observations: 108. Error degrees
of freedom: 100 Root Mean Squared Error: 1.46 R-squared: 0.987. Adjusted R-Squared: 0.986 F-statistic vs. constant model: 1.1e+03. p-value = 1.22e-91 |
||||
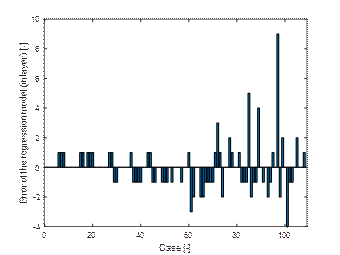
Fig. 13.
Errors of the second regression model
Tab. 3
Third
regression model
|
Linear regression
model: y ~ 1 + x1:x2 +
x2*x3 + x3^2 Estimated
Coefficients: |
||||
|
|
Estimate |
SE |
tStat |
pValue |
|
(Intercept) |
33.913 |
7.4375 |
4.5598 |
1.43E-05 |
|
x2 |
0.092324 |
0.002935 |
31.452 |
2.65E-54 |
|
x3 |
-68.559 |
14.929 |
-4.5924 |
1.25E-05 |
|
x1:x2 |
-0.04298 |
0.005011 |
-8.5773 |
1.13E-13 |
|
x2:x3 |
-0.04766 |
0.00262 |
-18.189 |
8.70E-34 |
|
x3^2 |
34.375 |
7.4106 |
4.6386 |
1.04E-05 |
|
Number of
observations: 108, Error degrees of freedom: 102 Root Mean Squared
Error: 1.45 R-squared: 0.987,
Adjusted R-Squared: 0.986 F-statistic vs.
constant model: 1.56e+03, p-value = 1.15e-94 |
||||
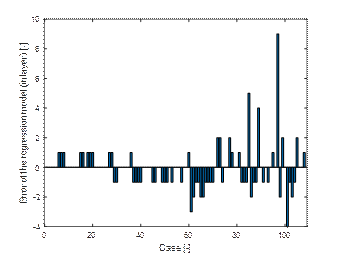
Fig. 14. Errors of the third
regression model
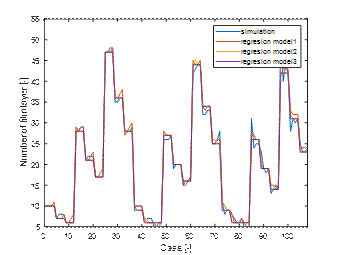
Fig. 15. Comparison of simulation results and
three regression mod
6. TESTS OF THE LINEAR REGRESSION MODEL
The
resulting linear regression model number 3 was tested on randomly generated
data. It was assumed that the coefficient of friction is a random real number
from the interval ![]() ,
similarly the total weight from
,
similarly the total weight from ![]() ; total
height
; total
height ![]() ; and the
number of cargo layers is a random integer from
; and the
number of cargo layers is a random integer from ![]() .
.
A hundred
cases were analysed. The results were presented in the error plot, which was
the difference between the forecast of the necessary number of wraps from the
regression model number 3 and the number of wraps obtained by the simulation
(Fig. 16). The maximum estimation error is 4 wrappings.
The
regression model was developed for the data from simulations carried out with
the assumption of certain values of the coefficients defining the strength
properties of the stretch film. The model’s suitability was checked by
performing another 100 tests of loading units with randomly selected
parameters. However, it was assumed that the restraining force of one foil
layer per unit length (![]() ) and
stiffnesses (
) and
stiffnesses (![]() )
constitute 75% of the previously adopted values. The proportionality rule (5)
was used to estimate the number of wrappings. As can be seen in Fig. 17, the
estimation errors are of a similar range as before. This proves a fairly
universal scope of applications of the developed model.
)
constitute 75% of the previously adopted values. The proportionality rule (5)
was used to estimate the number of wrappings. As can be seen in Fig. 17, the
estimation errors are of a similar range as before. This proves a fairly
universal scope of applications of the developed model.
7. CONCLUSIONS
Based on
the results of the simulation tests, a multiple regression model was developed,
which with a fairly good accuracy allows estimating the number of wraps of a
pallet with a load of a certain weight, height, number of layers, and friction
coefficient between the layers. It was also confirmed that when changing the
strength parameters of the stretch film, the proposed method of calculating the
number of wraps also provides a sufficiently good estimate.
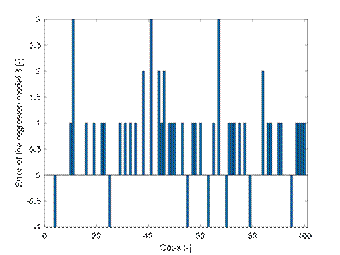
Fig. 16.
Error of the regression model 3 for random data
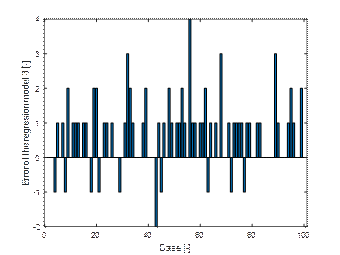
Fig. 17.
Error of the regression model 3 for random data after stretch film properties
modification
In
practice, in accordance with the EUMOS 50409 standard, obtaining a certificate
of stability and safety of a load unit requires conducting experimental tests
on a real object. The ability to pre-estimate the number of film layers
necessary to ensure the stability of the pallet unit will reduce the number of
such tests. Additionally, it can contribute to a more rational management of
the stretch film consumption and reduce the amount of waste.
It is
noted that the biggest influence on the required number of the film wraps has a
total weight and the total height of cargo. As expected, the number of
necessary film layers increases with increasing weight and decreases with
increasing cargo height. In the first case, the inertia force during emergency
braking increases. In the second case, the effective force holding back the
cargo rises.
The
friction coefficient in the accepted range of its variability has a much
smaller impact on the number of wraps. Increasing the value of the friction
coefficient reduces the number of film layers needed, which was also expected.
The most
ambiguous effect is the number of cargo layers, at least within the range of
its variability assumed in the study. It is clear that the more layers of
cargo, the less layer’s mass. At the same time, the smaller is the inertia
force acting on the layer. However, as the number of layers of load increases,
the effective containment force per layer also decreases.
The
regression model was developed for the most common case when all layers of the
load unit are homogeneous. There are no obstacles to use the proposed procedure
for other special cases of creating a non-uniform stratified unit load.
On the basis of the
third regression model, which omits the number of layers of a load unit, a
graph was prepared that allows estimating the number of foil wraps based on the
total weight of the load and its height (Fig. 18). When using foil with other
parameters, the number of wraps can be easily converted according to the
formula (3).
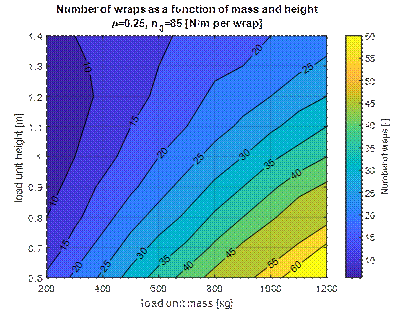
Fig. 18.
Dependence of the wraps number on the weight and height of the cargo unit
References
1.
ASTM D4649. Standard Guide for Selection and Use of Stretch Wrap Films.
2.
Bisha J. 2012.
„Correlation of the elastic properties of stretch film in unit load
containment”. PhD thesis. Blacksburg,
USA: Virginia Tech.
3.
Cieśla Maria, Tadeusz Opasiak. 2014. Load securing in cargo transport units.
Katowice: PAN. ISBN: 978-83-940763-2-0.
4.
Danjou S., N. Ostergaard. 2018.
“Application of Computational MBD for Simulation of Wrap Packaging
Performance”. Journal of Applied
Packaging Research 10: 25-36.
5.
EUMOS 40509-2012. Test method for load unit rigidity.
6.
Directive 2014/47/EU of the European
Parliament and of the Council. The technical roadside inspection of the
roadworthiness of commercial vehicles circulating in the Union.
7.
Finnemore D. 2017. “Stretch wrap film and
pallet load stability”. POWDERBULK.COM. Available at: https://www.powderbulk.com/enews/2017/editorial/story_pdf/pbe_04_19_17rihf.pdf.
8.
Greco A., A. Renzini, M. Vaccari, F. V. De Camargo.
Testing methods and equipment for palletized
products. 2019. IOP Conf.
Ser.: Mater. Sci. Eng. 659: 012087. DOI: 10.1088/1757-899X/659/1/
9.
Kuskil’din
R.B., M.A. Vasilyeva. 2017. „Dynamic loads during safety braking of the
container with cargo”. Procedia
Engineering 206: 248-253. DOI: 10.1016/j.proeng.2017.10.469.
10.
Matyja
Tomasz. 2020. „Assessment of the pallet unit load stability by simulation
methods”. Communications - Scientific
Letters of the University of Žilina 22(3): 19-28.
11.
Singh J.,
K. Saha, T. Sewell. 2017. „Evaluation of stability of unit loads for tilt and
shockevents during distribution”. Journal
of Applied Packaging Research 9(3):73-93.
12.
Tepić J., V. Todić, I.
Tanackov, D. Lukić, G. Stojić, S. Sremac. 2012. “Modular systemdesign for plastic euro pallets”. Metalurgija 51(2): 241-244.
13.
The Transportable Test Pallet. Available at: https://www.bestpackaging.com.au/.
14.
Tkaczyk S., M. Drozd, Ł.
Kędzierski, K. Santarek. 2021. „Study of
the Stability of Palletized Cargo by Dynamic Test Method Performed on
Laboratory Test Bench”. Sensors 21:
5129. DOI: 10.3390/ s21155129.
15.
Vlkovský M., M. Šmerek, J. Michálek. 2017.
„Cargo securing during transport dependingon the type of a road”. IOP Conf. Series: Materials Science and
Engineering 245: 042001. DOI: 10.1088/1757-899X/245/4/042001.
16.
White M. S., P. Hamner. 2005. „Pallets move the world: the case for
developing system-based designs for unit load”.
Forest Product Journal 55:
8-16.
Received 09.03.2024; accepted in revised
form 05.05.2024
![]()
Scientific
Journal of Silesian University of Technology. Series Transport is licensed under
a Creative Commons Attribution 4.0 International License


