Article citation information:
Ali, Y.,
Sabir, M. Mode-route choice decisions: a case study of CPEC
investment in Pakistan Railways. Scientific
Journal of Silesian University of Technology. Series Transport. 2022, 115, 5-21. ISSN: 0209-3324. DOI: https://doi.org/10.20858/sjsutst.2022.115.1.
Yousaf ALI[1],
Muhammad SABIR[2]
MODE-ROUTE CHOICE DECISIONS: A CASE STUDY OF CPEC INVESTMENT IN PAKISTAN
RAILWAYS
Summary. This study proposes
the use of multi-criteria decision models (MCDM) for transportation mode-route
choice decisions. This method is beneficial when trips' microdata are
unavailable. Route-mode choice decisions were investigated for three public
transportation modes (buses, railways, and airlines) in the post-China Pakistan
Economic Corridor (CPEC) investment in Pakistan Railways (PR) for a link
between Peshawar and Karachi. TOPSIS (Technique for Order of Preference by
Similarity to Ideal Solution) was used for the mode choice decisions and a
hybrid model of AHP (Analytical Hierarchy Approach) – TOPSIS was used for
the route choice decision ML-1 link of PR. This study concludes that rails were
the best mode of transportation in post-CPEC investment. Furthermore, route 3,
linking Karachi to Peshawar via Lodhran, Multan, and Miniawali, is the best
route connection among the four considered routes.
Keywords: Route-Mode
Choice, AHP-TOPSIS, Hybrid-CDM
1. INTRODUCTION
Transportation
mode-route choice decisions are essential for travellers. In public
transportation, these choices have become increasingly important for public
transport service providers. Because public transport service operators have to
ensure uninterrupted public transportation to cater to travellers' demands. The
three most common long-distance modes of transportation are buses, railways,
and airlines. Public sector intervention in investment, infrastructure
development, policies, and regulations influences travellers' mode choice
within these three main public transportation choices. Accordingly, service
providers respond to the route choice of each mode of transportation and
government regulations. For instance, massive investment in the railways can
make it more attractive, resulting in people switching from buses and airlines
to railways, thus posing an extra challenge for the policymaker in addressing
the additional demand.
Nowadays,
the Pakistan Railways (PR) is one of the major public sector enterprises that
rely heavily on government subsidies to meet its operational and other losses.
PR lost its market share of freight and passenger transportation to its
competitors (namely, military-run National logistic cell (for freight), buses,
and airlines (for passenger transportation). Other reasons for PR's fall are a
lack of government interest in railway investment, more discriminatory policies
for developing road transportation, and corruption. In 2017, PR lost Rs. 80
billion (0.69 billion US$) and aggregate to overall losses during the 2013-2017
period equalled Rs. 1.58 trillion (13.5 billion US$) (Abbas, 2018)). These losses were paid by the Pakistani
government, which had chronic difficulties in meeting its budget deficits.
In March 2013, China started
working on its Belt and Road initiative (BRI) (PRC, 2015). In the same year, under BRI, China and Pakistan signed
a Memorandum of Understanding for an economic corridor (named China-Pakistan
Economic Corridor (CPEC)). CPEC aims to establish various connectivity links
(including roads and railways) between both countries. The current agreed-upon
volume of investment in Pakistan under CPEC is about US$ 62 billion, expected
to be made in infrastructure development by 2030. For China, this provides the
quickest and most economical alternative route to the Arabian Sea via the
Pakistani port, Gwadar, and offers a strategic advantage for a presence in the
region close to important sea trade routes. It is an opportunity for Pakistan
to upgrade its deteriorating and financially troubled railways, among other gains.
Until March 2018, there were three major railway infrastructure projects under
CPEC that were either under consideration or ongoing for PR (PC, 2018). Construction of dry port at
Havelian (the last functional railway link close to the Chinese border), capacity
building of PR, and up-gradation and improvement of ML-1 link of PR.
The work on ML-1 under CPEC
consists of two phases that include the up-gradation and the doubling of rail
tracks for the entire route, respectively. The up-gradation consists of constructing
new train stations and repairing and upgrading the bridges and tunnels on ML-1.
Further, the up-gradation includes protection fencing on both sides of the
track, introducing modern technologies, and auto block signalling. This
intervention will increase the speed up to 160 km/hour. Expectantly, this will
significantly increase the revenues of PR.
This
research had multiple objectives. First, it aimed to analyze the influence of
CPEC investment in PR and its impact on railway travel compared to its
competitors, mainly buses and airlines. Second, it attempts to suggest the best
route for policymakers for the ML-1 rail link (across various Pakistani cities)
to be considered in a post-CPEC investment. The study's contribution is
combining route-mode choice decisions in the post-CPEC investment intervention
in PR, the first of its kind, to discuss these considerable investments in
railways. The significant contribution is applying MCDM techniques in
route-mode choice decisions and developing a hybrid model based on TOPSIS (Technique
for Order of Preference by Similarity to Ideal Solution) and AHP (Analytical
Hierarchy Approach).
The
rest of the paper is organized thus: Section 2 investigates the relevant
literature. PR and its connection with CPEC are discussed in Section 3.
Furthermore, Section 3 states the competitiveness of PR with available buses
and airline services in Pakistan. Section 4 describes the research methods
applied in this study, along with some literature on these methods. While Section
5 contains the presentation and discussion of the results. This section is
divided into sub-sections presenting the mode and route choice decisions.
Finally, Section 6 concludes the paper.
2.
LITERATURE REVIEW
Transportation
mode choice and route choice decisions are important decisions for travel.
Transportation mode choice decisions depend on many factors, including income
and ownership of vehicles (Dissanayake and
Morikaw, 2010), level of service such as safety (Larsen et al., 2013), comfort (Johanssonab
et al., 2006), reliability (Bhat and
Sardesai, 2006) and even important life events (Scheiner and Holz-Rau, 2013). Similarly, transportation route
choice is also an important decision for travellers (Prato, 2009).
Mode
and route choice for transportation are extensively researched subjects in
developed countries due to the easy availability of revealed preferences
(RP) travel surveys (travel surveys based on original travel choices and
behaviour). However, studies from developing countries are few, and even those
available (for example, Dissanayake and
Morikawa, 2002; Srinivasan et al., 2007)
are not quite detailed compared to travel surveys obtained from research from
developed countries.
The
econometric and statistical techniques applied in these studies vary and are
based on data and research objectives. However, discrete choice models (such as
binary choice models, multinomial logit or probit, and nested logit) are the
most frequently used techniques (for example, Srinivasan
et al., 2007; Bhat and Sardesai, 2006;
Dissanayake and Mosrikaw, 2010; Larsen et al., 2013; van Amen and Helbich, 2017; Sun et al., 2017; Aziz et al., 2017).
Discrete choice models gained popularity following the seminal scholarly
contribution of Daniel McFadden (McFadden, 1974),
later by (Ben-Akiva and Lerman, 1985),
and recently (Hensher et al., 2007) and (Train, 2009). Similarly, Prato (2009) presents an overview of route-mode
choice-based studies based on a user perspective.
Discrete
choice models are extensively used models for transportation mode and route
choice decisions and other applications. These models are mostly employed for
modelling RP data. PR based studies provide real-world choices
for various modes of transportation as they are more reliable, and have
findings that are easily validated and applied. However, at the same time, it
comes with higher time and monetary costs with the constraint of adding only
available modes of transportation (Hensher et
al., 2007). Therefore, if a new mode of transportation becomes available
(or will be available soon), PR data cannot study such a choice as it was not
available at the time of the survey (when people made choices for their
transportation modes).
Hensher et al. (2007) discussed the
process of using discrete choice models for the stated preferences (SP)
choices. In SP data, people indicate their transportation mode choices
among all available alternatives without taking the trips. SP data
provides an additional benefit of including a non-existent choice in decision
making, which was not possible in PR data. In a developing country like
Pakistan, where travel surveys are non-existent, and no prior studies are
available on transportation mode choices, SP-based studies seem more useful.
Route
choice decisions also had extensive use of discrete choice models. However,
more recently, the use of MCDM is becoming increasingly popular due to its
relative ease of application and less extensive use of data. For example, Hamurcu et al. (2016) used AHP-TOPSIS for the
best route based on several criteria such as construction costs, aesthetic and
visual impacts, access to employment, and education. Ivona et al., (2017) proposed a method for railway route selection
using three MCDM techniques: Weighted Sum-Model, AHP, and VIKOR. Their results
confirm the validity and usefulness of MCDM application in route choice
decisions for railways.
This
study focuses on both mode and route choice decisions for travellers in
Pakistan. However, we contribute to the existing literature by employing
multi-criteria decision-making techniques. We used a hybrid model based on the
TOPSIS technique (Technique for Order of Preference by Similarity to Ideal
Solution) and AHP (Analytical Hierarchy Process) instead of the traditional
discrete choice models for transportation mode and route choice decisions.
Furthermore, in this study, route choice decisions are considered from the
public transport operator's perspective to optimize the route subject to
several criteria. A stated preference survey (Hensher et al., 2007)
was conducted online on Pakistan's residents about their travel time
preferences for railways (post-CPEC investment in ML-1), roads, and bus. The
novelty of this study is the use of the multi-criteria decision analysis rather
than the more popular techniques of discrete choice, namely TOPSIS for mode
choice (railways versus other modes of transportation, particularly buses and
airlines) and AHP for route choice decision and applying it in the context of
PR in the post-CPEC investment scenario.
3. PAKISTAN RAILWAYS: BACKGROUND AND
COMPETITIVENESS
3.1. Railways background
The
first rail link (Karachi-Kotri), having a length of 105 miles of existing PR,
was opened in 1861 by the British (Pakistan
Railways, 2018). Afterwards, various extensions were opened under
British rule, and later after 1947, through the Pakistan government, the total
railway track length was extended to the current operational 7,791 kilometres (MoF, 2018). It is worth mentioning that major
extensions and development took place in the pre-1947 period under the British
rulers. For a few decades, in the post-1947 period, public infrastructure
investment policies favoured railways; however, it gradually became more biased
toward road transportation. Rail tracks and infrastructure were initially
designed for a maximum speed of 110 km/hour. However, this speed has been
significantly reduced in recent times. Currently, the main railway link for PR
is the ML-1 that links Karachi (a port city in the South) to Peshawar (a city
in North-West and close to the Afghanistan border), crossing through the
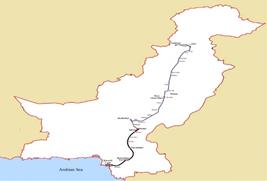
populous Punjab province, connecting all major cities. ML-1 is shown as a bold
line in Figure 1.
3.2. Bus, railways and airline competitiveness:
mode choice and route choice decisions
During
the last few decades, Pakistan Railways, compared to other transportation
modes, have become less competitive. For example, in the year 2018, rail travel
on the ML-1 took about 33.5 hours (at the cost of Rs. 1,490≈12.88 US$)
with 59 stops, covering 1687 kilometres (Pakistan
Railways, 2018). This 33.5-hours trip between Peshawar-Karachi is
announced time by PR (this makes it about 50.35 km/hour), but delays and
unreliability in travel time is a big issue. For instance, the day on which
this rate and travel time are obtained from the Pakistan railway’s
official website. The train on the same route on taking this information from
the website was 1 hour and 20 minutes late. At the same time, the one-way bus
trip will take 11 hours (at the cost of Rs. 4,050 ≈35 US$). The same
Peshawar-Karachi one-way airline trip cost Rs. Rs. 10,100≈ 87.32 US$ and
takes 1.5 hours. All information about trip timings and costs were
obtained from the Daewoo express bus websites, railways (Pakistan Railways),
and airlines (Pakistan International Airlines), respectively, on March 26-29,
2018.
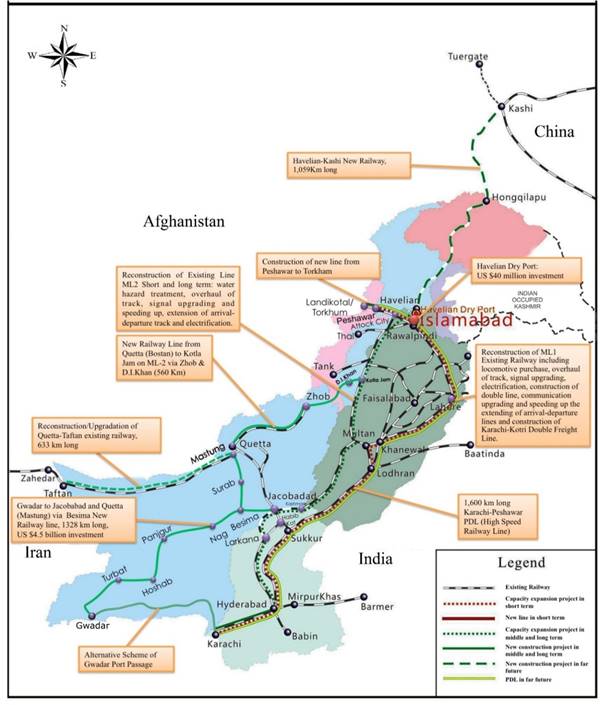 Fig.
1. Pakistan railway map (CPEC projects
are also shown on the map)
Fig.
1. Pakistan railway map (CPEC projects
are also shown on the map)
Source: (PC, 2018)
Similarly,
the route choice for these three modes of transportation is different. For the
airline, it is a direct flight from Peshawar to Karachi. However, the bus
travels via the Indus highway (a direct road link between Peshawar to Karachi
going diagonally across Pakistan), passing through major cities. The bus stops
on this route are Kohat, D. I. Khan, D. G. Khan, Rajanpur, Kashmore, Hyderabad,
and Karachi, to mention the major few. The train even includes more train
stations, and it goes diagonally, connecting all the major cities on the ML-1 route
while travelling between the two cities.
The
above facts show that the airline while being the fastest mode, is an expensive
travel mode. While bus being with decent travel time, had a medium range of
fares. Although railways are economical; however, the time their frequent
delays take makes them less competitive compared to buses and airlines.
Therefore, CPEC is an opportunity for PR to get a massive investment in its
up-gradation that will not only reduce the travel time but will also make it
more reliable. Thus, it will increase the competitiveness of PR compared to
buses and airlines. Subsequently, one of the objectives of this research is to
study which mode of transportation will be preferred for travel in post-CPEC
investment in PR (an option not available yet) while comparing the three modes
of transportation between Peshawar and Karachi.
4. RESEARCH METHODOLOGY
As
earlier stated, this study employs two MCDM techniques by combining TOPSIS and
AHP into a hybrid model. This particular section describes these two models and
their processes in brief.
4.1. Technique for order of preference by
similarity to ideal solution (TOPSIS)
Hwang
and Yoon introduced TOPSIS (Technique for Order Preference by Similarity to
Ideal Solution) in 1981. It is a simple MCDM method that ranks the
alternatives. TOPSIS selects an alternative with the shortest distance
from the positive ideal solution but the largest distance from
the negative ideal solution. Furthermore, the positive ideal
solution shows the high value of benefit criteria and the low value of cost
criteria. The negative ideal solution shows the low value of benefit
criteria and the high value of cost criteria.
The
TOPSIS method is highly used in several applications including supply chain
management and logistics (Boran, 2009).
TOPSIS is similarly used in airlines' service quality (Tsaur, 2002) and railways’ route choice decisions (Kosijer et al., 2012). Hamurcu et al. (2016) used AHP and TOPSIS for Ankara's Monorail
route. Using AHP and TOPSIS, the study made route selection based on
construction costs, total travel time, integration, and accessibility. In this
study, TOPSIS is applied to compare various modes of public transportation
(train, air, and bus) in the post-CPEC investment in the ML-1 rail track of PR.
Application of
TOPSIS
Steps
involved in the application of TOPSIS are as follows:
Step 1: First, each criterion (weights) is assigned
according to their relative importance based on which alternatives are checked
for selection, such as speed and travel cost. The decision-makers assign these
weights. In this study, the decision-makers are public people. The rating scale
is as follows (Table 1).
Tab.
1.
TOPSIS (1 to 10 Rating)
|
Attributes |
Linguist Values |
Scale |
|
Positive attributes |
Very good |
10 |
|
|
Very low |
1 |
|
Negative Attributes |
Very good |
1 |
|
|
Very low |
10 |
Step 2: A decision matrix is formed. In this matrix
attribute, weights are given to criteria by experts or decision-makers. In this
study, these weights are obtained from AHP performed for each criterion, and
the rating value in AHP comes from the survey. It should be noted that ![]() are the attribute weights obtained
earlier from AHP.
are the attribute weights obtained
earlier from AHP.
Step 3: The decision matrix is then standardized. In
this step, each column is divided by the root of the sum of the square of all
the numbers of the columns to obtain a standardized matrix.
|
|
x=1, 2
…m |
y=1, 2
….n |
(4) |
Step 4: A weighted standardized decision matrix is
formed by multiplying each rating of the standardized decision matrix with each
criterion's attribute weight. The decision-makers give weights to each
criterion relative to each alternative. The attribute weights (wxy)
are obtained by taking all the alternative weights of one criterion. The
weighing scale is discussed in step 1. The weighted normal values ‘zxy’
can be calculated by the given equation.
|
|
|
(5) |
|
Where |
|
|
|
|
x=1, 2….m |
y=1,
2….n |
Step 5: Ideal solution and negative ideal solutions are
identified in this step. The ideal solution (B+) is a set of maximum values for
each criterion, selected from a weighted standardized decision matrix. For the negative
ideal solution (B-), a group of minimum values for each criterion
are selected.
|
v+y=
(max {hxy} |x=y) |
x=1,
2………..m |
(6) |
|
B+ = {v1+v2+…………..vn} |
ideal
solution |
|
|
v-y=
(min {hxy} |x=y) |
x=1,
2………..m |
(7) |
|
B- = {v1+v2+…………..vn} |
Negative
ideal solution |
|
Step 6: The separation of obtained solution from an ideal
solution and negative ideal solution is checked in this step. The
separation from an ideal solution and a negative ideal solution
is obtained by subtracting the ideal solution or negative ideal solution from
each element of a row of weighted standardized decision matrix and then square
it, sum it and take the square root of the sum.
|
|
|
(8) |

Similarly,
distance from negative ideal solution is calculated using the following
equation
|
|
|
(9) |
Step 7: This is the last step in which the closeness of
the solution is obtained. For this, the ranking score must be calculated.
|
|
|
(10) |
A is the ranking score
Check
the A value for each alternative. If
the A value of any alternative is
near 1, it is considered ideal, and the one closer to zero is regarded as a negative
ideal solution. Option having an ‘A’
value nearer to 1 is the best selection (Karahalios,
2017).
4.2. Analytical Hierarchy Process (AHP)
Analytical
Hierarchy Process is a multi-criteria decision-making technique used for
analyzing complex decisions. It is based on the pairwise comparison. Several
studies have applied the AHP technique for choice decisions in the existing
literature.
The
AHP technique is more prevalent in operations research and has been applied in
studies for mode and carrier selection choice for the supply chain. Meixell and Norbis (2008) present an overview
of such scholarly studies. However, themes related to the environment, energy,
security, supply chain integration, international growth, and the ICT have been
under-represented in the transportation choice literature (Meixell and Norbis, 2008).
4.3. Process of
AHP
The
general stepwise application of AHP is detailed in Saaty (2008). A brief description of the application of AHP in this
study context is explained below.
Step 1. List all the concerned alternatives in the
table. In this case, we are considering three options, namely, bus, train, and
airlines.
Step 2. Make the pairwise comparison matrix. The
alternatives are listed horizontally and vertically. Rate the importance of one
choice to the other. The rating number indicates the importance of horizontal
choice with the vertical one. The rating is done on a 1 to 9 scale
(Table 2).
Tab.
2.
AHP 1-9 Rating
|
Rating Scale |
Rating Values |
|
Equally preferred |
1 |
|
Moderately preferred |
3 |
|
Strongly preferred |
5 |
|
Very strongly preferred |
7 |
|
Extremely preferred |
9 |
|
Intermediate importance |
2,4,6,8 |
In
a comparison of x and y alternatives, if x is 3 compared
to y, then y is 1/3 compared to x. The value of 1 is assigned when the
comparison of alternatives is made with itself. The generalized matrix is:
|
|
|
(11) |
![]() or generally can be written as
or generally can be written as![]()
Step 3: The matrix is normalized. The normalization of
the matrix is done so that all the numbers in a column are added, and then each
number in that column is divided by the resultant sum. The sum of these
modified numbers in that column is 1.
Step 4: In this step, the priority vector is
constructed. The priority vector is made by taking the average of all the
modified numbers from the normalized matrix in each row. This results in a
column matrix, and its sum is also 1.
Step 5: Multiply each column with its propriety vector
number and then sum all the numbers row-wise.
Step 6: In this step, the consistency of the matrix is
checked. A column vector is made from step 5. Divide this column vector by the
priority vector. The action results in one more column vector. From this
vector, we get the λmax
value. λmax
is the average of the vector entities.
Then the
consistency index is calculated using the following formula.
|
|
|
(12) |
From the
consistency index, then the consistency ratio is calculated.
|
|
|
(13) |
The
RI values depend on the number of alternatives been compared. The RI values are
given in Table 3.
Tab.
3.
AHP Random Indices
|
N |
1 |
2 |
3 |
4 |
5 |
6 |
7 |
8 |
|
RI |
0 |
0 |
0.58 |
0.90 |
1.12 |
1.24 |
1.32 |
1.41 |
If
the consistency ratio is less than 0.1, then the alternatives are within the
acceptable range
The whole
process of the AHP is similarly repeated for each criterion.
5. ESTIMATION AND RESULTS
The
estimation process is applied in two phases. In the first phase, TOPSIS is used
based on the survey (details about the survey are given below), and the best
mode of transportation between Karachi and Peshawar is obtained among buses,
trains, and airlines. In the second phase, weight for various selection
criteria (such as fair, track length, and the number of train stations) is
obtained through the AHP technique. These weights are then used in the TOPSIS
model (thus having a hybrid model) to select the best route between the two
cities.
There
was an online survey from September-December 2017 for about 100 respondents.
The survey was for selecting the best alternative mode of transportation (bus,
rail, and airline). The respondents were asked to indicate their preferences
for a particular mode of transportation on a scale of 1-10 (1 for minimum and
10 for maximum) based on specific criteria such as speed, travel cost,
the population of the cities through which the alternative travel, number
of stops (number of stations), environmental pollution, safety
and security, and finally, benefits to the public of each
alternative. This information was used to obtain the weight for these criteria
and then applied in TOPSIS (explained in Section 5.1) for the mode choice
decision.
The
route choice decision is made as follows: Once we select the best mode of
transportation, we optimize their route choice based on several criteria (such
as track length and number of stations); thus, a hybrid model (AHP-TOPSIS) is
used in which information from the AHP is feeder in TOPSIS to select the best rail
route to connect the two cities (Section 5.2)
5.1. Mode choice decisions: TOPSIS model
In
TOPSIS, there are two weights; the attribute weights assigned to each attribute
or criteria based on their importance and the weights assigned to each
alternative for each criterion. The survey respondents recorded their opinion
on the significance of each attribute. The survey questionnaire recorded the
importance of each attribute on a 1 – 10 scale. One
referred to the highest for the negative attributes like travel cost and
environmental pollution. Whereas, One for the positive attributes
referred to the lowest score. Afterwards, the weighted mean average for each
attribute was calculated and then used as criteria weights.
The
results indicated that speed and safety/security had been
assigned the maximum weight of 8. This is obvious given that timely
arrival is the most preferred attribute for any traveller (mostly for long
distances), and safety/security concern is also understandable being that
Pakistan has, in recent times, faced terrorist attacks on travellers. The other
notable higher weight criteria were benefits to the public (weight 7),
environmental pollution (weight 6), and travel cost (weight 5), respectively.
These weights have been directly used in TOPSIS.
5.2. Application of TOPSIS
There
are three modes of transportation, and each mode of transportation is checked
for five different criteria, as shown in Figure 2. The survey questionnaire
asked the public about the preference they would give to each alternative
concerning each criterion on a scale of 1-10. The survey results indicate that
aeroplanes have the highest rank on the speed criteria, the train (with
improved speed after CPEC investment) was ranked second highest, followed by
the bus being the last. On the other hand, travel costs being a negative
criterion ranked airlines the worst. However, improved train services in the
post-CPEC intervention as second, while bus travel was the best; for
environmental pollution, travel by train was ranked the best, followed by
airline and bus being the worst. Similarly, the aeroplane was selected as the
best for safety and security, followed by the bus being second and the train
being the worst. Finally, for benefits to the public, train (improved
after CPEC investment in PR) was considered the best followed by the bus and
airline, respectively. These values were used in the TOPSIS decision matrix;
the final matrix showing each alternative's ranking is presented in Table 4.
|
|
Fig.
2. Transportation mode choice and different criteria
Tab.
4.
Final ranking matrix
|
Criteria/Alternative |
Aeroplane |
Bus |
Train (post-CPEC) |
|
Si* (Positive) |
1.870 |
1.401 |
2.736 |
|
Si' (Negative) |
2.831 |
2.167 |
2.007 |
|
Si*+Si' |
4.701 |
3.569 |
4.743 |
|
Si'/(Si*+Si') |
0.398 |
0.393 |
0.477 |
The
ranking results in Table 4 show that the train in the post-CPEC investment
intervention is ranked as the best alternative among airlines and buses for the
long-distance Peshawer- Karachi route travels.
These
findings from TOPSIS are plausible. The train (in the post-CPEC investment era)
will provide a high-speed journey at a low cost. Trains are relatively safe/secure
because of fewer terrorist attacks on railways in the past. Furthermore, the environmental
pollution caused by trains is less compared to buses. Furthermore, the population
that would benefit from the train (in the post-CPEC investment era) is larger
than the people that could benefit from the other modes of transportation as
trains travel through all populated cities.
5.3. Route choice decisions: hybrid model
The
selection of a short route for public transport operators is of equal
importance. It saves time, fuel costs, increases trip travel time reliability
and reduces the trip's total travel cost. We now consider four alternative
routes (Table 5) for railways to pick the best route linking Peshawer-Karachi
(ML-1 route) based on the hybrid model (AHP-TOPSIS). Table 5 also presents
various criteria for each route.
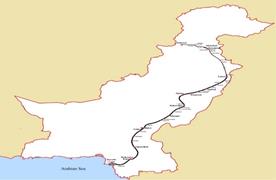
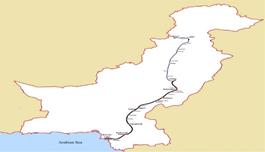
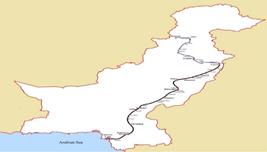
We
used Google Maps to calculate each route's length of track and the number of
bridges. Figure 3 presents the various route options. The population
benefitting from each route was obtained from the Census of Pakistan 2017
To
refine these weights, the AHP technique is used with values entered according
to each route's performance concerning each criterion, and a consistency ratio
was calculated. The weights are readjusted for each case where the consistency
ratio was greater than 0.1. After solving the AHP for each criterion, these
values were entered into the TOPSIS decision matrix.
Then an educated guess was made to assign weights to each alternative in
AHP. This guess was based on the cost/unit associated with each attribute.
Next, through AHP, these values were refined to get more accurate values for
the criteria weights by calculating the consistency ratio. These consistency
ratios are presented in Table 6.
It
is clear that security is assigned with the highest weight (safety is the most
important factor), followed by several bridges (due to high costs) and the
population (people who benefit from the service), respectively. These weights
are then used in TOPSIS to select the best route. The final decision matrix
after TOPSIS has been applied is presented in Table 7.
As
indicated in Table 7, route 3 is the best alternative. Route 3 is selected
because its length is the second lowest compared to other alternative routes.
Besides, route 3 has the highest value for security factors. In addition, the
population being benefited is comparable to other alternative routes.
Tab.
5.
Route choice and selection
criteria
|
|
Track length (km) |
Number of bridges |
Number of
terrorist attacks on route |
Population
(millions) |
|
|
Alternatives |
Route 1 |
1,450 |
21 |
23 |
21.82 |
|
Route 2 |
1,687 |
16 |
27 |
38.01 |
|
|
Route 3 |
1,540 |
18 |
20 |
38.18 |
|
|
Route 4 |
1,827 |
13 |
26 |
24.35 |
|
Tab.
6.
Consistency ratios
|
Criteria |
Consistency Ratio |
|
Length (track length in km) |
0.255 |
|
Bridges (numbers of bridges) |
1.770 |
|
Security (number of terrorist attacks on track route) |
2.406 |
|
Cities (number of cities on track route) |
0.634 |
|
Population (population of cities on track route) |
1.528 |
Tab.
7.
Final ranking matrix
|
Criteria/Alternative |
Route 1 |
Route 2 |
Route 3 |
Route 4 |
|
Si* |
1.861 |
2.138 |
0.450 |
2.679 |
|
Si' |
1.639 |
1.280 |
2.676 |
0.531 |
|
Si*+Si' |
3.501 |
3.419 |
3.126 |
3.210 |
|
S'/(Si*+Si') |
0.468 |
0.375 |
0.556 |
0.165 |
6. DISCUSSION
The
results indicate that rail is the best alternative in the post-CPEC investment
in PR. The primary reason is that after the ML-1 up-gradation under the CPEC
investment, the rail speed (hence travel time) will improve significantly
between Peshawar – Karachi, compared to the current travel time of over
33 hours. The travel time improvement will make the rail more competitive
compared to bus and air travel. Additionally, railways can produce more
passenger miles compared to buses and airlines, keeping other things constant.
The railways would also become more economical with improved travel time
reliability.
This
study can conclude that PR will have higher revenue (given that PR's primary
revenue source is the ML-1) in the post-CPEC investment in PR. This will not
only reduce their current final losses but perhaps can convert the railways to
a profit-earning public sector enterprise.
The
best route selected is route 3, connecting the following cities on its proposed
route from Karachi to Peshawer; Karachi à
Hyderabad à
Nawab Shah à
Sukkur à
Rahim Yar Khan à
Khanpur à
Bahawalpur à
Multan à DI
Khan à
Mianwali à
Jand à
Basal à
Taxila à
Attock à
Nowshehra à
Peshawar. There are various reasons for this route being the best PR route in
the post – CPEC investment in PR. First, this route is safer as fewer
attacks have been reported on this track in past years. This automatically
induces potential rail travellers to use other transportation modes on the same
route for safety reasons. Second, the route is the shortest in track length,
reducing the repair and maintenance cost, and ensuring faster travel. Finally,
the selected routes cover about 38 million people (the cities on route) on a
higher side than other alternative routes. Thus, these collectively make route
3 the more attractive route among all considered routes for PR while making its
trip from Karachi to Peshawar.
|
|
|
|
Route 1 via Karachi-Sukkar-Jacobabad-Multan-Mianwali-Peshawar |
Route 2 via
Karachi-Sukkar-Lahore-Rawalpindi-Peshawar (Proposed by CPEC) |
|
|
|
|
Route 3 via Karachi-Lodhran-Multan-Mianwali-Peshawar |
Route 4 via
Karachi-Sukkar-Lahore-Gujranwala-Miawali-Peshawar |
|
Fig. 3. Alternative routes |
|
Pakistan
Railways have suffered losses, becoming less competitive than airlines and
buses over the last few decades. Pakistan and China started the China –
Pakistan Economic Corridor (CPEC), under which both countries agreed on a US$
50 billion expenditure plan on infrastructure and connectivity in Pakistan by
2030. Besides spending considerable sums on other connectivity projects, CPEC
also looks to spend money on PR, particularly that of up-grading ML-1 links
connecting two cities of Pakistan, namely Karachi and Peshawar.
This
research was undertaken with multiple objectives. First, it aimed to study the
mode choice decision among the three primary public transportation modes: bus,
airline, and the post-CPEC investment in PR. Second, it also studied the best
link route between Karachi and Peshawar for railways. In addition, this work's
novelty uses multi-criteria decision techniques for transportation mode and
route choice decisions. It employed TOPSIS and AHP-TOPSIS (Hybrid model) to
investigate transportation modes and route choice decisions.
The
study concluded that the best public transportation mode is travel by train
(compared to bus and airline) in the post-CPEC investment in PR. The AHP-TOPSIS
hybrid model identified an optimum route for the connection between Karachi
– Peshawar based on the track length, connecting cities, and the
population benefits.
The
study would be useful for researchers working on mode-route choice decisions in
applying MCDM with relatively lesser data requirements. Additionally, it would
be equally useful for policymakers involved in CPEC-related infrastructure
investments of PR. They may consider these findings while making route choice
decisions in the post-CPEC investment in railways. The application of MCDM to
infrastructure-related projects suggests that such techniques can be employed
on decisions related to other infrastructure-related projects of CPEC.
References
1.
Abbas
S. 2018. "Pakistan Railways
Makes Record Loss of 80b Rupees". Daily Morning Mail, Newspaper. December 18, 2017. Available at:
http://morning.pk/2017/12/pakistan-railways-makes-record-loss-80b-rupees/.
2.
Aziz A.H., N.N. Nagle, A.M. Morton,
M.R. Hilliard, D.A. White, R.N. Stewart. 2017. "Exploring The Impact of
Walk–Bike Infrastructure, Safety Perception, And Built-Environment On
Active Transportation Mode choice: A Random Parameter Model Using New York
City Commuter Data". Transportation 45: 1-23. DOI: https://doi.org/10.1007/s11116-017-9760-8.
3.
Ben-Akiva M.E., S.R. Lerman. 1985. Discrete
Choice Analysis: Theory and Application to Travel Demand. MIT Press.
4.
Bhat C.R., R. Sardesai. 2006. "The
Impact Of Stop-Making And Travel Time Reliability On Commute Mode Choice".
Transportation Research
Part B: Methodological 40(9):
709-730.
5.
Böcker L., P. van Amen, M. Helbich.
2017. "Elderly Travel Frequencies And Transport Mode Choices In Greater
Rotterdam, The Netherlands". Transportation 44(4): 831-852.
6.
Boran F.G. 2009. "A multi-criteria intuitionistic fuzzy group
decision making for supplier selection with TOPSIS method".
Expert Systems with Applications 36(8): 11363-11368.
7.
Dissanayake D., T. Morikaw. 2010. "Investigating
Household Vehicle Ownership, Mode Choice, And Trip Sharing Decisions Using A
Combined Revealed Preference/Stated Preference Nested Logit model: Case Study
In Bangkok Metropolitan Region". Journal of Transport Geography 18(3): 402-410.
8.
Dissanayake D., T. Morikawa. 2002. "Household
Travel Behavior in Developing Countries Nested Logit Model of Vehicle
Ownership, Mode Choice, and Trip Chaining". Journal of the Transportation Research Board 1805(1): 45-52.
9.
Fleurent C., S. Voß. 2011.
“Public transport: case studies and applications”. Public Transport 3: 105-107.
10. Földes, D., C.
Csiszár. 2015. "Route plan evaluation method for personalised
passenger information service". Transport
30(3): 273-285. DOI: https://doi.org/10.3846/16484142.2015.1086889.
11.
Hamurcu M., S. Gur, E.H. Ozder,
E. Tamer. 2016. "A Multicriteria Decision-Making for
Monorail Route Selection in Ankara". International Journal of Industrial Electronics and
Electrical Engineering 3(7):
121-125.
12.
Hensher A.D., J.M. Rose, W.H. Greene.
2007. Applied Choice Analysis A Primer. Third Edition. Cambridge University Press.
13.
Ivona Z.N., M.K. Zoran, S.Z.
Zlatko. 2017. "Application of different methods of
multicriteria analysis for railway route selection". Tehnika 72(6): 797-805.
14.
Jayant A.G. 2014. "TOPSIS-AHP
based approach for selection of reverse logistics service provider: a case
study of mobile phone industry". Procedia
Engineering 97: 2147-2156.
15.
Johanssonab M.V., T. Heldt, P. Johansson.
2006. "The Effects of Attitudes And Personality Traits On Mode Choice".
Transportation Research
Part A: Policy and Practice 40(3): 507-525.
16.
Karahalios H. 2017. "The
application of the AHP-TOPSIS for evaluating ballast water treatment systems
by ship operators". Transportation
Research Part D: Transport and Environment 52: 172-184.
17. Keršys
A., A. Jurkauskas. 2003. "Search of the route in the network of public
communication using a linear sequence method". Transport 18(3): 130-135. DOI:
https://doi.org/10.3846/16483840.2003.10414081.
18.
Kosijer M., M. Ivic, M. Markovic, I.
Belosevic. 2012. "Multicriteria decision-making in railway route planning
and design". Gradevinar 3: 195-205.
19.
Larsen K., R. Buliung, G. Faulkner. 2013.
"Safety and School Travel: How Does the Environment Along the Route
Relate to Safety and Mode Choice?" Transportation Research Record: Journal of the
Transportation Research Board 2327: 9-18.
20. McFadden
D. 1974. "Conditional Logit Analysis Of Qualitative Choice Behavior".
In: Zarembka P. Frontiers in Econometrics: 105-142. Academic Press, New York, USA.
21.
Meixell M.J., M. Norbis. 2008. "A
Review Of The Transportation Mode Choice And Carrier Selection Literature".
The International Journal
of Logistics Management 19(2):
183-211.
22.
Mo F. 2018. Economic Survey
2017-18. Ministry of Finance, Government of Pakistan, Islamabad. Available at: http://www.finance.gov.pk/survey/chapters_17/13-Transport_and_Communications.pdf.
23.
Pakistan
Railways.
2018. Pakistan Railways, Government
of Pakistan, Ministry of Railways, Islamabad, Pakistan. Available at: https://www.pakrail.gov.pk/AboutUs.aspx.
24.
PBS. 2017. Pakistan Bureau of
Statistics, Population Census 2017. Government
of Pakistan, Islamabad, Pakistan. Available at: http://www.pbscensus.gov.pk/.
25.
PC. 2018. Planning Commission,
China Pakistan Economic Corridor (CPEC) offical Website. Available at:
http://cpec.gov.pk/infrastructure.
26.
Prato C.G. 2009. "Route choice
modeling: past, present and future research directions". Journal of Choice Modelling 2(1): 65-100.
27.
Prato C.G. 2009. "Route Choice
Modeling: Past, Present and Future Research Directions". Journal of Choice Modelling 2(1): 65-100.
28. PRC.
2015. People Republic of China, Offical Website. Chronology of
China’s Belt and Road Initiative. The State Council, the People'S
Republic of China. Available at: http://english.gov.cn/news/top_news/2015/04/20/content_281475092566326.htm.
29. Rojas-Cuevas
Irma-Delia, Santiago-Omar Caballero-Morales, Jose-Luis Martinez-Flores,
Jose-Rafael Mendoza-Vazquez. 2018. „Capacitated vehicle routing problem
model for carriers”. Journal of
Transport and Supply Chain Management 12(a345).
30.
Saaty T.L. 1980. Multicriteria
Decision Making: The Analytic Hierarchy Process. New York: McGraw Hill.
31.
Saaty T.L. 2008. "Decision
Making With The Analytic Hierarchy Process". International Journal of Services
Sciences 1(1): 83-98.
32.
SATP. 2018. South Asia Terrorism
Portal, Institute for Conflict Management, New Delhi, Delhi, India,
Asia-Pacific (APAC). Available
at: http://www.satp.org/.
33.
Scheiner J., C. Holz-Rau. 2013. "A
comprehensive Study Of Life Course, Cohort, And Period Effects On Changes In
Travel Mode Use". Transportation
Research Part A: Policy and Practice 47: 167-181.
34. Srinivasan
K., P. Bhargav, G. Ramadurai, V. Muthuram, S. Srinivasan. 2007. "Determinants
of Changes in Mobility and Travel Patterns in Developing Countries: Case Study
of Chennai, India". Journal of the Transportation Research Board,
Transportation Research Record 2038:
42-52.
35.
Sun B., A. Ermagun, B. Dan. 2017. "Built
Environmental Impacts On Commuting Mode Choice And Distance: Evidence From
Shanghai". Transportation Research
Part D: Transport and Environment 52B: 441-453.
36.
Train E.K. 2009. Discrete Choice
Methods With Simulation. Cambridge
University Press, UK.
37.
Tsaur S.C. 2002. "The evaluation of airline service quality
by fuzzy MCDM". Tourism Management 23(2): 107-115.
38. Tsekeris Theodore, Stefan Voß. 2010. “Public
transport and road pricing: a survey and simulation experiments”. Public Transport 2: 87-109.
39.
Yai T., S. Iwakura, S. Morichi.
1997. "Multinomial
probit with structured covariance for route choice behavior". Transportation Research Part B:
Methodological 31(3): 195-207.
Received 11.01.2022; accepted in
revised form 28.02.2022
![]()
Scientific Journal of Silesian University of Technology. Series
Transport is licensed under a Creative Commons Attribution 4.0
International License