Article
citation information:
Caban, J. Traffic congestion level
in 10 selected cities of Poland. Scientific
Journal of Silesian University of Technology. Series Transport. 2021, 112, 17-31. ISSN: 0209-3324. DOI: https://doi.org/10.20858/sjsutst.2021.112.2.
Jacek CABAN[1]
TRAFFIC
CONGESTION LEVEL IN 10 SELECTED CITIES OF POLAND
Summary. Transport has a great
impact on human activities but contributes to many negative phenomena occurring
in road traffic, for example, road traffic accidents, emission of toxic exhaust
fumes into the atmosphere and a high share of cars in road traffic. For the
above reasons, many initiatives have been taken in the field of road traffic
management and urban logistics. Based on a literature review, it was found that
the problem of the phenomenon of traffic congestion in urban areas remains an
ongoing issue. In the first part of this article, the theoretical issues of
traffic flow and congestion formation in the city road networks were presented.
While the second part outlines the situation of transport congestion in 10
Polish cities based on the worldwide TomTom Traffic Index in the years
2008-2018. This study is a brief analysis of the trends relating to transport
congestion based on the TomTom Traffic Index in these cities.
Keywords: city logistics, economic, extra travel time,
TomTom Traffic Index
1. INTRODUCTION
Nowadays, transport plays an important role in
the economy and life of people. The transport sector is influenced by a wide
range of external social and economic factors such as demographics, living
standards of the population, urban planning, organisation
of production, structural changes in the society and accessibility to transport
infrastructure [55]. From the point of view of proper development of the
economy, transport infrastructure plays a huge role. The region's development
depends on its transport accessibility. To satisfy the needs of society,
transport is carried out using a variety of transport systems, depending on the
predisposition of the population and the susceptibility of transport of goods
and cargo. Inhabitants of the city have public transport at their disposal
(road or rail), individual vehicles, taxi, cycling transport or on foot. One of
the possibilities of sustainable transport is non-motorised
transportation, namely, cycling transport, with the inclusion of cycling in
urban transport [26, 44]. In many European cities, there is a city bike system
that complements the existing transport network, for example, Amsterdam,
Berlin, Brno, Bucharest, Copenhagen, Lublin, Warsaw, Zilina. Cycling transport is a mode of transport that
provides efficient transport requirements especially for short as well as long
distances [26]. It can also be an alternative for the bored driver’s
phenomenon of traffic congestion in urban areas.
The transport market does not have an equal
status in the transport market within the European Union [4, 38].
Transportation of goods and people is a fundamental concern of modern societies
[54]. Public transport plays a relevant role in urban areas as it conveys
passengers to schools, public healthcare establishments and work. It is also an
alternative to using cars. Considering the aforementioned information on the
use of vehicles for public transport, more attention has been drawn to the use
of alternative fuels. The use of alternative fuels is one of the recent main
solutions allowing the reduction of pollutant emissions [8]. In many scientific
papers, the subject of research is using various alternative fuels [23, 33, 43],
and reduction in the consumption of lubricating oils and plastic lubricants [31].
A comprehensive explanation of the selected problems of the efficiency of
public transport can be found in detail in other scientific articles [15, 46, 47].
Transport needs in the urban area are similarly
associated with the supply of shopping centre goods,
public buildings or small local stores. These tasks are carried out utilising appropriately selected means of transport (trucks
and delivery vehicles). Vehicles of this type limit visibility to other road
users, take up a lot of space and hinders manoeuvrability,
which is particularly severe in crowded city centres.
Transport of cargos via small commercial vehicles within Central Europe is very
common [35]. More information about the use of heavy goods vehicles on city
road infrastructure and its issues in transport safety, such as the vehicle
load, vehicle speed and curve radius, can be found in the following literature:
[2, 42, 49].
Environmental impacts of transport are unfavourable and often have an unavoidable character [50,
51]. It is necessary to take a different look at the state, region and city
transport policies due to factors such as expanding transport requirements,
increasing number of congestions, and negative impacts on quality of life [16,
17, 25, 48]. This new approach, to meet the
requirements of sustainable transport and functional usage of both city and
regional area, must accept the elimination of negative factors, such as air
pollution, increasing risk of transport accidents with its negative impacts,
waste of time of public transport, etc. [25]. In contrast, transportation
problems related to traffic accidents are constant problems constantly
addressed by the scientific community, as evidenced by numerous publications in
this area [9, 13, 18, 19, 32, 34, 39]. Many
traffic accidents are due to an incorrect assessment of the current situation by
the driver of the vehicle [42].
Transport is an area with obvious and perceived
problems such as noise, air pollution, traffic congestion and health problems [26].
Car travel is related to climate change, depending on fossil fuels, and traffic
congestion [14]. For a growing number of developing cities, the capacities of
streets cannot meet the growing demand for cars, thus causing traffic
congestion [57]. More information on some solutions in road infrastructure can
be found in the following literature: [19, 29]. The phenomenon of transport
congestion has been the subject of several scientific research, for example,
[7, 37, 57]. Congestion mainly arises in or near
densely populated areas with high levels of car ownership, such that the road
capacity is insufficient to accommodate all the trips that might be made,
particularly during morning and evening travel to and from work [36]. Most
drivers of individual vehicles travel the same route throughout the week, which
can be called a routine route. Some of them, due to the impatience of waiting
in traffic gridlocks, look for an alternative route to the current routine
route. Measures to tackle congestion, whether by increasing capacity or
managing demand, need to allow for the possibility of faster journeys leading
to more and/or longer trips being made by road users previously deterred by the
expectation of time delays [36].
The presented transport issues show the
importance of transport and its numerous needs in urban areas. However, there
are positive factors, as well as negative factors associated with the movement
of residents. The main aim of this study is to show the trends related to the
occurrence of the phenomenon of transport congestion in selected Polish cities
and the possibility of limiting it in the urban zone. In the further part of
this article, statistical data on the level of traffic congestion in Polish
cities are presented based on the TomTom Traffic Index. The possibilities of
limiting the negative impact of transport on the urban environment and
residents were demonstrated, as well as the possibilities of limiting traffic
congestion through the integrated actions of the local governments in the area
of urban transport.
2. TRAFFIC CONGESTION
Traffic congestion is probably the
main problem of the transport system in urban zones in recent times. Congestion
causes global concerns, such as increased commuting times and fuel usage as
well as environmental deterioration [57]. The negative effect caused by traffic
congestions is most notable in large cities, where traffic density is
relatively high, with a characteristically low and often variable speed
(acceleration and deceleration) [41]. While there are considerable
technological and policy opportunities for tackling the detriments associated
with pollution from vehicle emissions and road traffic accidents, congestion
seems a more intractable challenge [36]. Among the causes of traffic
congestion, we can distinguish physical and psychological factors. Physical
causes measure traffic, speed and density of the street. Psychological factors
are more difficult to measure and each driver accepts a different level of
congestion. Some drivers accept slight traffic congestion, whereas others do
not, thus causing more stress for them. Traffic congestion is a complex
spatial-temporal process [22]. Congestion can be recurrent (regular, occurring
on a daily, weekly or annual cycle) or non-recurrent (traffic incidents, such
as accidents and disabled vehicles) [27]. Congestion in the urban zone can be
considered as a phenomenon on a local and global scale. Local congestion, such
as single interactions, only decreases the velocity of individual vehicles,
whereas global congestion often decreases the velocity of the overall street
network and requires additional traffic control [56].
Factors that cause congestion can be
related to microeconomic considerations for road infrastructure [21]. They may
also be affected by the macroeconomic phenomena related to the demand for road use
and depending on a set of realities related to the modes and volumes of traffic
[21]. Random variables like weather, visibility, driver behaviour are major
factors that explain the intensities of congestion [21].
The travel time index (TTI) [10] given by the Texas Transportation Institute
compares the travel time rates in the peak period and travel time rate during
free flow. TTI is calculated as given below:
![]() (1)
(1)
Traffic congestion in the urban area
is common in large agglomerations as well as in medium-sized cities. This
phenomenon is characteristic of cities with a high level of socio-economic
development. In cities, we usually deal with a large concentration of transport
needs in the same time and space that occur with a certain periodicity and is
particularly severe in city centres area. William Vickrey
[56] identified six types of congestion:
· simple interaction on homogeneous
roads: where two vehicles travelling close together delay each other;
· multiple interactions on homogeneous
roads: where several vehicles interact;
· bottlenecks: where several vehicles
struggle to pass through narrowed lanes;
· “trigger neck”
congestion: when an initial narrowing generates a line of vehicles interfering
with a flow of vehicles not seeking to follow the jammed itinerary;
· network control congestion: where
traffic controls programmed for peak-hour traffic inevitably delay off-peak
hour traffic;
· congestion due to network morphology, or polymodal polymorphous congestion: where traffic congestion
reflects the state of traffic on all itineraries and for all modes. The cost of
intervention for a given segment of a roadway increases through possible
interventions on other segments of the road, due to the effect of triggered
congestion.
Traffic congestion has been studied
at three levels over the past decades, namely, the regional level, the road
level, and the lane level [20]. At the regional level, the relationships
between regional traffic congestion and urban form are explored for improving
management and planning strategies [1, 53]. Most existing studies examine
traffic conditions at the road level. In earlier studies, traffic data were
acquired from infrastructure sensors installed in some road segments, such as
loop detectors [6, 24] and video cameras [5] from which traffic volumes and
traffic flow speed were obtained too [20]. However, the limitation of these
fixed sensors is that these technologies are expensive and can cover only
limited areas and are not representative of the traffic conditions over larger
areas. In recent years, cooperative vehicular systems such as
Vehicle-to-Vehicle (V2V) and
Vehicle-to-Infrastructure (V2I) communications are
explored in innovative Intelligent Transportation Systems (ITS) for traffic
condition monitoring [3, 40, 59]. Whereas V2V or V2I communications improve
the accuracy of traffic congestion detection, additional costs for installing
such communication systems in vehicles are needed [20]. Consequently, these
solutions have not found a wider application in practice. Traffic bottlenecks
determined based on GPS data are detected at the level of the road section, and
not on the lane level.
Presently, the rapid development of
technology, positioning and collection data/storage increases the application
of GPS tracking in the fields of traffic and engineering. GPS data contains a
wealth of information about the travel patterns of people and actual traffic
conditions. Thanks to the mentioned advantages of GPS devices, one can analyse
data regarding the dynamics of traffic flow. This technology is similarly
used in the TomTom Traffic Index study, based on which the results of traffic
congestion levels are published in many countries around the world.
3. DATA AND METHODS
In the world ranking of the TomTom
Traffic Index (TTTI), cities with different numbers
of inhabitants are compared. The cities were divided into three groups
according to population sizes: up to 800,000, over 800,000 and above 2 million
inhabitants.
Worldwide congestion ranking data TTTI for 10 selected Polish cities was used for this study.
TTTI is published to provide drivers, industry and
policy makers with unbiased information about congestion levels in urban areas
[12]. The data for these cities was obtained from TTTI
reports published on their website [12]. In addition, the following parameters
of traffic flow in the cities were investigated: extra travel time, traffic
speed, live traffic speed, morning and evening peak, congestion level depending
on the type of road, and time of the peak in individual cities.
To avoid misunderstandings during
the data analysis, the terminologies used in this research are presented and
defined. The factors definitions given below are based on TTTI
and used in this paper:
Congestion level can be defined as the increase in overall travel times when compared to
a Free Flow (uncongested) situation [12].
Extra travel time can be defined as the extra travel time during peak hours versus an
hour of driving during a Free Flow (uncongested) situation [12]. Multiplied by
230 days for the annual figure.
Morning peak
can be defined as the increase in morning peak travel times when compared to a
Free Flow (uncongested) situation [12].
Evening peak
can be defined as the increase in evening peak travel times when compared to a
Free Flow in an uncongested situation [12]. The hours of morning and evening
peak may vary in different cities depending on the day of the week. In most
cases, within a week they are the same for the city in question.
Road network length is the total length of the evaluated road network including highways
and non-highways, expressed in kilometres or miles.
Live traffic delay is the current total time of delays in all jams on all monitored roads
in the city area.
Live traffic speed is the current average speed on all monitored roads in the city area
based on the TomTom Traffic Flow information [12]. These last two parameters include
highways, major roads and minor roads.
For 10 selected cities in Poland, a
comparison of transport congestion indicators over a period of 10 years
(2008-2018) was carried out. The situation in the following cities was
analysed: Warsaw, Wroclaw, Krakow, Poznan, Lodz, Szczecin, Katowice, Tricity, Bydgoszcz and Lublin.
4. RESULTS AND DISSCUSSION
Table 1
presents selected data on population and vehicles and the available transport
network, for compared cities from 2017. A characteristic feature of all Polish
cities is the dynamic increase in the level of motorisation of the society
and a decrease in the volume of transport services in public transport.
Therefore, the number of cars per capita and the intensity of street traffic is
still increasing, leading to the occurrence of traffic congestion and a
significant increase in travel time. According to Eurostat data, in 2015, the
motorisation rate in Poland amounted to 546 cars per 1000 inhabitants, compared
to 323 in 2005. This means that currently, statistically, more than every
second Pole has a car [30].
Tab. 1
Selected data for 10 compared cities in 2017 [11, 12, 52]
|
City |
Number of inhabitants in thous. |
Area in [km2] |
Number of registered vehicles |
Total road network length [km] |
Highways [km] |
Non-Highways [km] |
|
Warsaw |
1764,6 |
517 |
1,519,596 |
8,019 |
320 |
7,699 |
|
Wroclaw |
638,6 |
293 |
518,181 |
3,099 |
124 |
2,975 |
|
Krakow |
767,3 |
327 |
568,808 |
3,681 |
107 |
3,574 |
|
Poznan |
538,6 |
262 |
469,411 |
4,147 |
218 |
3,929 |
|
Lodz |
690,4 |
293 |
452,952 |
3,271 |
84 |
3,187 |
|
Szczecin |
403,9 |
301 |
262,868 |
2,448 |
91 |
2,357 |
|
Katowice |
296,3 |
165 |
261,360 |
13,719 |
412 |
13,307 |
|
Tricity |
747,1 |
414 |
538,780 |
4,826 |
76 |
4,75 |
|
Bydgoszcz |
352,3 |
176 |
249,020 |
2,872 |
146 |
2,725 |
|
Lublin |
339,9 |
147 |
228,977 |
3,634 |
109 |
3,525 |
The investigation of the occurrence
of traffic congestion was based on the measurement of the speed of passage of
particular sections of roads, determined on the GPS data collected in real-time
from moving vehicles. For individual cities, average delays are calculated due
to congestion (extra travel time), the average speed of vehicles during
communication peaks on the entire road network covered by the survey (and
optimal traffic speed) and the largest bottlenecks. The delay indicator due to
traffic congestion level is calculated in relation to the free passage time without
any difficulties.
Figure 1 presents a comparison of
the traffic congestion level indicator for 10 cities in Poland in 2018.
The comparison shows that the most
difficult situation occurs in the cities of Warsaw, Wroclaw, Krakow, Lodz and
Poznan, where they reach about 70% during morning rush hours (Warsaw, Krakow),
and during the afternoon traffic summit they exceed 80% (Warsaw, Wroclaw,
Krakow, Lodz). The best situation is in Katowice (traffic congestion level
below 30%).
Figure 2 presents the extra travel
time per day and year for the compared Polish cities in 2016.
The analysis of data presented in
Figure 2 shows that the smallest losses caused by the phenomenon of traffic
congestion occurred in Katowice – 17 minutes (65 hours per year) and
Szczecin – 25 minutes (97 hours per year). In two cities, the additional
travel time is 32 minutes (Bydgoszcz and Tricity).
Four cities have a similar level of time loss ranging from 36 to 38 minutes
(Lublin, Poznan, Wroclaw, Krakow). The most difficult
situation occurred in Warsaw – 41 minutes extra travel time and Lodz
– 46 min. The smallest losses in annual terms occurred in the cities of
Katowice and Szczecin. In two cities, Bydgoszcz and Tricity,
annual losses were around 120 hours. Lublin, Poznan and Wroclaw oscillate
around 140 hours per year. The biggest time losses occurred in Lodz – 178
hours per year.
Figure 3 shows the impact of the
number of registered vehicles in different cities and transport congestion
level expressed as a percentage.
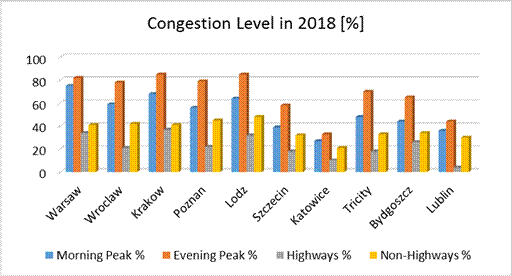
Fig. 1. Traffic congestion level for
compared cities in 2018
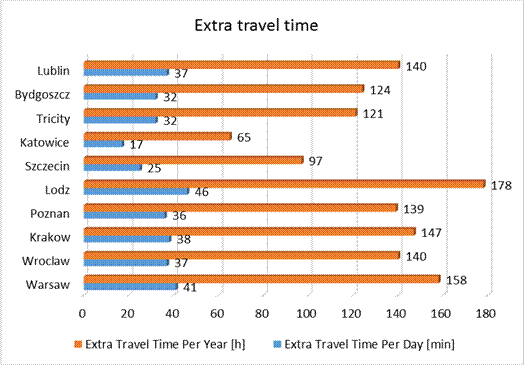
Fig. 2. Extra travel time per day
and year for the compared cities in 2016
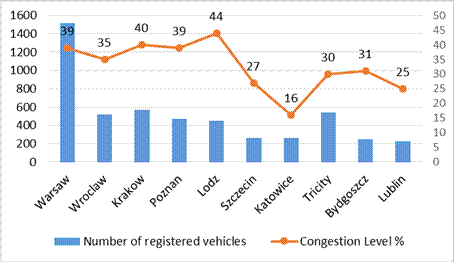
Fig. 3. Traffic congestion level
(2018) and number of registered vehicles (2017) for the compared cities
Based on the analysis of the data
presented in Figure 3, it can be concluded that in most cities, traffic
congestion depends on the number of registered vehicles. This trend is not
confirmed in the case of the city of Warsaw, where a huge number of vehicles
(compared to other cities) corresponds to a moderate level of traffic
congestion. Similarly, in the case of the city of Katowice, the moderate number
of registered vehicles corresponds to the lowest level of transport congestion
(16%).
Figure 4 presents a graph of the
optimal value of traffic speed in 2016 for 6 compared cities, however, this
value was not included for four cities in the TomTom database. The lowest
optimal speed of vehicle traffic was in Warsaw – 36 km/h, and the highest
in the city of Lodz – 45 km/h. Although the value of optimal speed is the
highest in the city of Lodz, it is still the most crowded city in Poland.
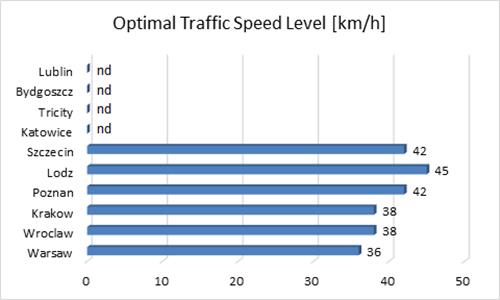
Fig. 4. Optimal traffic speed level for
the compared cities in 2016
The historical data about traffic
congestion level expressed by extra travel time (in percent) in the period of
time from 2008 to 2018 is shown in the graph in Figure 5.
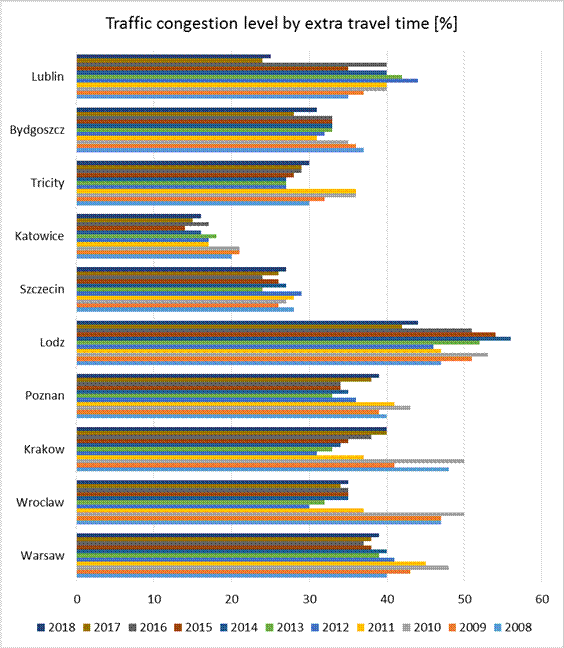
Fig. 5. Traffic congestion level
expressed by extra travel time in the compared cities
Based on the data presented in
Figure 5, it can be concluded that over the years, the level of traffic
congestion fluctuates in Lublin, Lodz and Poznan. In several cities, traffic
capacity improved in the period under consideration (Bydgoszcz, Tricity, Katowice, Krakow, Wroclaw, Warsaw).
In Szczecin, on the other hand, the situation regarding the extra travel time
indicator is practically stable. The worst situation in road traffic capacity
is in Lodz, which ranks 15th among the most crowded cities in the world TTTI ranking. The presented summary also shows that in
2018, the traffic congestion level increased in 9 cities, and only in Krakowwas it recorded the same as in the previous year.
In Figure 6, the graph of live
traffic speed for the last 48 hours is presented compared to the average speed
of vehicles and optimal traffic speed, on the example of the city of Lodz.
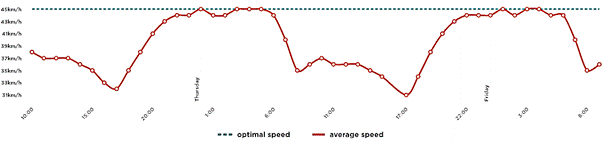
Fig. 6. Live traffic
speed for the last 48 hours of the city of Lodz [12]
As can be seen from the chart shown
in Figure 6, the average speed of vehicles is far from the optimal traffic.
Based on a 48-hour data logging interval, it can be seen that only in the night
period that these speeds may coincide. The periods of the morning and evening
communication peak are clearly visible. A similar situation regarding the
comparison obtained average speed of vehicles and optimal traffic speed is
observed in the other analysed cities.
Several measurements applications
could significantly reduce traffic congestion level in the city: the
implementation of various telematics systems as well as the correct setup and
synchronisation of traffic light signalising at intersections (that is,
creating a “green wave”), increasing the capacity of roads and
construction of others, traffic regulation, limiting the right of entry to
certain areas, or charging of the traffic within the city areas [28]. As noted
by many authors [3, 5, 24, 25, 37, 59], intelligent transport systems are very
important in reducing traffic congestion levels in urban agglomerations.
Intelligent transport systems in the form of traffic light synchronisation
(green wave) and a system for informing drivers about obstacles through
information boards are some of the ways to combat congestion. Such solutions
occur in most Polish cities. Another way to reduce the phenomenon of traffic
congestion is represented by the development of park and ride facilities, for
users that are coming from the extra-urban area [45]. This system worked
successfully in Katowice, where leaving the vehicle and using public transport
does not incur additional travel costs, just a ticket from the parking lot.
Another option is to replace individual motor vehicles with alternative urban
transport systems such as city bikes available in Warsaw and Lublin. Of course,
this is not a satisfactory solution that can be implemented by all vehicle
owners; nevertheless, it allows reducing traffic congestion. It should be
emphasised, however, that the phenomenon of traffic congestion may occur in
places where, hitherto, there have been no impediments to the flow of vehicles.
5. CONCLUSIONS
Currently, the phenomenon of congestion is
particularly onerous for traffic users (individual drivers, suppliers of stores
and institutions, couriers, etc.), and indirectly influences effects of
agglomeration on the well-being of residents as evident in noise and bad air
quality. Congestion in urban areas is presently one of the most pressing
problems in transport [27]. We conclude, that on the current level of demand
for transport and the development of private cars, a complete elimination of
the phenomenon of traffic congestion in the cities seems impossible to achieve.
Therefore, in the case of problems related to traffic flow, the generally
accepted direction of activities is to bring traffic congestion to an
economically justified and acceptable level by transport users.
The comparison of 10 Polish cities shows that it is possible to reduce the
level of traffic congestion in urban areas. Although efforts by the municipal
authorities produce positive effects, it is, however, an ever-changing
environment, susceptible to transport disruptions. Effective management of
traffic flow in the city is a very difficult and demanding task but extremely
necessary to modern agglomerations. As already mentioned, many factors influence the
reduction of traffic congestion in urban areas. One of them is the use of ITS and the building of modern infrastructure, considering
current and future transport needs. Due to the modernisation
and reconstruction of existing congested transport hubs, it is possible to
limit traffic congestion. A good example of this is the city of Lublin, where
due to the reconstruction of several critical points of the communication
network and the city beltway, the traffic congestion level has been reduced
since 2017. Detailed analysis of solutions applied in the individual cities can
contribute to the application of positive solutions and create effects in the
form of limiting the traffic congestion level in urban areas. However, this
approach requires further analysis and scientific considerations in the future.
References
1.
Arnott Richard, Eren Inci. 2010. „The stability of downtown parking and traffic
congestion”. Journal of Urban
Economics 68(3): 260-276. ISSN: 0094-1190. DOI: 10.1016/j.jue.2010.05.001.
2.
Bańka, Mariusz, Paweł Droździel, Aleksander Nieoczym. 2019. „Lashing methods - mathematical basis of the process of
selecting the number of lashings”. In: Proceedings of 23rd International Conference. Transport Means 2019,
Proceedings Part 1: 99-103. ISSN: 1822-296 X.
3.
Bauza Ramon, Javier Gozálvez. 2013. „Traffic congestion detection in large-scale scenarios using
vehicle-to-vehicle communications”. Journal
of Network and Computer Applications, 36(5): 1295-1307. ISSN: 1084-8045. DOI: 10.1016/j.jnca.2012.02.007.
4.
Bukova Bibiana,
Eva Brumercikova, Pavol Kondek. 2016. „Determinants of the EU transport market”. In: Proceedings of the 2016 International
Conference on Engineering Science and Management (ESM). Edited by: Cheng W.
AER-Advances in Engineering Research
62: 249-252. ISBN: 978-94-6252-218-3. ISSN: 2352-5401. DOI: 10.2991/esm-16.2016.58.
5.
Cho Young, John
Rice. 2006. „Estimating velocity fields on a freeway from
low-resolution videos”. IEEE
Transactions on Intelligent Transportation Systems 7(4):
463-469. DOI: 10.1109/TITS.2006.883934.
6.
Coifman Benjamin. 2003. „Identifying the onset of congestion rapidly with
existing traffic detectors”. Transportation
Research Part A: Policy and Practice 37(3): 277-291. ISSN: 0965-8564. DOI: 10.1016/S0965-8564(02)00016-2.
7.
Farooq Danish, Tayyab Akram. 2018. „Traffic flow analysis and solutions to ease traffic
flow at unsignalized Taxila
intersection”. Periodica Polytechnica
Transportation Engineering 46(2): 101-107. ISSN: 0303-7800. DOI: 10.3311/PPtr.10415.
8.
Flekiewicz Marek, Grzegorz Kubica. 2017. „The influence of selected gaseous fuels on the
combustion process in the SI engine”. Transport
Problems 12(3): 135-146. ISSN: 1896-0596. DOI:
10.20858/tp.2017.12.3.13.
9.
Figlus Tomasz, Tomasz Czachor. 2018. „Preliminary studies of the effect of travelling speed
and propulsion type on the sound level in the passenger compartment of a
vehicle with a hybrid propulsion system”. In: 11th International Science and Technical Conference Automotive Safety:
1-5. ISBN: 978-1-5386-4579-6. DOI: 10.1109/AUTOSAFE.2018.8373346.
10.
HCM Highway Capacity Manual. TRB, National Research Council, Washington,
D.C. 2000.
11.
Statistics Poland.
Available at: https://bdl.stat.gov.pl/BDL/dane/podgrup/tablica.
12.
TOMTOM. Available
at: https://www.tomtom.com/en_gb/trafficindex/.
13.
Hudak Martin, Radovan Madlenak. 2016. „The research of driver's gaze at the traffic
signs”. In CBU International Conference Proceedings 2016,
Innovations in Science and Education: 896-899. DOI:
10.12955/cbup.v4.870.
14.
Hurtova Ivana, Marie Sejkorova, Jan Verner, Michal Kucera.
2018. „Preference and area coordination of public transport
in modern city”. In: 17th
International Scientific Conference Engineering for Rural Development “ERD 2018” 17.
Jelgava, Latvia.
23-25 May 2018. DOI: 10.22616/ERDev2018.17.N345.
15.
Ignaciuk Piotr, Joanna Rymarz, Andrzej Niewczas. 2015. „Effectiveness of the failure rate on maintenance costs
of the city buses”. Journal of KONBIN 3: 99-108. ISSN: 1895-8281. DOI: 10.1515/jok-2015-0043.
16.
Jacyna M., J. Merkisz.
“Proecological approach to modelling traffic
organization in national transport system”. Archives of Transport 2(30): 43-56.
17.
Jacyna M., M. Wasiak, K. Lewczuk, M. Kłodawski. 2014. “Simulation model of transport system of
Poland as a tool for developing sustainable transport”. Archives of Transport 31(3): 23-35.
18.
Jurecki Rafał Stanisław, Tomasz
Lech Stańczyk, Marek Jacek Jaśkiewicz.
2017. „Driver's reaction time in a simulated, complex road
incident”. Transport 32(1):
44-54. ISSN: 1648-4142. DOI:
10.3846/16484142.2014.913535.
19.
Kampf Rudolf, Ondrej
Stopka, Iveta Kubasakova, Vladislav Zitricky. 2016. „Macroeconomic evaluation of projects regarding the
traffic constructions and equipment”. In: World Multidisciplinary Civil Engineering-Architecture-Urban Planning
Symposium 2016, WMCAUS 2016, Procedia Engineering
161: 1538-1544. ISSN: 1877-7058. DOI: 10.1016/j.proeng.2016.08.623.
20.
Kan Zihan,
Luliang Tang, Mei-Po Kwan, Chang Ren, Dong Liu, Qingquan Li. 2019. „Traffic congestion analysis at the turn level using Taxis' GPS
trajectory data”. Computers,
Environment and Urban Systems 74: 229-243. ISSN: 0198-9715. DOI: 10.1016/j.compenvurbsys.2018.11.007.
21.
Karim Lamia, Abdellah Daissaoui, Azedine Boulmakoul. 2017. „Robust routing based on urban traffic congestion
patterns”. Procedia Computer
Science 109C: 698-703. ISSN: 1877-0509. DOI: 10.1016/j.procs.2017.05.380.
22.
Kerner Boris. 1999. „Congested traffic flow: Observations and
theory”. Transportation Research
Record. Journal of the Transportation Research Board 1678(1): 160-167. DOI: 10.3141/1678-20.
23.
Korsakas Vidas, Mindaugas Melaika, Saugirdas Pukalskas, Paulius Stravinskas. 2017. „Hydrogen addition influence for the efficient and ecological parameters
of Heavy-Duty Natural Gas SI engine”. Procedia
Engineering 187: 395-401. ISSN: 1877-7058. DOI: 10.1016/j.proeng.2017.04.391.
24.
Krause Bernhard,
Martin Pozybill. 1997. „Fuzzy logic data analysis of environmental data for traffic
control”. In: 6th IEEE
International Conference on Fuzzy Systems (FUZZ-IEEE 97), Proceedings of the Sixth IEEE 5th International
Conference on Fuzzy Systems I-III: 835-838. ISBN: 0-7803-3797-2.
25.
Križanová Anna.
2008. „The current possition and
perspectives of the integrated transport systems in Slovak Republic”. Eksploatacja i Niezawodnosc – Maintenance and Reliability 4: 25-27.
ISSN: 1507-2711.
26.
Križanová Anna, Juraj Kolencik, Gabriela Masarova, Daniel Buc, 2014. „Study of Provided Telecommunication Services on the Selected
Market”. In: 2014 2nd International
Conference on Economics and Social Science (ICESS
2014), PT 1, Advances in Education
Research 61: 98-103. ISSN: 2160-1070.
27.
Lizbetin Jan, Ladislav Bartuska. 2017. „The influence of human factor on congestion formation
on urban roads”. In: 10th
International Scientific Conference Transbaltica
2017, Transportation Science and Technology, Procedia Engineering 187: 206-211. ISSN: 1877-7058. DOI: 10.1016/j.proeng.2017.04.366.
28.
Lizbetin Jan, Ladislav Bartuska. 2020. „The issue of addressing the lack of parking spaces for
road freight transport in cities - a case study”. Open Engineering 10(1):
209-215. ISSN: 2391-5439. DOI: 10.1515/eng-2020-0025.
29.
Lizbetin Jan, Ondrej Stopka. 2016. „Proposal of a roundabout solution with a particular
traffic operation”. Open
Engineering 6(1): 441-445. ISSN: 2391-5439. DOI: 10.1515/eng-2016-0066.
30.
Ľupták Vladimir, Paweł Droździel, Ondrej Stopka, Mária Stopková, Iwona Rybicka. 2019. „Approach Methodology for Comprehensive Assessing the
Public Passenger Transport Timetable Performances at a Regional Scale”. Sustainability 13(11): 3532. ISSN:
2071-1050. DOI: 10.3390/su11133532.
31.
Machalikova Jaroslava, Marie Sejkorova,
Marcela Livorova, Lukas Kocourek,
Stefan Corny. 2010. „Possibilities of reducing the consumption of
lubricants in traffic”. Edited by Adamec, V.,
V. Jandova. In: 4th
Czech-Slovak Scientific Conference on Transport, Health and Environment:
185-194. Blansko, Czech Republic. November 02-03,
2010. ISBN: 978-80-7399-141-8.
32.
Madlenak Radovan, Martin Hudak. 2016. „The research of visual pollution of road
infrastructure in Slovakia”. In: 16th
International Conference on Transport Systems Telematics. Katowice Ustron, Poland. Mar. 16-19, 2016. Challenge of Transport Telematics. Mikulski J., (Ed.). Communications in Computer and Information
Science 640: 415-425. DOI:
10.1007/978-3-319-49646-7_35.
33.
Makareviciene Violeta, Jonas Matijosius, Saugirdas Pukalskas, Ricardas Vegneris, Irina Kazanceva, Kiril Kazancev. 2017. „The exploitation and environmental characteristics of
diesel fuel containing rapeseed butyl esters”. Transport 28(2):
158-165. ISSN: 1648-4142. DOI:
10.3846/16484142.2013.801364.
34.
Mamcarz Piotr, Paulina Droździel, Lucia Madleňáková,
Andrzej Sieradzki, Paweł Droździel. 2019. „Level of occupational stress, personality and traffic incidents:
Comparative study of public and freight transport drivers”. Transportation Research Procedia 40:
1453-1458. ISSN: 2352-1465. DOI: 10.1016/j.trpro.2019.07.201.
35.
Matuszak Zbigniew, Michał Bartosz, Dalibor Barta. 2016. „The application of selected network methods for
reliable and safe transport by small commercial vehicles”. Management Systems In
Production Engineering 23(3): 198-204. ISSN: 2450-5781. DOI:
10.2478/mspe-09-03-2016.
36.
Metz David. 2018. „Tackling urban traffic congestion: The experience of
London, Stockholm and Singapore”. Case
Studies on Transport Policy 6(4): 494-498. DOI: 10.1016/j.cstp.2018.06.002.
37.
Pauer Gabor, Arpad Török. 2019. „Static system optimum of linear traffic distribution problem assuming an
intelligent and autonomous transportation system”. Periodica Polytechnica Transportation Engineering
47(1): 64-67. ISSN: 0303-7800. DOI: 10.3311/PPtr.11548.
38.
Poliak Milos,
Adela Poliakova, Michaela Mrnikova,
Patricia Simurkova, Marek Jaśkiewicz,
Rafał Jurecki. 2017. „The competitiveness of public transport”. Journal of Competitiveness 9(3): 81-97.
ISSN: 1804-171X. DOI: 10.7441/joc.2017.03.06.
39.
Poliak Milos,
Michaela Mrnikova, Patricia Simurkova,
Peter Medvid, Adela Poliakova,
Salvador Hernandez. 2018. „Social law in road transport like tool safety road
transport”. In: XI International
Science-Technical Conference Automotive Safety. Casta
– Papiernicka, 18-20 April 2018, Slovakia. IEEE Proceedings Paper. DOI: 10.1109/AUTOSAFE.2018.8373317.
40.
Rahman Faysal Ibna. 2020. „Impact
of V2V Communication on Eco-Route Choice”. LOGI – Scientific Journal on Transport and
Logistics 11(1): 37-45. ISSN: 2336-3037. DOI:
10.2478/logi-2020-0004.
41.
Raslavicius Laurencas, Arturas Kersys, Saugirdas Pukalskas, Jonas Bazaras,
Janina Jablonskyte, Jurga
Ilgakojyte-Bazariene, Rolandas
Makaras. 2015. „City transport analysis using the General Motors (GM) microscopic
model”. Public Transport 7(2):
159-183. ISSN: 1866-749X. DOI:
10.1007/s12469-014-0094-z.
42.
Rievaj Vladimir, Jan Vrábel, Frantisek Synak, Ladislav Bartuśka. 2018. „The effects of vehicle load on driving
characteristics”. Advances in
Science and Technology Research Journal 12(1): 142-149. ISSN: 2299-8624. DOI: 10.12913/22998624/80896.
43.
Rimkus Alfredas,
Justas Zaglinskis, Saulius Stravinskas, Paulius Rapalis, Jonas Matijosius, Akos Bereczky. 2019. „Research on the combustion, energy and emission
parameters of various concentration blends of hydrotreated
vegetable oil biofuel and diesel fuel in a compression-ignition engine”. Energies 12(15): 2978.
ISSN: 1996-1073. DOI: 10.3390/en12152978.
44.
Rosca Eugen, Aura Rusca, Anamaria Ilie, Florin Rusca. 2010. „Non-motorized transportation - An educational
challenge for urban communities”. Theoretical
and Empirical Researches in Urban Management 5(8)(17):
5-13.
45.
Rusca Florin, Aura Rusca, Eugen Rosca, Mircea Rosca, Oana
Dinu, Florian Ghionea.
2019. „Algoritm for traffic allocation when are developed park and ride
facilities”. Procedia Manufacturing
32: 936-943. ISSN: 2351-9789.
DOI: 10.1016/j.promfg.2019.02.306.
46.
Rymarz Joanna, Andrzej Niewczas, Aneta Krzyżak. 2016. „Comparison of operational availability of public city buses by analysis
of variance”. Eksploatacja i Niezawodnosc – Maintenance and Reliability 18(3):
373-378. ISSN: 1507-2711. DOI: 10.17531/ein.2016.3.8.
47.
Sarkan Branislav,
Jozef Gnap, Monika Kiktova. 2019. „The importance of hybrid vehicle in urban traffic in
terms of environmental impact”. The
Archives of Automotive Engineering – Archiwum Motoryzacji 85(3): 115-122. ISSN: 2084-476X. DOI: 10.14669/AM.VOL85.ART8.
48.
Schmidt Marie,
Stefan Voss. 2017. „Advanced systems in public transport”. Public Transport 9(1-2) Special Issue:
3-6.
49.
Skrucany Tomas, Jan
Vrabel, Martin Kendra, Patrik Kazimir.
2017. „Impact of cargo distribution on the vehicle flatback on braking distance in road freight
transport”. 18th International
Scientific Conference “LOGI 2017”
137: 00054. ISSN: 2261-236X. DOI:
10.1051/matecconf/201713400054.
50.
Skrucany Tomas, Martin
Kendra, Ondrej Stopka, Sasa Milojevic, Tomasz Figlus, Csaba Csiszár. 2019. „Impact of the electric mobility implementation on the greenhouse gases
production in central European countries”. Sustainability 11(18): 4948. ISSN: 2071-1050. DOI: 10.3390/su11184948.
51.
Skrucany Tomas, Stefania Semanova, Tomasz Figlus, Branislav Sarkan, Jozef Gnap. 2017. „Energy intensity and GHG production
of chosen propulsions used in road transport”. Communications - Scientific Letters of the University of Zilina 19(2): 3-9. ISSN: 1335-4205.
52.
Statistical
Yearbook of the Republic of Poland, Warsaw 2018.
53.
Tsekeris Theodore, Nikolas
Geroliminis. 2013. „City size, network structure and traffic congestion”. Journal of Urban Economics 76: 1-14.
ISSN: 0094-1190. DOI: 10.1016/j.jue.2013.01.002.
54.
Turska Stanislava,
Tatiana Corejova, Lucia Madlenakova,
Roman Chinoracky. 2019. „Optimization of the delivery process in the urban area”. In: Proceedings of 23rd International Conference.
Transport Means 2019, Proceedings Part 2:
809-813. ISSN: 1822-296X.
55.
Veternik Milan, Marian Gogola.2017. „Examining of correlation between demographic
development of population and their travel behaviour”.
Procedia Engineering 192:
929-934. ISSN: 1877-7058. DOI: 10.1016/j.proeng.2017.06.160.
56.
Vickrey William S. 1969. „Congestion theory and transport investment”. American Economic Review 59(2): 251-260.
57.
Wen, Tzai-Hung, Wei-Chien-Benny Chin,
Pei-Chun Lai. 2017. „Understanding the topological characteristics and flow
complexity of urban traffic congestion”. Physica A: Statistical Mechanics and its Applications 473: 166-177. ISSN:
0378-4371, DOI: 10.1016/j.physa.2017.01.035.
58.
Zefreh Mohammad Maghrour,
Adam Török. 2016. „Improving traffic flow characteristics by suppressing shared taxis
maneuvers”. Periodica Polytechnica
Transportation Engineering 44(2): 69-74. ISSN: 0303-7800. DOI: 10.3311/PPtr.8226.
59.
Zheng Jianfeng, Henry X. Liu. 2017. „Estimating traffic volumes for signalized intersections using connected
vehicle data”. Transportation
Research Part C: Emerging Technologies 79: 347-362. ISSN: 0968-090X. DOI: 10.1016/j.trc.2017.03.007.
Received 09.04.2021; accepted in revised form 03.06.2021
![]()
Scientific
Journal of Silesian University of Technology. Series Transport is licensed
under a Creative Commons Attribution 4.0 International License