Article
citation information:
Soczówka, P., Kłos, M.J., Żochowska, R., Sobota, A. An analysis of the
influence of travel time on access time in public transport. Scientific Journal of Silesian University of
Technology. Series Transport. 2021, 111,
137-149. ISSN: 0209-3324. DOI: https://doi.org/10.20858/sjsutst.2021.111.12.
Piotr
SOCZÓWKA[1], Marcin Jacek KŁOS[2], Renata ŻOCHOWSKA[3], Aleksander SOBOTA[4]
AN
ANALYSIS OF THE INFLUENCE OF TRAVEL TIME ON
ACCESS TIME IN PUBLIC TRANSPORT
Summary. Sustainable mobility is
a priority for transport systems
in urban areas. Contemporary planning of
transport systems assumes an increase in the role of public
transport in everyday trips.
To increase the share of trips using public transport, it is essential
to improve the accessibility
of public transport stops. The accessibility
of such stops depends primarily on the distance between the trip origin and the stop. Many factors influence the distance that passengers are willing to travel. This paper
discusses the relationship between the access time to the bus stop and travel time. To study such a relationship,
various statistical methods may be applied. This paper presents
the results of the analysis
performed based on the data
on trips made by inhabitants of Bielsko-Biała, gathered
during the building of its transport model.
Keywords: public transport, travel time, access time, bus stops
1. INTRODUCTION
According to the goals of
sustainable development and sustainable mobility, public transport should be
the priority mode of transport in urban areas [1-7]. Hence, contemporary
transport systems should provide the connectivity of such a system, which means
the possibility of travel between origin and destination points using means of
public transport. There are numerous advantages of public transport over
individual transport, for example, enhancement of the environmental features
(that is, air quality), reduction of congestion and decrease of noise level [8-10].
The system of public transport
consists of many elements, which influence the usability from the perspective
of passengers [11, 12]. One of the elements of this system is the infrastructure.
The accessibility to public transport infrastructure influences the decision on
the transport mode to be chosen by transport users. This paper focuses on the
accessibility to bus stops, measured by the access time to them. Literature
shows many different approaches to the analysis of the accessibility to the bus
stops. In [13], the authors show analysis based on the geo-information systems.
Based on the road network data, they developed isochrones of the walking
distance to the bus stop. This approach is useful when seeking new locations
for bus stops. In the case of the analysis of the whole public transport system
and a better understanding of passenger’s behaviour,
the tools of statistical analysis may be useful [14].
The main goal of this paper was to examine the
relationship between two important variables associated with trips made
using public transport in urban areas - the access time to bus stops and the travel
time. It focuses on examining the impact of travel time on access time.
Several statistical methods were
applied to achieve this goal. To study the strength of the relationship between
the analysed variables, the analysis of correlation
was used. Subsequently, to map the influence of travel time on access time, the
analysis of regression was applied. It allowed creating mathematical models by
the fitting of several chosen functions that describe the relationship, such as
linear, exponential, power and logarithmic. The analysis of the quality of the
fitting of the functions was also performed to evaluate them.
The data for the analysis were
collected during surveys research in Bielsko-Biała,
at the stage of building its transport model [15].
This paper is organised
as follows: Section 1 entails the introduction, section 2 provides further
information about the research issue, section 3 presents applied statistical
methods, section 4 contains the results of the analysis and section 5 of the
paper presents conclusions and propositions for future work.
2. REVIEW OF RESEARCH ISSUE
The functioning of a public
transport system is influenced by many factors [16], associated with different
aspects of the operation of the system, such as the layout of the network,
timetable, fares, condition of vehicles and the location of stops. This paper
focuses on factors concerning the location of public transport stops, as they
play a vital role in the system. From passengers’ point of view, one of
the most important factors associated with the location of the stop is the
distance that they have to travel to reach the stop. Therefore, the distance
between the trip origin and the location of the public transport stop has a
significant influence on the decision on the mode of transport they choose.
This distance may be represented in units of length and may be expressed in
units of time too. In the latter approach, the duration of the travel between
the trip origin and the stop is usually called access time. An analysis of the distances
between trip origin and public transport stop may be useful in studies on the
determination of the location of stops (using geo-informational systems data) [13] and
to perform a comprehensive assessment of the system of public transport [14].
Many authors have taken up the issue
of determining the acceptable distance between the trip origin and the stop.
Although the results of each study vary, it is possible to set general ranges
both for bus and railway transport. In the case of bus transport, most authors
suggest that a bus stop should be located 400 to 600 [m] from the trip origin,
whereas in railway transport these distances are longer, even up to 800-1,000
[m] [17-20].
Nevertheless, many studies have
shown that these values may be influenced by numerous factors associated with
the features of the trip, passengers or the surrounding of the stop [21]. In [22],
the authors state that the period of the day or the motivation of the trip may
have an impact on the distance that passengers accept. Authors of the paper [23],
point out that the age of passengers determines the maximal distance they are
willing to travel between the trip origin and the bus stop. Other studies [18,
24, 25] have shown that the characteristics of the
street network (that is, its connectivity or amenities for pedestrians) as well
as the built environment may also have a significant influence on the distance
that passengers accept to reach the public transport stop.
In this paper, the authors focused
on the impact of travel time as a chosen characteristic of the trip. Total
travel time (TTT) in public transport, as presented
in Figure 1, usually consists of several components related to the travel
stages and change of mode of transport, that is, access time (AT), waiting time
at the stop (WT), in-vehicle time (IVT), transfer
time (TT), covering both walk time and transfer wait time and egress time (ET).
Because the total travel time includes access time, these variables cannot be
treated as independent ones. Thus, access time has been excluded from the total
travel time and as the main research issue, the relationship between the access
time to the bus stop and the travel time without the access time (TTWAT) has been adopted, as shown in Figure 1. Travel time without the access time is
understood as a sum of times of subsequent stages of the trip: waiting time,
in-vehicle time, transfer time and egress time with the exclusion of the access
time. For this study, access time is treated separately, although in most
cases, it is the component of the sum that constitutes the total travel time.
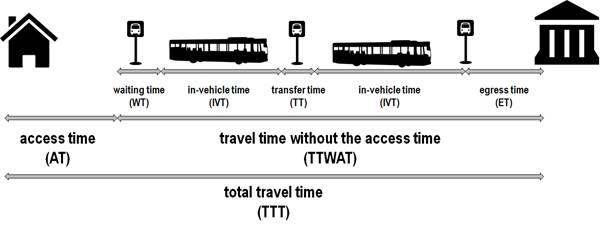
Fig. 1. Components of total travel time
The goal of this paper is to determine if TTWAT affects AT in the case of bus transport. It is
associated with the research question whether passengers that plan longer trips
by public transport bus accept longer access time to the bus stop. Should the
dependency be proven, it will allow proposing guidelines for the location of
bus stops.
3. STATISTICAL ANALYSIS
To examine the influence of TTWAT
on AT, a statistical analysis, which included several statistical methods, was
performed. The general scheme of the statistical analysis is presented in
Figure 2. Among the statistical methods exploited are:
·
methods of conducting empirical research, which
allowed gathering empirical data on components of total travel time,
·
methods of grouping data, which allowed preparing
classes of data, for further analysis,
·
methods of estimation of central tendency measures,
which allowed determining average values of each variable, and choosing them as
representative values for each class,
·
methods of correlation analysis, which allowed
estimating the strength of the relationship between variables,
·
methods of
building regression models including the choice of the various functional forms
of model and goodness-of-fit measures, which allowed preparing equations of
regression between analysed variables and evaluate
the mapping.
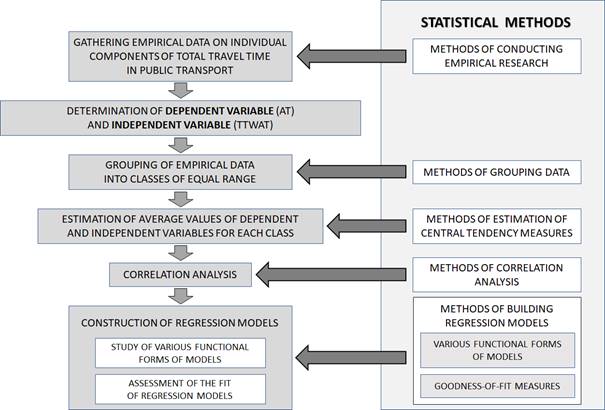
Fig. 2. General
scheme of the statistical analysis
Analysis of correlation and regression assumes the
occurrence of the dependent variable and a set of independent variables, which
have a lasting influence on the dependent variable. The goal of the following
analysis was to examine the influence of the travel time without
the access time on the access time to the stop, therefore, the travel
time without the access time was chosen as the independent variable and
access time to the stop as the dependent variable.
The
analysis requires the collection of data about trips made by public transport
users. It was necessary to gather data about the access time to the bus stop
and TTWAT in the
case of each trip. Data was collected from a household survey, that is, to
build the transport model. More so, it is important to ensure the appropriate
size of the sample, so it can be treated as representative.
In the
case of large sets of data, it is convenient to group units into classes of
equal ranges [26]. Classes pertain to the independent variable, which is TTWAT.
By denoting
the number of class as, it is possible to determine the set of all classess as:
(1)
![]()
where ![]() is interpreted as the number of classes
that have been created in the case of a given data set.
is interpreted as the number of classes
that have been created in the case of a given data set.
For each ![]() -th class, the middle of the range denoted as
-th class, the middle of the range denoted as ![]() and empirical value
and empirical value ![]() have been determined. The value
have been determined. The value ![]() has the interpretation of average access
time corresponding to the range of TTWAT from the
has the interpretation of average access
time corresponding to the range of TTWAT from the ![]() -th class. Vectors containing values of
independent and dependent variables, for each class have been determined as:
-th class. Vectors containing values of
independent and dependent variables, for each class have been determined as:
(2)
![]()
(3)
![]()
The basis
for building the regression models is the analysis of correlation between the
variables. Correlation
is a statistical relationship between variables. It allows determining to what
degree variables remain in a linear relation. One of the useful tools in correlation analysis is the scatter plot,
which allows to tentatively assess the strength and direction of the dependency
between variables. In the case of linear relation between two variables,
it is possible to use the Pearson correlation coefficient. Its estimator for a
set of empirical data may be presented as:
(4)
![]()
where:
![]() – covariation
between variables
– covariation
between variables ![]() and corresponding
and corresponding ![]() .
.
![]() – standard
deviation of variables
– standard
deviation of variables ![]() ,
,
![]() – standard
deviation of variables
– standard
deviation of variables ![]() .
.
Often, apart from the value of Pearson coefficient of correlation ![]() , the value of
coefficient of determination
, the value of
coefficient of determination ![]() is calculated. It
describes the proportion of the
variance of the dependent variable that is explained by the variance of the
independent variable (or variables).
is calculated. It
describes the proportion of the
variance of the dependent variable that is explained by the variance of the
independent variable (or variables).
The
relationship between dependent and independent variables can be expressed in
form of a mathematical equation. Regression models are built as functions of various mathematical forms. For
variables ![]() oraz
oraz ![]() , the best mapping has been obtained for
functions presented in Table 1.
, the best mapping has been obtained for
functions presented in Table 1.
Tab. 1
Mathematical forms of
regression models for the relations between
AT and TTWAT in public transport
|
Regression model |
Mathematical form |
|
linear model |
|
|
exponential model |
|
|
power model |
|
|
logarithmic model |
|
Source: authors’ research
where:
![]() – theoretical
value of dependent variable (access time to the bus stop) corresponding to TTWAT from
– theoretical
value of dependent variable (access time to the bus stop) corresponding to TTWAT from ![]() -th
class.
-th
class.
To assess
the quality of the fitting of the function of regression, different measures
can be used. Among most common, one can enumerate the residual variation ![]() , which can be calculated as:
, which can be calculated as:
(5)
where:
![]() – number
of parameters of regression.
– number
of parameters of regression.
The standard residual deviation ![]() , was calculated
according to the following formula:
, was calculated
according to the following formula:
(6)
The
differences between the empirical and theoretical values of the dependent
variable should be low. Hence, the lower the value of standard residual
deviation, the better fitted the model
Another
measure that has been used to assess the fitting of the function of regression
was the coefficient of residual variation ![]() , that is associated with standard residual
deviation and has been calculated as:
, that is associated with standard residual
deviation and has been calculated as:
(7)
![]()
where ![]() is
the average value of the access time to the bus stop estimating as:
is
the average value of the access time to the bus stop estimating as:
(8)
Coefficient
of residual variation ![]() shows what portion of the mean value of
the dependent variable constitutes the standard residual deviation, so in the
case of well-fitted models, it takes values smaller than 0.3.
shows what portion of the mean value of
the dependent variable constitutes the standard residual deviation, so in the
case of well-fitted models, it takes values smaller than 0.3.
The last
measure for assessing the quality of the fitting was the coefficient of convergence ![]() , calculated based on the following formula:
, calculated based on the following formula:
![]()
(9)
It
takes values between 0 and 1, and the closer to 0 it equals, the better fitted
the model.
4. RESULTS
The surveys research, necessary for the analysis was
performed in Bielsko-Biała. It is a city in the
southern part of the Silesian Voivodeship, located
near the Polish borders with Czechia and Slovakia. It
is the largest city in the region, having a population of c.a. 170,000
inhabitants [27]. The area of the city is 124.5 km2.
The location of Bielsko-Biała on the background
of Silesian Voivodeship is presented in
Figure 3.
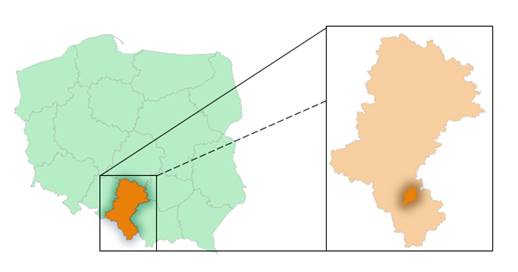
Fig. 3. Location of Bielsko-Biała
on the background of the Silesian Voivodeship
The data for the analysis was obtained from household
surveys, for the building of the transport model for the city. Inhabitants were
asked about their trips made by buses and they declared the duration of the
individual components of the total travel time for each trip they made.
According to the data collected during the survey, TTWAT was widely differentiated and varied from low values
(ca. 2-3 minutes) to even up to 90 minutes. To perform the statistical
analysis, TTWAT has been aggregated into groups of 5
minutes, as presented in Table 2. Only groups with at least 30
observations were considered, and for these groups, the analyses of correlation
and regression were performed. These groups have been bolded. For each group,
the middle of the range and value of average access time has been determined.
Tab. 2
Classes of TTWAT and average access time to bus stop
|
Number of the
class of TTWAT
|
Range of the class
of TTWAT |
Number of
observations |
Middle of the
range of TTWAT
|
Average access
time to bus stop |
|
1 |
0 – 5 |
21 |
2.5 |
6.38 |
|
2 |
5 – 10 |
98 |
7.5 |
5.28 |
|
3 |
10 – 15 |
276 |
12.5 |
5.64 |
|
4 |
15 – 20 |
464 |
17.5 |
6.48 |
|
5 |
20 – 25 |
512 |
22.5 |
5.86 |
|
6 |
25 – 30 |
409 |
27.5 |
6.20 |
|
7 |
30 – 35 |
282 |
32.5 |
7.02 |
|
8 |
35 – 40 |
175 |
37.5 |
7.49 |
|
9 |
40 – 45 |
132 |
42.5 |
6.86 |
|
10 |
45 – 50 |
82 |
47.5 |
6.32 |
|
11 |
50 – 55 |
58 |
52.5 |
6.86 |
|
12 |
55 – 60 |
42 |
57.5 |
7.12 |
|
13 |
60 – 65 |
22 |
62.5 |
6.68 |
|
14 |
65 – 70 |
13 |
67.5 |
8.38 |
|
15 |
70 – 75 |
7 |
72.5 |
6.43 |
|
16 |
75 – 80 |
8 |
77.5 |
11.88 |
|
17 |
80 – 85 |
6 |
82.5 |
10.83 |
|
18 |
85 – 90 |
1 |
87.5 |
5.00 |
Source: authors’ research
The analysis of correlation was the first part of the
analysis. The value of the Pearson coefficient of correlation
![]() , suggests
that the relationship between TTWAT and average
access time to the bus stop is fairly strong. Positive value of the coefficient
also means that the higher the value of TTWAT, the
higher the value of the average access time to the bus stop.
, suggests
that the relationship between TTWAT and average
access time to the bus stop is fairly strong. Positive value of the coefficient
also means that the higher the value of TTWAT, the
higher the value of the average access time to the bus stop.
To map the relationship between analysed variables,
four regression models presented in Table 3, were developed. Parameters of
regression for each model were calculated and equation of regression was
obtained on this basis.
Tab. 3
The regression models
mapping the analysed relationship
|
Regression model |
Equation of
regression |
Coefficient of
determination |
|
linear model |
|
0.56 |
|
exponential model |
|
0.57 |
|
power model |
|
0.68 |
|
logarithmic model |
|
0.66 |
Source: authors’ research
According to Table 3, the highest value of the
coefficient of determination was obtained in the case of the power model. This
value is very close to 0.70, which suggests moderate quality – about 68%
of the variance of the access time to the bus stop is explained by the variance
of TTWAT. Assuming that the minimum value of the
coefficient of determination to determine the fitting of the model as
acceptable is 0.60, then the logarithmic model offers satisfactory results
whereas the linear model and exponential model do not map the relationship
between the access time to the bus stop and TTWAT
sufficiently.
For each model, a scatter plot containing observations
and curves of regression was prepared. They are presented in Figure 4.
Fig. 4. Scatter
plots and curves of regression for each analysed model of regression
In
the case of each model, the quality of the fitting was assessed. It allowed
determining which model represents the relationship between the access time to
the bus stop and TTWAT in the best possible way.
Several measures were exploited assessing the quality of the fitting:
·
standard residual deviation ![]() ,
,
·
coefficient of residual variation ![]() ,
,
·
coefficient of
convergence ![]() .
.
The results of the evaluation are presented in Table 4.
Bolded indicates the best value of each measure.
Tab. 4
Goodness-of-fit
measures for each analysed model
|
Model |
standard residual deviation |
coefficient of residual variation |
coefficient of convergence |
|
linear model |
0.48 |
7.38 |
0.44 |
|
exponential model |
0.49 |
7.54 |
0.46 |
|
power model |
0.43 |
6.59 |
0.35 |
|
logarithmic model |
0.42 |
6.51 |
0.34 |
Source: authors’ research
The best value of the coefficient of convergence was
calculated for the logarithmic model. In the case of standard residual
deviation and coefficient of residual variation, the best values were obtained
for such a model. However, it is important to point out that the values of
these two measures were fairly similar among all models. The difference between
the maximum and minimum values of the measures for the tested models does not
exceed 0.1. The logarithmic model also has a satisfactory value of the coefficient
of determination (above 0.6). Therefore, it seems that the logarithmic model
may be the most useful to map the relationship between the access time to the
bus stop and travel time without the access time in bus transport.
5. CONCLUSION
Access time to bus stops has a great impact on decisions transport users
make on the choice of the mode of transport. Numerous studies have been focused
on determining the factors that influence the value of access time that
passengers accept when walking to the bus stop. The goal of this paper was to
study the relationship between the access time (as the dependent variable) and
one of the characteristics of the travel – the travel time without the
access time (as the independent variable).
Statistical analysis was exploited to learn if there is a relationship
between these two variables. Based on the results of the analysis of
correlation, it was shown that there is a fairly strong dependency between the
access time to the bus stop and travel time without the access time. Such a
result justifies the construction of regression models to map the relationship.
Four regression models (linear, exponential, power and logarithmic) were
chosen for further analysis. The quality of fitting was assessed in the case of
each model, using the following measures: coefficient of determination,
standard residual deviation, coefficient of residual variation and coefficient
of convergence. Results of the analysis of regression and the assessment of
fitting of each model show that the logarithmic model may be the best choice to
map the relationship between access time and travel time.
Results of the conducted analysis
show that passengers of bus transport are willing to walk longer to the bus
stop if they are planning a longer trip. It may be a guideline for the
determination of locations of bus stops. Future research should be focused on
the analyses of the relationship between access time and travel time
considering different transport modes (that is, tram transport, railway
transport) and different characteristics of travel, to provide a comprehensive
view.
References
1.
Jacyna
Marianna, Mariusz Wasiak, Konrad Lewczuk, Michał Kłodawski. 2014. “Simulation model of transport system of
Poland as a tool for developing sustainable transport”. The Archives
of Transport 31(3): 23-35. ISSN: 0866-9546. DOI: 10.5604/08669546.1146982.
2.
Jacyna Marianna, Mariusz
Wasiak. 2015. “Multicriteria
Decision Support in Designing Transport Systems”. In: Tools of
Transport Telematics. Edited by Jerzy Mikulski.
P. 1-13. Switzerland: Springer International Publishing. ISBN:
978-3-319-24576-8. DOI: https://doi.org/10.1007/978-3-319-24577-5.
3.
Jacyna
Marianna, Piotr Gołębiowski, Emilian Szczepański. 2015. “City transport service model taking into
account different means of transport”. 19th International Conference Transport Means 2015:
160-168. Kaunas University of Technology. 22-23.10.2015. Kaunas. ISSN: 1822-296X.
4.
Jacyna
Marianna, Mariusz Wasiak, Konrad Lewczuk, Grzegorz Karoń. 2017. “Noise and environmental pollution from
transport: decisive problems in developing ecologically efficient transport
systems”. Journal of Vibroengineering
19(7): 5639-5655.
ISSN: 2351-5260. DOI:
https://doi.org/10.21595/jve.2017.19371.
5.
Chamier-Gliszczyński Norbert. 2011. “Sustainable Operation of a Transport System in
Cities”. Key Engineering Materials 486: 175-178. DOI: https://doi.org/10.4028/www.scientific.net/kem.486.175.
6.
Jacyna-Gołda
Ilona, Jolanta Żak, Piotr Gołębiowski. 2014. “Models of traffic flow distribution for scenario of the
development of proecological transport system”.
The Archives of Transport 32(4): 17-28. ISSN: 0866-9546. DOI: 10.5604/08669546.1146994.
7.
Jacyna-Gołda
Ilona, Piotr Gołebiowski, Mariusz Izdebski,
Michał Kłodawski, Roland Jachimowksi,
Emilian Szczepański. 2017. “The
evaluation the sustainable transport system development with the scenario
analyses procedure”. Journal of Vibroengineering
19(7): 5627-5638. ISSN: 2351-5260. DOI: https://doi.org/10.21595/jve.2017.19275.
8.
Gärling Tommy, Dick Ettema,
Margareta Friman. 2014. Handbook of sustainable
travel. New York, NY, USA: Springer. ISBN: 978-94-007-7033-1.
DOI: 10.1007/978-94-007-7034-8.
9.
Kos Barbara, Grzegorz Krawczyk, Robert Tomanek.
2018. Modelowanie mobilności w miastach. Katowice: Publishing House
of the University of Economics. [In Polish:
Modeling mobility in cities]. ISBN: 978-83-7875-431-2.
10.
Sahu Prasanta
K., Babak Mehran, Surya P. Mahapatra, Satish Sharma. 2021. „Spatial data analysis approach for network-wide consolidation of bus stop locations”. Public
Transport.
11.
Wu Jingxian, MinYang, Soora Rasouli, Chengcheng Xu. 2016. „Exploring Passenger
Assessment of Bus Service Quality Using Bayesian Networks”. Journal of
Public Transportation 19(3): 36-54. ISSN: 1077-291X.
DOI: http://doi.org/10.5038/2375-0901.19.3.3.
12.
Rashedi Zohreh, Md Sami Hasnine, Khandker Nurul Habib. 2021. „Modelling second-best choices from the
choice-based sample: revelation of potential mode-switching behaviour from
transit passenger surveys”.
Public Transport.
13.
Tome Andre, Bertha Santos, Carmen Carvalheira.
2019. "GIS-Based Transport Accessibility Analysis to Community Facilities
in Mid-Sized Cities". IOP Conference
Series: Materials Science and Engineering 471(6). IOP
Publishing.
DOI: 10.1088/1757-899X/471/6/062034.
14. Chen Yuan, Ahmed Bouferguene, Yinghua Shen,
Mohamed Al-Hussein. 2019."Assessing
accessibility-based service effectiveness (ABSEV) and
social equity for urban bus transit: A sustainability perspective". Sustainable Cities and
Society 44:
499-510.
15.
Sobota Aleksander, Ryszard Janecki, Grzegorz Karoń,
Renata Żochowska, et al. 2015. Zintegrowany System Zarządzania
Transportem na obszarze miasta Bielska-Białej, etap I-wykonanie Modelu
Ruchu dla miasta Bielsko-Biała. Praca NB-148/RT5/2014.
Katowice: Faculty of
Transport of the Silesian University of Technology. [In Polish: Integrated Transport Management System in the
area of the city of Bielsko-Biała, stage I -
development of the Travel Model for the city of Bielsko-Biała. Work
NB-148/RT5/2014].
16. Jacyna Marianna. 2009. Wybrane zagadnienia modelowania systemów
transportowych. Warsaw:
Publishing House of the Warsaw University of Technology. [In Polish: Selected issues of modeling transport systems]. ISBN: 978-83-7207-817-9.
17.
Ceder Avishai. 2016. Public
transit planning and operation. Modeling, Practice and Behavior. Taylor
& Francis Group. ISBN: 9780429100246. DOI: https://doi.org/10.1201/b18689.
18.
Faron Aleksandra. 2018. „Wpływ
dostępności pieszej oraz lokalizacji przystanku kolejowego na jego
potencjał pasażerski”. Transport Miejski i Regionalny 5:
12-17. [In Polish: Faron Aleksandra. 2018. „The impact of
pedestrian accessibility and the location of the railway station on its
passenger potential”]. ISSN: 1732-5153.
19.
Transit capacity and quality of service manual. Third
edition. 2013. TCRP
Report 165. Transportation Research
Board. ISSN: 1073-4872. ISBN: 978-0-309-28344-1. DOI: https://doi.org/10.17226/24766.
20.
Burke Matthew, Lex Brown. 2007. “Distances people walk for
transport”. Road & Transport Research 16(3): 16-29. ISSN:
1037-5783.
21.
Soczówka
Piotr, Renata Żochowska, Aleksander Sobota, Marcin Jacek Kłos. 2020.
“Wpływ czynników związanych z podróżą
na czas dojścia do przystanku publicznego transportu zbiorowego”. Transport Miejski i Regionalny 2: 7-13. [In Polish:
“Influence of travel factors
on the travel time to a
public collective transport stop”]. ISSN: 1732-5153.
22.
Daniels Rhonda, Corinne Mulley. 2013. “Explaining walking distance
to public transport: the dominance of public transport supply”. Journal
of Transport and Land Use 6(2):
5-20. ISSN: 1938-7849.
23.
Ivan Igor, Jiri Horak, Lenka Zajickova,
Jaroslav Burian, David Fojtik.
2019. “Factors influencing walking distance to preferred public transport
stop in selected urban centres of Czechia”.
GeoScape 13(1): 16-30. ISSN: 1802-1115. DOI: https://doi.org/10.2478/geosc-2019-0002.
24.
Wibowo Sony Sulaksono, Piotr Olszewski P. 2005. “Modeling
walking accessiblity to public transport terminals:
case study of Singapore mass rapid transit”. Journal of the Eastern
Asia Society for Transportation Studies 6: 147-156. ISSN: 1881-1124. DOI: 10.11175/EASTS.6.147.
25.
Estupinan Nicolas, Daniel A. Rodriguez. 2008.
“The relationship between urban form and station boardings
for Bogota’s BRT”. Transportation
Research Part A: Policy and Practice 42(2): 296-306. ISSN: 0965-8564. DOI: https://doi.org/10.1016/j.tra.2007.10.006.
26.
Sobczyk
Mieczysław. 2010. Statystyka opisowa. Warsaw: C.H. Beck. [In Polish: Descriptive statistics]. ISBN:
978-83-255-1607-9.
27.
Local Data Bank. Available
at: http://bdl.stat.gov.pl.
Received 07.04.2021; accepted in revised form 29.05.2021
![]()
Scientific
Journal of Silesian University of Technology. Series Transport is licensed
under a Creative Commons Attribution 4.0 International License