Article
citation information:
Oladeji, P.B., Agbabiaka, H.I. Intra-urban mobility:
the place of para-transit operations in the ancient town of Ile-Ife,
Nigeria. Scientific Journal of Silesian
University of Technology. Series Transport. 2021, 111, 109-118. ISSN: 0209-3324. DOI: https://doi.org/10.20858/sjsutst.2021.111.9.
Peter B. OLADEJI[1],
Hafeez Idowu AGBABIAKA[2]
INTRA-URBAN
MOBILITY: THE PLACE OF PARA-TRANSIT OPERATIONS IN THE ANCIENT TOWN OF ILE-IFE,
NIGERIA
Summary. This study examined the effectiveness of para-transit
transport activities by identifying the socioeconomic characteristics of both
the passengers and drivers of public transport and the factors confronting
their operation. It utilised primary and secondary data. A purposive sampling
technique was employed which entailed the identification of all the motor
parks, the selection of buses, minibuses and cars at the motor parks, major bus
stops and conducting a survey using a structured questionnaire cum interview.
Questionnaires were administered to 354 respondents to obtain information about
their socioeconomic, trip characteristics and the unconventional public
transport operations, of which a total of 312 questionnaires were duly
completed and returned. Data collected were analysed using simple descriptive
techniques and correlation analysis. The results showed that the majority of
the passengers (61.4%) were within the 21 – 30 years age bracket while
43.7% of the drivers were within the 31-40 years age bracket, the patrons and
the operators of the public transport are predominantly low-income earners as
large proportion of the passengers (42.1%) earned below ₦10,000 per month
while 46.9% of the drivers earned between ₦10,001 and ₦20,000 per
month.
The results of the correlation analysis indicated both the drivers’ and
passengers’ perspectives, factors such as public transport conditions,
road quality and drainage system are highly correlated between their paired variables.
Hence, effort should be made by the government and public transport operators
to improve the transport infrastructural facilities in the study area.
Keywords: public transport, transport operations, transport patronage
1. INTRODUCTION
Public transport, commonly referred to as public
transportation or public transit, is a shared passenger transportation service
available for use by the public, as distinct from other modes such as taxicabs,
carpooling or hired buses, which are not shared by strangers without private
arrangement. Public transport modes include buses, trolleybuses, trams and
trains. Public transport services are mostly delivered either by private or
public organisation. Regardless of the party
that delivers them, public transport services require substantial investment
and high operating costs. According to Barnum et al. (2007), factors such as
service productivity and efficiency are essential in this respect as they
influence public transport demand and patronage. Matas (2004) opined that the
public transport environment is dynamic and even interactive. It includes a
combination of alternative transport modes, various types of passengers with
different travel purposes, different travel frequencies and different travel
times. The existence of various transport modes allows for transition between
those modes for passengers. In such an environment, the demand or patronage is
relatively dynamic and volatile
Transport system represents a major interface between the
location of activities and the general movement of people in an urban system
(Ayeni, 1998). In Nigeria, the usage of public transport has been rapidly
increasing, due to speedy growth in the population; city size, decline in
personal mobility caused by scarcity of foreign exchange and severe import
restrictions (Filani and Abumere, 1993). Hitherto, bus services and many forms
of para-transit services played dominant roles in meeting the travel needs of
the majority of the populace especially the low-income groups in most cities.
Whereas the urban transport sector is characterised by a low growth rate in
terms of vehicles in use, passengers carried and route kilometres operated,
making conventional bus operators unable to meet the total demands of the
travelling masses.
Many attempts have been made in the past by different
researchers regarding public transport (Aworemi et al., 2008; Aworemi and
Ilori, 2008; Agunloye, 2011). Studies in the area of urban transportation
confirm that more than 75% of the population in the cities depends on public
transport while about 25% on private transport system (Agunloye, 2011). Gubbins
(1988) identified three principal functions of the public transport operation
to include operating, maintaining and personal management. Furthermore, Adeniji
(1983a), identified the problems associated with public transport operation in
Nigeria to include financial mismanagement, inadequate subsidy to maintain
fleets and services and high cost of vehicles and spare parts.
Despite the different efforts made by researchers, less attention has been given to the study of the challenges of public transport operations and patronage in a place having a dominating tertiary educational institution. To cover the lapses and ensure an effective public transportation system, a practicable transport operation is needed and the government should be sensitised about its role in ensuring an adequate supply of public transport. Hence, this study is of utmost importance at this time.
1.
LITERATURE REVIEW
Mobility is an essential part of human life especially in
large cities in developed economies, where it is perceived as a right (Albalate
and Bel, 2010). Public Transport is a result of rapid urbanisation, population
growth, modern lifestyles, and economic conditions, among others, and is one of
the most commonly used transport modes that provide the mobility required in
our time. Therefore, the quality of public transport services and their
delivery are important because of their effect on both the attitude and
behaviour of travellers and the demand for their services (Polat, 2012). Aworemi
and Ilori (2008) in their study on public
transport demands identified two different types of public transport, formal
public transport and informal public transport.
Formal
public transport system is high passenger occupancy vehicles, which are usually
provided by the government and non-governmental agencies at users’ costs
in the form of fares. It is deemed significant as the growth of private car use
tends to intensify congestion, environmental hazards, and energy costs, which
are socially and politically unacceptable and also for reasons of age,
disability or poverty in which a large proportion of the population may never
own private vehicles, hence, there is need to provide public transport for them
(Passweel and Reeker, 1978; Hay, 1984; Barnum et al.,
2007).
The supply of formal public transport vehicles varies from place to place all over the world. Major cities in developed countries are known to operate relatively sophisticated public transport systems, such as tramway, underground metro system buses and trains. In many advanced countries, the supply of public transport far exceeds the demand for it. For example, the United States and most European countries subsidise transit passengers to attract people to use this mode of transport (Pulcher, 1988). However, in less developed countries, the supply of public transport is far below the demand for it.
Ngoka (1988) noted that corruption, nepotism, favouritism, mediocrity and the average Nigerian workers’ lackadaisical attitude to public work, have hampered efficient public transportation services. Besides, socioeconomic and psychological problems confronting public transportation management in many states of Nigeria has had a negative influence on the transport system in the country. The supply of formal transportation modes was grossly inadequate, and the Structural Adjustment Programme (SAP) in Nigeria made the situation even worse (Adeniji, 1983b).
The relative shortfall of conventional public transport in many countries led to the consideration of a novel innovative mode of operation now known as unconventional or para-transit as the case may be (Nutley, 1988). Places, where the provided public transport failed to meet the travel needs of its population, needed this solution. In Nigeria, the private sector is involved in the business of procuring different types of vehicles that are believed to be cost-effective in meeting peoples demand for mobility. Informal public transport modes vary in size, type and operation from place to place all over the world. In Madras, Caracas and Delhi; duto and pedicab, bicycle, rickshaw, lorries and hand cast are informal transport modes used for goods and passenger movements (Parker,1979; Plumber, 1979). In the U. S. A., the informal transport modes are in the forms of jitney, dial and ride, subscription bus, vanpool, shared taxi and auto rapid transit (Kirby et al., 1974). From the studies carried out on public transport vehicles in Nigeria, the popular modes of public transport are taxis, minibuses (locally called danfo) and adapted vehicles which were built on truck chassis, locally called Molue or Bolekaja, and the conventional buses to some extent (Adeniji, 1983c). Fadare (1991) also suggested para-transit mode as one that involves the use of low-occupancy vehicles that carry about four to five passengers at a time.
The para-transit modes and their operations have common features and characteristics in most places where they are operated. For example, they offer personalised services, particularly for passengers going to specific directions or places. Another common feature observed is that informal public transport vehicles offer more flexible services than mass transit. They offer better convenient door-to-door services or drop passengers on request at specific un-predetermined destinations. Inadequate vehicle maintenance, neglect and desire to maximise profit as much as possible resulted in a standard of services and over-use of vehicles. Consequently, many of the vehicles used as informal public transport are noisy, smoky, rickety and jolty, posing specific environmental problems to the road and none road users (Fadare, 1990).
The socioeconomic variables of Nigerians largely contributed to this pattern. Public transport system, which is an aspect of the country’s transport sector, has always been under the control of Nigerian private entrepreneurs. Thus, the private owners dictated largely, the modus operandi of the nation’s public transport system. In the early 1960s, the macro-economic indicators, which are yardsticks for measuring all aspects of the growth of Nigeria’s economy, were consistently positive. This was because the nation depended much on agricultural products for its foreign exchange earnings and a low proportion of the population were engaged in white-collar jobs. During this period, some private individuals owned private vehicles, which they used for both intra- and inter-urban movements, especially in Lagos. Also it can be noticed that the transport crisis has defeated the urban mass transit programme; this led to the use of motorcycles in most urban areas, which sometimes solved the problem of mobility for commuters during rush hours and hot weathers. The urban public transport market in Nigeria is dominated by private operators who mostly use minibuses and adapted vehicles to convey commuters to their different destination.
2.
MATERIALS AND
METHODS
Ile-Ife is a town situated in Osun State, South-Western
Nigeria. It lies between latitude 70 05’ N and 70 55’N and
longitude 40 15’E. It is the headquarters of the ancient
Ife Kingdom, situated in the south-west of modern Nigeria, stretching over 200
km from the Niger River in the borders of modern-day Benin in the west, it is
believed to be the cradle of modern civilisation. Ile-Ife, the headquarters of
the defunct Oranmiyan Local Government Area, became the headquarters of Ife
Central Local Government Area in May 1989. With the creation of Ife East from
Ife Central Local Government in 1996, Ajebamidele became the headquarters of
the new Ife Central Local Government while Ife East Local Government has her
headquarter at Oke Ogbon. The estimated population of Ile-Ife is 261,900. Ile-Ife is made up of two local governments:
Ife Central Local Government and a fractional part of Ife East Local
Government. The National Population Commission
(NPC), 2008, however, states that Ile-Ife, has a population
figure of 355,341. This is an indication that the population of this city has
increased tremendously over the years. There
are seven major motor parks in the study area, of which four are in Ife
Central; Mayfair, Ilesa garage, Abuja garage and Ibadan motor parks. The remaining
three motor parks are located within Ife East; Ife II Ondo road, Ifewara Ilode,
and Modakeke Ondo road motor park. However, other units fall under these major
motor parks.
To achieve the purpose of this study, both primary and
secondary data were used. The primary data was obtained via field survey
through the administration of questionnaires. Information on the operation of
public transport in the area was obtained through the administration of
questionnaires and field interview.
The target population comprises commuters and operators of
the public transport within the study area from which sampling and interview
were conducted to obtain relevant information that will facilitate the aim of
the paper. This study adopted the total number of passengers in each mode of
transport for a single round trip of a particular day as the sample frame. The
average capacity for buses, minibuses and taxis on the routes are; ten and
seven for buses and minibuses and five for taxis from the motor park on
average.
For proper administration of the questionnaire, a purposive
sampling technique was used in which ten percent (10%) of the passengers and
drivers across various routes were considered; this was representative enough
to achieve the aim of the study. The summary of passengers and drivers of the
intra-city public transport across the study area is reflected in Table 1. The
information therein was obtained from the transport operators’
association within the study area to include the National Union of Road Transport
Workers (NURTW), Road Transport Employee Association of Nigeria (RTEAN) and a
reconnaissance survey of the area.
Intra-City Public
Transport Services Information
Tab. 1
Sample size of passengers and drivers across routes within
the study area
|
Routes |
No of vehicles |
Vehicle capacity |
No of passengers |
Sample drawn (10%) |
||||
|
Minibuses |
Cars |
Minibuses |
Cars |
Minibuses |
Cars |
Passengers |
Drivers |
|
|
Campus-Opa |
220 |
- |
10 |
|
2200 |
|
220 |
22 |
|
Modakeke |
80 |
- |
7 |
|
560 |
|
56 |
8 |
|
Lagere-Ondo |
- |
50 |
- |
5 |
|
250 |
25 |
5 |
|
Iremo-Ilode |
- |
30 |
- |
5 |
|
150 |
15 |
3 |
|
Total |
300 |
80 |
- |
|
2760 |
400 |
316 |
38 |
Source: NURTW, RTEAN and Authors’ field survey
Descriptive and inferential statistics were used in the
analysis of the obtained data. The variables included in the questionnaire were
coded using the statistical package for social sciences (SPSS), after which the
data collected were populated into the software and analysis was performed on
them. The descriptive statistics were presented in tables using frequencies and
percentages. The inferential statistics were presented by correlation analyses.
3.
RESULTS AND
DISCUSSION
Trip Characteristics of the Patrons of
Public Transport
The trip characteristics of the public transport in the study area are presented in Figures 1 to 3. Findings revealed that the majority (57.8%) of the respondents make at least one trip per day, while 25% of the respondents make at least one trip per week. Furthermore, it was discovered that the waiting time of passengers was majorly between 0 to 10 min while occasionally they wait for more than 10 min as presented in Figures 2.
While the major modes of transportation for daily commuting are buses (54.6%), followed by cars (26.1%), and the less prominent mode of transportation are motorcycles (Okada) (13.9%); and tricycles (5.4%). Motorcycle and tricycle are presented in Figure 3. This is an indication that the bus transport system is very effective in commuting people about their daily activities. Personal observation and discussion with commuters during the survey revealed the proliferation of minibuses (10 passengers) in the study area.
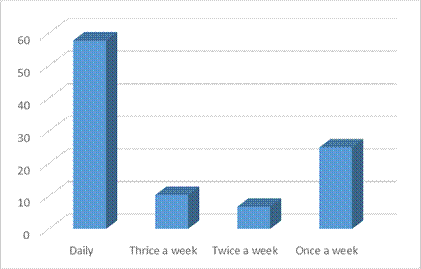
Fig. 1. Passengers trip generation
Source: Authors’ field survey
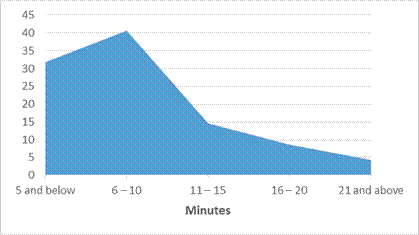
Fig. 2. Passenger waiting time
Source: Authors’ field survey
Condition of Transport Infrastructure
Presented in Table 2 are possible transport
infrastructural condition indicators that could
affect public transport operations and patronage within the study area. Concerning road quality, about 49.4 and 93.8% of
the passengers and drivers, respectively, opined that the roads were good,
while 50.6 and 6.2% of them were of the view that they were generally bad.
Further, 46.1 and 87.5% of both passengers and drivers, respectively, perceived
that the public transport condition within the study area was good, while 53.9
and 12.5% of passengers and drivers, respectively, thought otherwise. Majority
of the passengers (62.9%) and drivers (37.5%), believed that the condition of
street lights within the study area was bad, while the remaining 37.1 and 62.5%
of both passengers and drivers were on the contrary. 27.1 and 28.1% of the
passengers and drivers, respectively, affirmed that the state of security is
good and 72.9 and 71.9% of them stated otherwise.
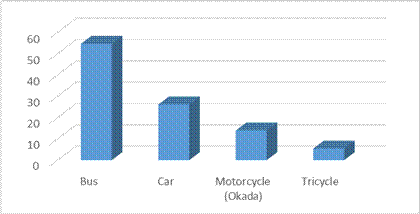
Fig. 3. Passengers transportation mode choice
Source: Authors’ field survey
Condition of Transport Infrastructure
Presented in Table 2 are possible transport
infrastructural condition indicators that could
affect public transport operations and patronage within the study area. Concerning road quality, about 49.4 and 93.8% of
the passengers and drivers, respectively, opined that the roads were good,
while 50.6 and 6.2% of them were of the view that they were generally bad.
Further, 46.1 and 87.5% of both passengers and drivers, respectively, perceived
that the public transport condition within the study area was good, while 53.9
and 12.5% of passengers and drivers, respectively, thought otherwise. Majority
of the passengers (62.9%) and drivers (37.5%), believed that the condition of
street lights within the study area was bad, while the remaining 37.1 and 62.5%
of both passengers and drivers were on the contrary. 27.1 and 28.1% of the
passengers and drivers, respectively, affirmed that the state of security is
good and 72.9 and 71.9% of them stated otherwise.
Tab. 2
Transportation
infrastructure conditions
|
INDICATORS |
PASSENGERS
(280) |
DRIVERS (32) |
||
|
Good |
Bad |
Good |
Bad |
|
|
Road quality |
139 (49.4%) |
141 (50.6%) |
30 (93.8%) |
2 (6.2%) |
|
Public transport condition |
129 (46.1%) |
151 (53.9%) |
28 (87.5%) |
4 (12.5%) |
|
Street light condition |
104 (37.1%) |
176 (62.9%) |
20 (62.5%) |
12 (37.5) |
|
State of security |
76 (27.1%) |
204 (72.9%) |
9 (28.1%) |
23 (71.9%) |
|
Crime level |
64 (22.9%) |
216 (77.1%) |
7 (21.9%) |
25 (78.1%) |
|
Drainage system |
66 (23.6%) |
214 (76.4%) |
5 (15.6%) |
27 (84.4%) |
Source: Authors’ field survey
Regarding crime level, 22.9 and
21.9% of passengers and drivers, respectively, perceived it to be good (the
crime rate was low) while 77.1 and 78.1% of both passengers and drivers,
respectively, believed it to be bad (the crime rate was very high). Generally,
majority of the passengers 76.4% within the study area felt that the state of
the drainage system was bad, only 23.6% perceived it to be good. In addition,
84.4% of the drivers thought that the drainage system in the study was bad
while the remaining 15.6% of them were on the contrary. It can be deduced from
both the passengers and drivers perspective that transport infrastructural
facilities are part of the militating factors that affect public transport operation in the study area.
Correlation of Factors Influencing Operations
and Patronage
Variables used in the analysis include urban transport
infrastructure condition indicators (road quality, public transport condition,
street light condition, state of security, crime level, and drainage system). These
six variables were identified by Asiyanbola (1979) as factors responsible for
transport problems. Of these variables, only five and eleven sets of
combination from drivers and passengers, respectively, explained the
significant strength among the variables that affect public transport in the
study area.
From the drivers perspective, it will be deduced that
drainage system and crime level with the correlation coefficient (r) .813** had the highest
strength between the interlocking variables, followed by the drainage system
and state of security with correlation coefficient (r) .688**. However, crime level and street light
condition with the correlation coefficient (r) .410* had the lowest strength between the
interlocking variables. This implies that infrastructural facilities such as
drainage system and state of security contributed
more to the problems confronting public transport operation in Ile-Ife.
From the passengers’ perspective, the infrastructural
facilities that have the highest strength between the interlocking variables
from Table 6 are two sets of interlocking of public transport condition and
road quality, street light condition and public transport condition with the
correlation coefficient (r) .687** followed by crime level and state of security
with the correlation coefficient (r) .528**. However, it
must be noted that crime level and road quality, drainage system and public
transport condition with correlation
coefficient (r) -.132*
had the lowest strength between the interlocking variables. The result from the
passengers indicated that public transport condition and road quality posed
more problems to public transport operation in the study area to other
transportation infrastructural facilities.
Tab.
3.
Correlation matrix of
factors influencing public transport operations and patronage
|
|
DRIVERS ( |
PASSENGERS ( |
||||||||||
|
1 |
2 |
3 |
4 |
5 |
6 |
1 |
2 |
3 |
4 |
5 |
6 |
|
|
1 |
1 |
|
|
|
|
|
1 |
|
|
|
|
|
|
2 |
0.293 |
1 |
|
|
|
|
.687** |
1 |
|
|
|
|
|
3 |
0.333 |
.488** |
1 |
|
|
|
.301** |
.687** |
1 |
|
|
|
|
4 |
0.162 |
0.026 |
0.054 |
1 |
|
|
0.053 |
.301** |
.445** |
1 |
|
|
|
5 |
0.137 |
0.2 |
.410* |
.510** |
1 |
|
-.132* |
0.053 |
0.092 |
.528** |
1 |
|
|
6 |
0.111 |
0.163 |
0.333 |
.688** |
.813** |
1 |
0.038 |
-.132* |
.305** |
.550** |
.479** |
1 |
1=
Road quality, 2= Public transport condition, 3= Street light condition, 4=
State of security, 5= Crime level and 6= Drainage system
*
Correlation is significant at the 0.05 level (2-tailed)
**
Correlation is significant at the 0.01 level (2-tailed)
CONCLUSION
This paper appraised the road public transport operation in
Ile-Ife, Osun State, Nigeria. It revealed that the average age of
passengers was 25 years with an average income of N15,576. The travel
characteristics of passengers revealed that the average passengers’
waiting time for a cab was < 10 min, which implies that there is an
availability of public transport in the area. In conclusion, public
transport conditions indicators such as drainage system and state of security; public transport
condition and road quality have shown to be
highly correlated between their paired variables. Therefore, effort should be
made by the government and public transport operators to improve transport
infrastructural facilities to ensure efficient and effective public transport
services within the study area.
References
1.
Adeniji K. 1983. „Public Transportation and Urban
Development in Nigeria”. Institute
of Town Planners 111(1).
2.
Adeniji K. 1983. „Public
Transportation: A Basic Need in Nigeria”. ITCC Review (December).
3.
Adeniji K. 1983. „Nigerian
Municipal Bus Operations”.
Transportation Quarterly XXXVII(1): 135-143.
4.
Agunloye O.O. 2012. „Analysis
of the travels of public transport passengers (road) in Ikorodu, Lagos, Nigeria”.
Journal of Geography and Regional Planning 4(7): 443-448.
5.
Albalate Daniel, Bel Germà.
2012. „High‐speed rail: Lessons for policy makers from experiences
abroad”. Public Administration Review 72(3): 336-349.
6.
Asiyanbola Raimi Abidemi. 2007.
„Intra-urban transportation, gender and psychological distress in
developing countries: Nigeria”. In: PRIPODE Workshop on Urban
Population, Development and Environment Dynamics in Developing Countries. Nairobi, Kenya. P. 11-13.
7.
Ayeni Bola. 1998. Urban Geography. Areola Olusegun and Okafor I. Stanley (eds.)
50: 75-97.
8.
Aworemi J.R., Salami A.O., Adewoye J.O.,
Ilori M.O. 2008. „Impact of socio-economic characteristics on formal and
informal public transport demands in Kwara state, Nigeria”. African
Journal of Business Management 2(4): 72-76.
9.
Aworemi J.R., Ilori M.O. 2008.
„An evaluation of the performance of private transport companies in
selected Southwestern of Nigeria”. Global Journal of Business
Management 2(12): 1-7.
10.
Barnum Darold T., Sue McNeil, Jonathon
Hart. 2007. „Comparing the efficiency of public transportation subunits
using data envelopment analysis”. Journal of Public Transportation
10(2): 1-16.
11. Fadare, Olawale. 1991. “The
Characteristics and Planning Potentials of small and medium sized cities in
Nigeria”. Studies in Environmental Studies in West Africa 11:
53-60. Trieste University, Italy.
12. Fadare, Olawale. 1990. “Problems of
rural-urban passenger flow: The example of Oranmiyan local Government”. Ife
Social Sciences Review 11(1-2): 88-97.
13.
Filani M.O., Abumere S.I. 1993. Operational Efficiency in the Provision of
Mass Transit Services by State-owned Transit Companies in Nigeria. Urban Passenger Transportation in Nigeria.
Heinemann Educational Books (Nig.) Plc.
14. Gubbins Edmund J. 1998. Managing transport operations.
The Institute of Logistics and Transport. Kogan Page
Limited, United Kingdom. Third Edition.
15.
Hay A. 1984. „The subsidy of
urban public transport in Geography and the urban Environment”. Progress
in Research and Application 6.
16.
Kirby R.F., K.U. Bhatt, M.A. Kemp,
R.G. McGillivary, M. Wohl. 1974. Para Transit: Neglected Options for Urban
Mobility. No. UMTA-CA06-0045-74-2. Washington,
D.C: The Urban Institute.
17.
Matas Anna. 2004. „Demand and
revenue implications of an integrated public transport policy: the case of
Madrid”. Transport Reviews 24(2): 195-217.
18. National Population Commission (NPC). 2008.
19.
Ngoka N.I. 1998. „Towards an
effective transport system in Nigeria”. Business Times (Lagos). Monday June 27: 12.
20.
Nutley Stephen D. 1998. „Unconventional
modes’ of transport in the United Kingdom – A review of types and
the policy context”. Transportation Research Part A: General 22(5):
329-344.
21. Paaswell Robert E., Wilfred W. Recker. 1978. Problems of
the Carless. Praeger Publishers, New York.
22.
Parker Brian. 1979. „An
Appropriate Approach to Transport Planning”. Built Environment 2: 125-135.
23.
Polat Cihat. 2012.”The demand
determinants for urban public transport services: a review of the literaturę”.
Journal of
Applied Sciences 12(12): 1211-1231.
24.
Pucher John. 1988. „Urban
travel behavior as the outcome of public policy: the example of modal-split in
Western Europe and North America”. Journal of the American Planning
Association 54(4): 509-520.
25. Plumber A.J. 1979. „Factors influencing
the operational efficiency of lorries in Srilanka”. PTRC Summer Annual Meeting, Proceeding of Seminar, Transport Planning in Developing
Countries.
Received 20.01.2021; accepted in revised form 30.04.2021
![]()
Scientific
Journal of Silesian University of Technology. Series Transport is licensed
under a Creative Commons Attribution 4.0 International License