Article
citation information:
Kubik, A., Stanik, Z., Hadryś,
D., Csiszár, C. Impact of selected operational parameters on measures of technical
condition of rolling bearings in means of transport built based on analysis of
vibration signals. Scientific Journal of
Silesian University of Technology. Series Transport. 2021, 111, 89-98. ISSN: 0209-3324. DOI: https://doi.org/10.20858/sjsutst.2021.111.7.
Andrzej KUBIK[1], Zbigniew STANIK[2], Damian HADRYŚ[3], Csaba CSISZÁR[4]
IMPACT
OF SELECTED OPERATIONAL PARAMETERS ON MEASURES OF TECHNICAL CONDITION OF
ROLLING BEARINGS IN MEANS OF TRANSPORT BUILT BASED ON ANALYSIS OF VIBRATION
SIGNALS
Summary. This article presents an innovative method of diagnostics
of rolling bearings used in the bearing nodes of motor vehicles, with the use
of a prototype specialist stand. The tests were carried out based on a
developed research plan, which included the impact of damage to the bearing and
tyre of the vehicle, as well as the vehicle speed. Vibration accelerations were
recorded in three measurement axes. Signal spectra were created based on the
time courses of the vibration signals and were further analysed. The presented
method is aimed at detecting excessive wear of rolling bearings in wheels from
its early period.
Keywords: vibration diagnostics, bearing, wear, means of transport
1. INTRODUCTION
Extensive
use of rolling bearings in operating means of transport necessitates the
evaluation of their technical condition. This is related to, among others, high
costs of removing failures, often caused by damage to rolling bearings. Often,
the cost of the rolling bearing is small to the costs associated with their
replacement and damage to other parts or the whole components whose correct
operation is dependent on the condition of the bearings [3, 4, 7, 9, 10, 14,
17-19]. Figure 1 shows an example of rolling bearing damage.
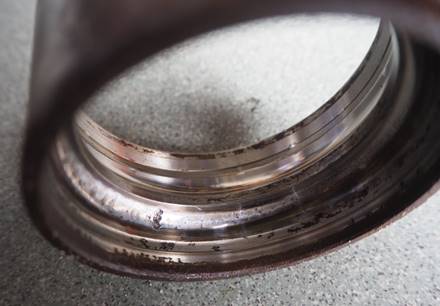

Fig. 1. Damage to the outer race of a rolling wheel bearing of a vehicle - marked in red
Usually,
during normal operation, wear of rolling bearings is a long-term process
stretched over the lifetime of a given machine. Generally, bearings undergo
fatigue wear (approx. 70 to 80%), much less often rolling bearings undergo
abrasive wear (from approx. 20 to 30%)
[2, 16].
Often, the life of rolling bearings is shortened due to errors related to incorrect use and maintenance. Common factors that reduce the life of rolling bearings include incorrect axial loads, incorrect assembly, shaft deformation, inadequate shaft and housing tolerances, excessive preload, unsuitable lubricant, foreign bodies (for example, sand), wear corrosive, inadequate selection of bearings for given operating conditions, inadequate rotational speed and faulty housing bore having a major impact on proper or incorrect bearing fit.
Assessment of the technical condition of bearings can be carried out based on specific symptoms accompanying the operation of the bearing hub. Such symptoms include lubricant contamination, noise, increased bearing resistance, vibration and temperature [8].
Given the above symptoms, rolling bearing diagnostics based on the analysis of vibration signals seems to be the most reasonable, due to its non-invasive character - no need to dismantle the bearing. Another advantage is its ability to detect wear at a relatively early stage [15].
This article attempts to address the subject related to the impact of selected operating parameters on measures of technical condition of bearings built based on the analysis of vibration signals.
2. THEORY OF VIBRATION OF ROLLING BEARINGS
Each rolling bearing is a vibration generator. Despite advanced production technology, we are not able to make perfectly smooth surfaces. The production process carried out is characterised to result in a surface roughness at the appropriate level. This level will be conditioned by the applied machines and production technology. During the cooperation of two elements with a given surface roughness, for example, cooperation of the bearing ball with its outer race, vibrations will be generated [1, 11, 13]. During the operation of rolling bearings, regardless of the type of damage, they have the nature of local geometric deformation. Each impulse forcing of the elastic system is characterised such that the system responds dynamically depending on the function of the system's passage through local geometric deformation. The sequence of pulses generated by vibrations can be described by Equation 1 [5, 6, 15]:
![]()
![]() (1)
(1)
where:
δ – the Dirac puls, ![]() - time interval between successive
strokes, S(t) –the change in load acting on the damage in time.
- time interval between successive
strokes, S(t) –the change in load acting on the damage in time.
Therefore, from the viewpoint of vibration diagnostics, the spectral image that can be obtained after performing the Fourier transform is important. The transform shows the dependence of the signal time variable in the form of a frequency image. It is one of the most commonly used methods of frequency analysis of digital signals. The general form of the total transform is [5, 6, 8]:
![]() (2)
(2)
where:
t – time,
f – frequency.
Changes in the analysed signal in a certain unit of time can take many instantaneous values. For the analysis is not required to observe the change in the instantaneous. Defining the value of the data signals defining characteristic points is made possible by estimated dimensional, for example, the average value, the correlation function of their own, mean-value, effective value.
The RMS (xrms) value is the root of the mean square value [5, 6, 8]:
![]() (3)
(3)
3. RESEARCH PLAN AND PRESENTATION OF RESULTS
The basic element enabling the conducting of the test procedure for assessing the technical condition of the rolling bearings of the road wheels is a diagnostic device that allows acceleration of the road wheels in a wide range of rotational speed, adjustment of the load on the bearing node and monitoring and recording of vibration signals in three axes X, Y, Z sensors located near the examined bearing hub.
The
experimental tests and calculations were carried out following the
statistically established plan of a multi-selective experiment, consisting of
determining the input quantities and their position concerning the base-mid
point. The experimental plans allow determining the influence of individual
factors on a normalised scale (x1, x2, x3)
on the final value of xRMS.
The design of the experiment for the three input factors on the normalised scale is presented in Table 1 [10, 12]. The values in Table 1: -1,0,1, define the minimum, average and maximum values of a given factor on a standardised scale, which should be referred to as the value in the next step, but on the real scale.
Tab. 1
Research experiment plan
- factors on a normalised scale
|
Measurement |
x1 |
x2 |
x3 |
|
1 |
-1 |
-1 |
1 |
|
2 |
1 |
-1 |
-1 |
|
3 |
-1 |
1 |
-1 |
|
4 |
1 |
1 |
1 |
|
5 |
-1 |
0 |
0 |
|
6 |
1 |
0 |
0 |
|
7 |
0 |
-1 |
0 |
|
8 |
0 |
1 |
0 |
|
9 |
-1 |
-1 |
1 |
|
10 |
1 |
-1 |
-1 |
|
11 |
-1 |
1 |
-1 |
Then, to create an experiment plan for factors on a real scale, define the input factors x1, x2, x3 and assign their minimum, average and maximum values of input factor. The following is a description of the input factors for the real scale, as the control factors have been selected x1 - technical condition of the wheel and bearing node:
Then, as input factor x2 was defined - the speed of the vehicle wheel:
As the input factor x3 is defined - direction measuring relative to the vehicle's axis of rotation.
Table 2 shows the values of the factors in the real scale due to which the research was carried out.
Tab. 2
Research experiment plan – real scale
factors
|
Measurement |
x1 |
x2 |
x3 |
|
1 |
Damaged bearing and tyre |
67 km/h |
Z |
|
2 |
New bearing and new tyre |
67 km/h |
X |
|
3 |
Damaged bearing and tyre |
112 km/h |
X |
|
4 |
New bearing and new tyre |
112 km/h |
Z |
|
5 |
Damaged bearing and tyre |
90 km/h |
Y |
|
6 |
New bearing and new tyre |
90 km/h |
Y |
|
7 |
Damaged bearing and new tyre |
67 km/h |
Y |
|
8 |
Damaged bearing and new tyre |
112 km/h |
Y |
|
9 |
Damaged bearing and tyre |
90 km/h |
X |
|
10 |
New bearing and new tyre |
90 km/h |
Z |
|
11 |
Damaged bearing and tyre |
90 km/h |
Y |
The object of this study was the right wheel hub bearing front passenger vehicle equipped with double ball bearing. On the side, the outer side of the tyre was observed a bulge, which might indicate a damaged braid. Figure 2 presents a prototype stand for assessing the technical condition of the road vehicle wheel bearing hub during the experiment with the vehicle tested. In the created experiment plan, the mathematical model is a second degree polynomial, the formula (4) of the general form of which is [12]:
![]() (4)
(4)
The vehicle speed values proposed in the experiment plan were selected according to the case of the vehicle moving at the speed allowed in the undeveloped area. Signal sampling frequency was 51.2 kHz. The bearing node consisted of a hub, a double-row ball bearing and a bearing pin. Figure 3 shows the mounting of vibration acceleration sensors.
The determined effective xrms values for individual runs related to different directions of measurements X, Y, Z following the experiment plan are presented in Table 3.
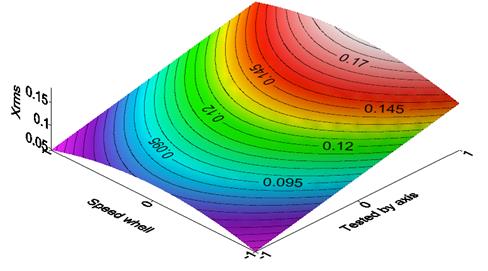
Due to the fact that the tests were carried out according
to the optimal plan of the experiment, the calculated effective signal values
can be presented, depending on the adopted input factors. Figure 4 shows sample
results of the effective value of the signal for a damaged bearing and damaged
tyre, depending on the set wheel speed and measuring direction. As observed, the
highest effective values are obtained for conditions of intermediate value of
rotational speed (x1 = 0), that is, 90 km/h speed and measuring
direction according to the Z-axis.
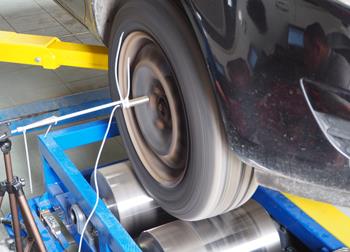
Fig. 2. Prototype stand during testing of the vehicle wheel bearing function


Fig. 3.
Locations for mounting vibration acceleration sensors (marked in red)
and determining their coordinate axis
Tab. 3
RMS (xrms) results for the tests performed
according to the experimental plan
|
Measurement |
xrms
[m/s2] |
|
1 |
0,0584 |
|
2 |
0,0532 |
|
3 |
0,1429 |
|
4 |
0,0506 |
|
5 |
0,1227 |
|
6 |
0,0895 |
|
7 |
0,0795 |
|
8 |
0,1804 |
|
9 |
0,0925 |
|
10 |
0,0972 |
|
11 |
0,1409 |
![]()
Fig. 4. The results of the effective value of the signal for the case x1 = -1, depending on the rotational speed of the wheel and the tested axle
Thereafter, based on measurements and recorded vibration
signals, Fourier transforms were performed to obtain a frequency image of the
signal. Figures 5-7 show the waveforms of vibration acceleration for a wheel
speed of 112 km/h, various technical conditions and different measuring axes.
In Figure 5, the waveforms of the vibration acceleration
spectrum for measurements in the X-axis for the states x1 =
-1 - marked in red, x1 = 0 - marked in yellow and x1 = 1
- marked in green are in the frequency ranges of 1500 to 5500 Hz to each other.
In the frequency range from 500 to 1500 Hz, the values of vibration
acceleration are clearly lower due to a decrease in the vibration energy in this
range, owing to the mounted new bearing and a new tyre.
Fig. 5. Vibration acceleration spectrum (frequency) for wheel speed 112 km/h and measurement in the Y-axis, where red - damaged bearing and damaged tyre, yellow - damaged bearing and new tyre, green - new bearing and new tyre
Figure 6 presents the spectrum of vibration accelerations
for measurements in the Y-axis for the states x1 = -1
- marked in red, x1 = 0 - marked in yellow and x1 = 1 -
marked in green. On the spectrum of vibration acceleration spectra, it can be
observed that changing a damaged bearing to a new one and replacing a damaged
tyre with a new one causes a decrease in the vibration energy in the frequency
range from 500 to 2000 Hz. The remaining frequency range overlaps regardless of
the tested technical condition of the bearing node. Installing a new tyre
reduces the energy of vibrations generated in the higher frequency range - from
4500 to 5000 Hz.
Fig. 6. Vibration acceleration spectrum (frequency) for wheel speed 112 km/h and measurement in the Y-axis, where red - damaged bearing and damaged tyre, yellow - damaged bearing and new tyre, green - new bearing and new tyre
Figure 7 presents the spectrum of vibration acceleration
for measurements in the Z-axis for the states x1 = -1 - marked in red, x1
= 0 - marked in yellow and x1 = 1 - marked in green. The tests
performed in the Z-axis correspond to the lateral displacements of the bearing
node and the road wheel. On the spectrum of vibration acceleration spectra, it
can be observed that changing a damaged bearing to a new one and replacing a
damaged tyre with a new one causes a significant reduction in the vibration
energy in the frequency range from 50 to 2250 Hz. The frequency range from 5000
to 6500 Hz represents a significant decrease in vibration energy for the
considered case of a damaged bearing and a new tyre. This is due to levelling
the lateral displacement of one wheel that occurred in the case of a damaged
tyre.
4.
CONCLUSION
Regardless of the technical condition, each rolling bearing generates vibrations. The level of vibration generated can be enhanced, for example, by a damaged tyre mounted on the vehicle or, by inappropriate tyre pressure. The diagnostic methods used to date - the sense of hearing of the diagnostician, are subjective and should not be used to assess the technical condition. The vehicle wheel hubs are one of the most important elements responsible for the safety of passengers in the vehicle and its surroundings.
The application of the experiment plan made it possible to carry out this planned research and create a dependence of the influence of factors x1, x2 and x3 on the xrms value. This is an extremely valuable feature of planning experiments. The use of the developed test method for diagnosing the technical condition of rolling bearings of road wheels allows for the preparation of an appropriate testing algorithm, considering the nature of the work of a given bearing node and its parameters.
Because of the measurements, specific signal waveforms were obtained, which were then subjected to time-frequency analysis, which allowed identifying components with a characteristic frequency corresponding to the damage to the outer race. As can be done easily in Figures 5-7, change of tuners x1, x2, x3 introducing power changes in the frequency range 500-1500 Hz. Based on the conducted tests, the following conclusions can be stated:
-
testing wheel bearing
hubs using vibroacoustic tests allows to state the technical condition of the
tested hub bearing,
-
it is possible to
determine the technical condition of cooperating elements, for example,
technical condition of a tyre,
-
the prototype
stand enables the simulation of bearing conditions similar to real conditions, corresponding to urban traffic,
-
the stand ensures that
the measurement conditions are repeated.
Fig. 7. Vibration acceleration signal waveforms and vibration acceleration spectrum (frequency) for wheel speed 112 km/h and measurement in the Z-axis, where red - damaged bearing and damaged tyre, yellow - damaged bearing and new tyre, green - new bearing and new tyre
Acknowledgements
The research for this article was performed by the Research
University program at the Silesian University of Technology, 2020 - grant
no. 12/010/SDU/10-22-01.
References
1.
Batko Wojciech,
Andrzej Mikulaski. 2002. „The use of wavelet methods in the vibroacoustic
monitoring systems of the hoisting device bearing”. Diagnostyka 26: 7-12. ISSN: 2449-5220.
2.
Cempel Czesław.
1978. Applied vibroacoustics. Warsaw:
PWN. ISBN: 83-01-09034-0.
3.
Chiliński
Bartosz. 2014. “The proposal of the bearing arrangement to work in a
swinging motion”. Mechanical
Overview 1(14): 15-18. ISSN 2354-0192.
4.
Chudzik A., B. Warda. 2020. „Fatigue life
prediction of a radial cylindrical roller bearing subjected to a combined load
using FEM”. Eksploatacja i
Niezawodnosc – Maintenance and Reliability 22(2): 212-220. DOI: http://dx.doi.org/10.17531/ein.2020.2.4.
5.
Cioch Witold, Oskar
Knapik, Jacek Leśkow. 2013. “Finding a frequency signature for a
cyclostationary signal with applications to wheel bearing diagnostics”. Mechanical Systems and Signal Processing
38(1): 55-64. ISSN: 0888- 3270.
6.
Dąbrowski
Zbigniew, Jacek Dziurdź. 2007. “New concept of using coherence
function in digital signal analysis”. Machine
Dynamics Problems 31(3): 25-31. ISSN: 0239-7730.
7.
Deuszkiewicz Piotr,
Stanislaw Radkowski. 2003. “On-line condition monitoring of a power
transmission unit of a rail vehicle”. Mechanical
System and Signal Processing 17(6): 1321-1334. ISSN: 0888- 3270.
8.
Engel Zbigniew. 1981. Vibrations in technology. Wrocław:
The Ossoliński National Institute. ISBN: 83-04-00646-4.
9.
Figlus Tomasz. 2019.
“A Method for Diagnosing Gearboxes of Means of Transport Using
Multi-Stage Filtering and Entropy”. Entropy
21(5): 1-13. ISSN 1099-4300.
10.
Huang H.-Z., K. Yu, T.
Huang, H. Li, H.-M. Qian. 2020. „Reliability estimation for momentum
wheel bearings considering frictional heat”. Eksploatacja i Niezawodnosc – Maintenance and Reliability
22(1): 6-14. DOI: http://dx.doi.org/10.17531/ein.2020.1.2.
11.
Junsheng Cheng, Yu
Dejie, Yang Yu. 2007. “Application of an impulse response wavelet to
fault diagnosis of rolling bearings”. Mechanical
Systems and Signal Processing 27(2): 920-929. ISSN: 0239-7730.
12.
Polański
Zbigniew. 1984. Planning experiments in
technology. Warsaw: PWN.
ISBN: 83-01-04507-8.
13.
Radkowski Stanislaw.
2008. “Vibro-acoustic diagnostics of low-energy stage of failures
evolution”. Proceedings of the
Institution of Mechanical Engineers Part G Journal of Aerospace Engineering
223: 589-597. ISSN: 0954-4100.
14.
Randall Robert. 2011. Vibration-based Condition Monitoring:
Industrial, Aerospace and Automotive Applications. Chichester: Wiley. ISBN:
978-0-470-74785-8.
15.
Raymond A. Guyer.
1996. Rolling Bearings Handbook and
Troubleshooting Guide. Ohio: Taylor & Francis. ISBN: 97-80-801988-714.
16.
Stanik Zbigniew. 2013.
Diagnosing rolling bearings of motor
vehicles with vibroacoustic methods. Radom: Scientific Publisher of the
Institute of Sustainable Technologies – National Research Institute.
ISBN: 978-83-7789-204-6.
17.
Strączkiewicz
Marcin, Piotr Czop, Tomasz Barszcz. 2016. „Supervised and unsupervised
learning process in damage classification of rolling element bearings”. Diagnostyka 17(2): 71-80.
18.
Wang Jingyue, Haotian
Wang, Lixin Guo, Diange Yang. 2018. „Rolling Bearing Fault Detection
Using Autocorrelation Based Morpho-logical Filtering and Empirical Mode
Decomposition”. Mechanika
24(6): 817-823.
19.
Zmarzly Pawel. 2020.
„Experimental Assessment of Influence of the Ball Bearing Raceway
Curvature Ratio on the Level of Vibration”. Communications 22(4): 103-111. University of Zilina.
Received 02.01.2021; accepted in revised form 09.05.2021
![]()
Scientific
Journal of Silesian University of Technology. Series Transport is licensed
under a Creative Commons Attribution 4.0 International License