Article
citation information:
Siqueira Silva, D., Csiszár, C., Földes,
D. Autonomous
vehicles and urban space management. Scientific
Journal of Silesian University of Technology. Series Transport. 2021, 110, 169-181. ISSN: 0209-3324. DOI: https://doi.org/10.20858/sjsutst.2021.110.14.
Dahlen SIQUEIRA SILVA[1],
Csaba CSISZÁR[2], Dávid FÖLDES[3]
AUTONOMOUS VEHICLES AND
URBAN SPACE MANAGEMENT
Summary. Discussions on how
urban space would be transformed by the use of autonomous vehicles (AVs) are
scarce. This study identifies the impacts caused by the shared use of AVs on
urban parking and urban space management. An estimation method was
formulated considering the reduction in parking demand, the possible alteration
in vehicle ownership, and the reallocation of urban space. A case study was
performed in a 673,220 m2 area through
scenarios created by using real data of parking spaces and the results of
previous studies. Results showed that parking spaces can be saved with the use
of shared AVs, which would allow the reallocation of urban space to new uses
(for example, implementation of around 12,000 bike-sharing docking spots, 10 km
bike lanes, 7 km additional traffic lane or 140 ‘parklets’).
The results contribute to revealing the positive impacts of AVs.
Keywords: autonomous vehicle, urban space, land use,
shared mobility, reshaping cities
1.
INTRODUCTION
As autonomous
vehicles (AVs) are under development, analysis of their impacts has become
important for understanding how they would affect people and space management.
Existing studies [9,14,19-22] focused on formulating
models and calculating the reduction in the number of vehicles and parking
spaces. However, discussions on how urban space may be transformed were barely
made. Therefore, this research focuses on the transformation in urban space
generated by the use of AVs considering how changes in number, location and use
of parking spaces could save urban space and which new functions could be given
to them.
A method was
developed to estimate the reduction in demand for parking according to
alteration in ownership and the shared use of autonomous vehicles (SAV), as well as to estimate the new uses of the urban
space saved according to the priorities of decision makers. In this study, all
members of the society that are able to make decisions regarding future changes
in the city are considered decision makers. To demonstrate the applicability of
the method, a case study was performed in an area in Budapest, Hungary.
Different scenarios were created based on previous studies and real data of
parking spaces were applied.
This paper is
structured as follows: results of relevant literature are revealed in Section
2. The developed estimation method, the scenarios and the collected data are
presented in Section 3. The results and findings are discussed in Section
4. This paper is completed by concluding remarks including future research
directions.
2.
STATE OF THE ART
2.1.
Autonomous vehicles in a sharing system
A
car is parked approximately 95% of its lifetime [18]. The average car spends
about 80% of the time parked at home, is parked elsewhere for about 16% of the
time, and thus, only in movement for the remaining 4% [15Błąd! Nie można odnaleźć
źródła odwołania.]. The main
motivation to use private vehicles is work-related, which causes a high parking
demand in the daytime, having the overall average parking time of 3.5 hours [15,18]. Nowadays, drivers need to walk to the parking location
to pick up their vehicles. Furthermore, cruising for parking spot results in a
tremendous amount of excess driving causing air pollution, crashes and traffic
congestion [10,11,18,22]. Nevertheless, the access
walking distance and cruising for a parking space are not a problem for AV
users. There is no need to park the vehicle close to the destination. However,
reaching a distant and cheaper parking space can increase the empty runs and vehicle
miles travelled, generating additional cost, and consequently, the need for a
centralised parking management and control of AVs. Some modelling studies
carried in the United States [6,20] and Europe [1,2] show that the use of
private AVs increase vehicle miles travelled, reduce public transport use and
slow modal shift. Moreover, it leads to a more dispersed urban growth [16,17].
AVs
have the potential of becoming a major catalyst for urban transformation (for
example, changing urban infrastructure, city design, mobility habits, and time
spent during travelling) [5]. It is suggested that the use of SAV fleet could mitigate current issues, such as increasing
car ownership, traffic congestions and, subsequently, the time spent travelling
daily. To reach the benefits, the social acceptance of AVs is needed, however,
technophobia was found as a significant factor against AV use [12].
The
impacts of the three types of ownership and market acceptance scenarios that
may shape the future demand for parking are [13]:
·
Private use: the number of car parking might be
the same as today, however, changes in their location might occur as AVs can
park far away from the destination.
·
Shared use, but single occupancy: fewer parking
spaces are expected, the duration of parking would be reduced due to sharing.
·
Shared use with multiple occupancy: only a few
vehicles need to park, and the location of parking spots is in strategic
locations to provide mobility service with minimum waiting time.
Private
shared use can be also distinguished if the privately owned vehicle is shared
among acquaintances and family members. Moreover, AVs can park more efficiently
than humans, the on-street parking spaces might decrease independent of the
reduction in vehicle number. Furthermore, on-street parking might be exchanged
to off-street parking such as parking garages which could be automatised. Automatisation
optimises the available space for its construction as they do not need
facilities for human use. In addition, off-street parking may serve as points
for charging, cleaning, maintenance and waiting areas for SAVs.
Moreover, the multi-row layout could also reduce parking space. A relocation
strategy could be used to release barricaded vehicles. The extent of vehicle
relocation depends on the layout of the car park; square-shaped car parking
spaces can be more effective. The use of AVs can decrease the need for parking
space by an average of 62% and a maximum of 87% [7].
Main
finding of existing studies regarding the alteration of parking space caused by
the different ownership of AVs are summarised in Błąd! Nie można odnaleźć
źródła odwołania.. The detailed
results were used as inputs for the developed method presented in this paper.
Tab.
1
Studies about
reduction of parking spaces
|
Ownership |
Study |
Study area |
Characteristics |
Reduction in parking spaces |
|
Private Shared |
[20] |
Atlanta, USA |
SAVs among the members of the same household |
-9.5% number of
private vehicles, +15 minutes travel
time per trip, -12.3% parking space
|
|
Shared, single occupancy |
[18] |
Boston, USA |
33% or |
-16% or
-48% parking space |
|
[5] |
Atlanta, USA |
SAV, 5% market penetration level |
-90.3% and
-92.4% parking spaces; |
|
|
[9] |
Lisbon, Portugal |
100% or
50% SAVs |
-89.3% or -21.2% parking spaces |
|
|
Shared, multiple occupancy |
[14] |
Munich, Germany |
AV taxi fleet,
0%, 20% or 40% taxi |
40% penetration
rate, 1 AV taxi can replace 3 conventional cars |
|
[13] |
General |
2% of market penetration
level |
-90% parking spaces with ridesharing |
|
|
[9] |
Lisbon, Portugal |
100% or
50% SAVs |
-94.4% or -24.2% parking spaces |
Former
on-street parking areas could be divided into lanes for bicycles, other
micro-vehicles or public transportation services. Consequently, urban space
management may be renewed promoting walkability as well as areas focusing on
well-being.
2.2.
Pick-up and drop-off areas
One
of the most important aspects considered in designing the urban space for AVs
is the pick-up and drop-off areas, especially in the case of shared use.
Designated space is needed to eliminate conflicts with the surrounding roadways
and parking spaces.
The
aspects to be considered when designing drop-off and pick-up areas are
location, style, sign, connection and comfort.
·
The location of these areas should be
close to the entrance of buildings, allowing users to quickly get in or get
off. Separated pick-up and drop-off areas are preferable so as to reduce
conflict areas and a better flow of users, however, common pick-up/drop-off
area could be built if the space is limited.
·
The style of the areas should represent
the functionality to distinguish it from other infrastructure elements.
·
The areas should have signs indicating
their delimitations to support travellers and avoid misuse of it.
·
Seamless connection should be designed between
pick-up and drop-off areas to allow AVs to quickly pick another passenger after
dropping-off the previous one.
·
A high level of comfort is needed during
the waiting time (benches, phone charging, lighting, internet, etc). However, the waiting time can be minimised with
efficient demand-capacity coordination.
Concluding
the results of the state of the art, the alteration in parking management as
the consequence of AVs is presented in Błąd! Nie można odnaleźć
źródła odwołania.. Urban space
is composed of private space and public space, such as streets, parking areas,
green spaces, parks, and squares. After the introduction of AVs, especially SAVs, the use of urban public space will be altered. The
most important impacts are fewer parking spots, off-street parking facilities
instead of on-street parking spaces, remote parking, parking close to each
other and reallocation of urban spaces.
3.
METHODOLOGY
3.1.
Estimation method for urban space transformation
The
modal share, the type of ownership and parking could cause a significant
alteration in public parking space management, which could be transformed into
new uses according to the priorities of decision makers. However, the travellers’
willingness to walk to take an AV might influence how much of the saved parking
spaces would be transformed to pick-up and drop-off areas. To estimate the size
of the area allocated for new uses and to assume the type of the new uses (bike
lanes, green areas, etc.) after the adoption of SAV
fleet, a method was elaborated considering the aspects presented in Błąd! Nie można odnaleźć
źródła odwołania..
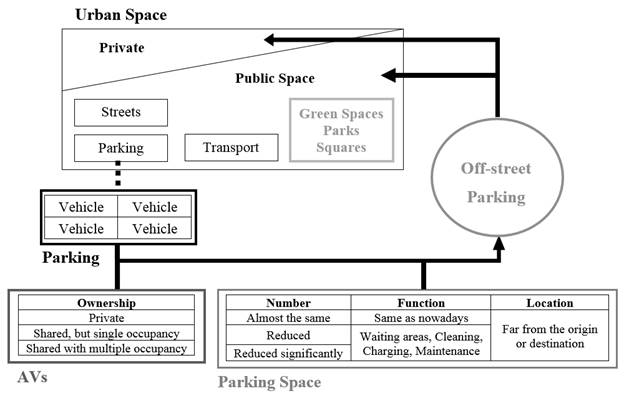
Fig. 1. Urban space in the future with
the use of AV
Fig. 2. Aspects considered creating new uses
for public space
The
annual alteration of urban space and future parking demands are considered due
to the expected increase in AV adoption. This method provides predictions
regarding changes in urban space management as a tool for city planners. The
result of this method is the future parking demand and possible reallocation of
urban space. As a limitation, alterations in population and the location of
households are not considered. Furthermore, alteration in loading points and
charging spots for electric vehicles are neglected. The used indexes are presented
in Tab. 2, the variables used
during the calculation are introduced in Tab. 3.
Tab.
2
Indexes
|
Sign |
Name |
Set
of value |
|
|
Parking
alignment |
k=1..z (1: parallel, 2: 45°,
3: 90°, etc.) |
|
|
Type
of ownership |
j=1..m (1: private, 2: private
shared, 3: shared with single occupancy, 4: shared with multiple occupancy,
etc.) |
|
|
Type
of new use |
x=1..y (1: public transportation,
2: improving walkability,3: bike-related
strategies, 4: additional traffic lane, etc.) |
Tab.
3
Variables
|
Sign |
Description |
|
|
Rate of increase in the number of conventional
vehicles in year t |
|
|
Number of conventional vehicles in the year t-1
according to j ownership |
|
|
Rate of increase in the number of AVs in the
year t according to j ownership |
|
|
Number of AVs in the year t-1 according
to j ownership |
|
|
Percentage of saved parking space caused by
autonomous vehicles according to j ownership |
|
|
Percentage of off-street parking space from
the total parking spaces |
|
|
Percentage of parking spaces according to k
arrangement |
|
|
Area of each parking space according to k
arrangement [m2] |
|
|
Rate indicating how many private areas will be
created in year t |
|
|
Percentage of private area created in the
previous year (t-1) |
|
|
Rate indicating how much pick-up and/or
drop-off areas will be created in year t |
|
|
Percentage of pick-up and drop-off area
created in the previous year (t-1) |
|
|
Rate of space applied for new use related to x
new use |
|
|
Area for x new use correspondent to the
previous year (t-1) |
Step 1: Number of parking spaces according to demand
The demand for parking in year t (D(t))
is calculated according to (1).
|
|
(1) |
Step 2: Demand for a parking area
The necessary area for parking in year t (P(t))
[m2] is calculated according to
(2).
|
|
|
(2) |
Step 3: Percentage of saved spaces used for private areas and pick-up
and drop-off areas
Saved space is defined as the extra space resulting from the reduction
of parking demand caused by the use of SAV fleet. The
percentage of it (Dm(t)) decided to use for private areas or pick-up and drop-off areas by
decision makers is calculated in (3).
![]() (3)
(3)
Step
4: Area allocated for new uses
The size
of the area in the year t (N(t)) [m2] allocated for new
uses is calculated according to (4) or (5). The latter considers the combination of areas for new uses, such as an area for
cycling or for public transportation, as well as the rates of
increment/decrement of this portion of land considering decision makers’
priorities.
|
|
|
(4) |
|
|
|
(5) |
3.2.
Creation of scenarios
Creation
of scenarios represents an important tool to analyse how beneficial the
adoption of SAV fleet is for the reduction of parking
spaces. Five scenarios were created (Tab. 4) and their characteristics were
based on previous studies [9,13,20]. Scenarios
simulating the transitional period, when the whole vehicle fleet is not fully
composed by AVs, were created to analyse whether AV acceptance in this period
would bring significant benefits. It is important to notice that Scenario 4
(transitional) presents private AV fleet and, in Scenario 5 (mix), the fleet is
private but shared among members from the same household. It was assumed that
population and land use would remain the same, as well as reduction of parking
spaces in Scenarios 4 and 5, would happen proportionally to the results
obtained from Scenarios 1, 2 and 3 according to the type of ownership. For
instance, in Scenario 5, the private SAV fleet would
have 9.5% reduction in parking spaces according to the result in Scenario 1.
Tab. 4
Scenarios
assumed with the use of AVs
|
Scenario |
Condition |
Input Parameters |
|
1 |
Private ownership |
9.5% reduction in
private vehicles with private sharing. |
|
2 |
Shared, single |
89.3% reduction in
parking spaces with 100% shared fleet. |
|
3 |
Shared, multiple occupancy |
94.4% reduction
in parking spaces with 100% shared
fleet. |
|
4 |
Transitional |
AV private fleet:
27%, shared single occupancy fleet: 33%, shared multiple occupancy fleet:
40%. |
|
5 |
Mix |
Private SAV fleet: 10%, shared single occupancy fleet: 50%,
shared multiple occupancy fleet: 40% |
3.3.
Data Collection
The
following data should be collected according to the segments (for example,
sides of a block):
·
the number of parking spaces,
·
the location of parking spaces (for example,
both sides of the street),
·
arrangement of parking spaces (parallel, 45°
or 90°),
·
whether the parking space takes part of the
sidewalk and what the extension of the sidewalk occupancy is,
·
characteristics of
the surroundings.
The
values used for calculation about the occupied area of parking spaces are based
on the dimensions according to the type of parking space shown in Fig. 3.
|
|
|
|
|
a=5m, b=2.5m, c=3.5m; |
a=5.2m, b=2.5m, c=3.5m; |
a=5.5m, b=2.5m, c=5m |

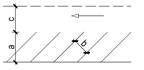
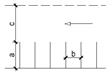
Fig. 3. Dimensions of the parking
spaces according to the type
(Source: BME, Department of
Industrial and Agricultural
Building Design, 2013)
To
prove the applicability of the developed estimation method, it was applied to
an area in the district XI of Budapest, Hungary. It is mainly a residential
area, however, it includes a big shopping mall and a university as it is
delimited by important public transportation stations with underground and
several tram lines. Błąd! Nie można odnaleźć
źródła odwołania. illustrates
the delimitation of the studied area. The district is 33,490,000 m2 and had 148,517 inhabitants in January 2019
according to the National Statistical Office. The area of study has
approximately 673,220 m2 which would be
occupied by around 3,000 inhabitants considering a uniform distribution of
population on land. The data regarding parking spaces was collected on field.
The area was divided into 120 segments. Photos were taken to support the
analysis about how urban space is used.
University Shopping Mall
![]()
![]()
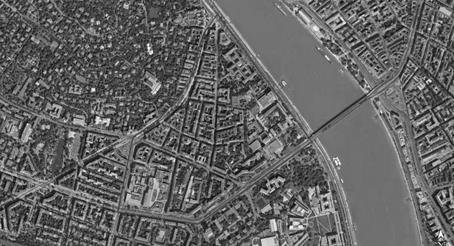
Fig. 4. Delimitation of the studied area (Source: Google Maps)
4.
RESULTS AND DISCUSSION
4.1.
Situation analysis
In
the studied area, mainly on-street parking spaces have been created. This type
of parking was considered the easiest solution for managing the increasing
parking demand due to the limited number of garages as the buildings are old.
As the sidewalks presented large widths, parking was allowed on part of the
sidewalks in several cases. In some sidewalks, the entire vehicle is parked on
the sidewalk and, in others, part of the vehicle is on the sidewalk. Therefore,
sidewalks were shortened and space for pedestrians was reduced.
5%
of the total area, 32,016 m2, is used for
parking. Błąd! Nie można odnaleźć
źródła odwołania. shows the
number of parking spaces and the occupied territory according to type of
parking.
Tab. 5
Number of vehicles and area of parking
|
Type of parking space |
0° |
45° |
90° |
Total |
|
Number of parking space |
1,076 |
1,279 |
141 |
2,496 |
|
Area for parking [m2] |
13,450 |
16,627 |
1,939 |
32,016 |
Two
thousand five hundred parking vehicles were counted during the on field
measurement. As most of the parking spaces do not have delimitation painted on
the floor, excessive space between vehicles may occur. Moreover, additional
space needed for opening the doors will not be necessary with the use of AVs.
52%
of the original space of the sidewalk was taken, leaving small space for
pedestrians. In many situations, the space left is not enough for two people
walking side by side. 8% of sidewalks are narrower or equal to 1.20 m, the
smallest width is 0.9 m, which coincidently happens in the segment where
parking space takes around 85% of the sidewalk. Near popular points of interest
where the number of pedestrians is high, pedestrians must squeeze themselves to
commute. Furthermore, some drivers park their vehicles taking more space than
the delimited parking space, which reduces, even more, the available space for
pedestrians and brings irregularities, presenting danger mainly to the disabled
people [3,4,8].
4.2.
Application of the method
The
results considering the determined scenarios are presented in Błąd! Nie można odnaleźć
źródła odwołania.6.
Furthermore, Błąd! Nie można odnaleźć
źródła odwołania. illustrates
the result of multicriteria analysis relating the
saved space with the correspondent percentage of the area of study, which
allows better visualisation of the benefits. For calculating the saved space,
the elimination of parking spaces at 90 and 45° were the priority as more
space is occupied than the parking space with arrangement of 0°.
Tab.
6
Saved
space in the area of study with use of AVs
|
Scenario |
1 |
2 |
3 |
4 |
5 |
|
Saved parking spaces |
238 |
2,229 |
2,357 |
791 |
948 |
|
Saved space [m2] |
3,200 |
29,083 |
30,747 |
10,389 |
12,430 |
|
Saved space [%] |
0.47 |
4.24 |
4.49 |
1.54 |
1.85 |
Decision
makers have an important question to answer regarding how saved space should be
used. Considering the ideal scenario for having a more liveable city, decision
makers should choose the use of a small percentage of the saved space for
building pick-up and drop-off areas, for example, 20%, and the rest for green
and open spaces. The possible new uses of the saved spaces are shown in Błąd! Nie można odnaleźć
źródła odwołania.. The deployment
of possible bike lanes, additional traffic lanes, parklets
and docking spots in bike-sharing systems instead of parking spaces were
examined. Parklets are defined as areas with benches
and green spaces implemented in areas previously allocated to parking spaces.
Their width has the same dimension as the previous parking space. The parklets were estimated with dimensions of 3.5x50 m, the width of bike lanes was assumed as 2.5 m to
benefit the two directions of bike traffic, the width of traffic lane was
assumed as 3.5 m and the space occupied per a docking spots was assumed as 1x2 m. During the calculation, the ambitious predictions of
the modal shift[4]
for 2030 in Budapest (walking: from 9 to 20%, cycling: from 2 to 10%) was
considered.
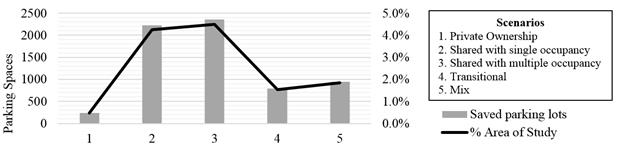
Fig. 5. Saved parking spaces and correspondent percentage according to
the determined scenarios
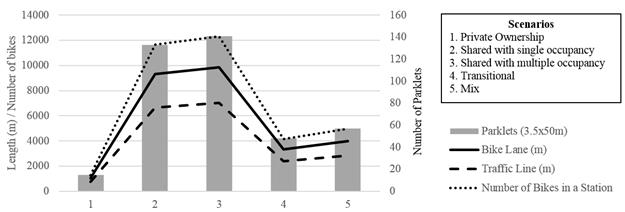
Fig. 6. New uses for the saved parking spaces. (Source:
Author)
Besides
the gained urban space, all of the saved space could be transformed into green
spaces. Additionally, sidewalk expansions could be done, and the estimated
length of the traffic lane may be provided for public transportation.
Furthermore,
a small number of on-street parking spaces could be left for shared use. These
spaces would be used by delivery companies, for loading and unloading, and by
electric vehicle users for charging. Smartphone applications for booking a
parking space may be very useful to improve the efficiency of the SAV service when planning stops for charging, cleaning
and/or maintenance as well as when waiting for a new user.
Finally,
the tendency of the presented results was expected. As there is an increase in
the number of shared vehicles, there is more possibility of reducing the number
of vehicles on the streets, and consequently, the demand for parking spaces.
However, different results are brought depending on the city to which the
method is applied as the needed parking spaces are influenced by the settlement
structure, trip durations and distance travelled.
5.
CONCLUSION
The
introduction of AVs affects urban space management. However, the caused impacts
have not been well known yet. Therefore, this study presented an estimation
method for urban space transformation as the main contribution, considering the
parking demand, the saved parking space and its reallocation.
It
was found that the more SAVs fleet are used, the more
savings in parking spaces are achieved which may receive new uses according to
decision makers’ priorities. Results showed that parking spaces can have
new uses, such as the implementation of around 12,000 bike-sharing docking
spots, 10 km bike lanes, 7 km additional traffic line or 140 ‘parklets’. The results presented practical
applicability because they can suggest the intensity of changes in urban space
management and serve as input in city planning.
The
method should be adapted to local characteristics as parking habits,
distribution and location of parking spaces may vary from one city to another.
Future
research could consider local characteristics relating to the acceptance of AVs
and the priorities of decision makers regarding the changes in urban space
through a questionnaire survey. Furthermore, changes in population and in the
location of households can be included.
Acknowledgement
The
research reported in this paper was supported by the Higher Education
Excellence Program in the frame of Artificial Intelligence research area of
Budapest University of Technology and Economics (BME FIKP-MI/FM).
EFOP-3.6.3-VEKOP-16-2017-00001:
Talent management in autonomous vehicle control technologies. The Project is
supported by the Hungarian Government and co-financed by the European Social
Fund.
References
1. Boesch P.M., F. Ciari, K.W. Axhausen. 2016. „Autonomous vehicle fleet sizes required to
serve different levels of demand”. Transportation Research Record 2542(1):
111-119. DOI: https://doi.org/10.3141/2542-13.
2. Correia G., D. Milakis, B. van Arem, R.
Hoogendoorn. 2015. “Vehicle automation and transport system performance”. In: Handbook on transport
and urban planning in the developed world, edited by M. Bliemer,
C. Mulley, C.J. Moutou. P.
498-516. Cheltenham: Edward Elgar. ISBN: 978 1 78347 138 6.
3. Czech
Piotr. 2017. „Physically disabled pedestrians - road users in terms of
road accidents”. In: Lecture
Notes in Networks and Systems 2: 157-165.
DOI: 10.1007/978-3-319-43985-3_14. Edited by: Macioszek E., Sierpinski G. Contemporary challenges of transport systems
and traffic engineering. 13th Scientific and Technical Conference on
Transport Systems. Theory and Practice (TSTP).
Katowice, SEP 19-21, 2016.
4. Czech
Piotr. 2017. „Underage pedestrian road users in terms of road
accidents”. In: Advances
in Intelligent Systems and Computing 505: 33-44. DOI:
10.1007/978-3-319-43991-4_4. Edited by: Sierpinski G.
Intelligent transport systems and travel behaviour. 13th Scientific and Technical Conference on
Transport Systems. Theory and Practice (TSTP).
Katowice, SEP 19-21, 2016.
5. Duarte F., C. Ratti.
2018. „The Impact of Autonomous Vehicles on Cities: A Review”. Journal of Urban
Technology
25(4): 3-18. DOI:
https://doi.org/10.1080/10630732.2018.1493883.
6. Fagnant D., K.M. Kockelman, P. Bansal. 2015. „Operations of shared autonomous vehicle fleet
for Austin, Texas, market”. Transportation Research Record 2536: 98-106. DOI:
https://doi.org/10.3141/2536-12.
7. Heinrichs D. 2016. “Autonomous Driving and
Urban Land Use”. In: Autonomous Driving, edited by Maurer M., Gerdes J., Lenz B., Winner H. P. 213-231. Germany:
Springer, Berlin, Heidelberg. ISBN: 978-3-662-48845-4.
8. Ignaccolo Matteo, Giuseppe Inturri, Nadia Giuffrida, Michela Le Pira, Vincenza Torrisi, Giovanni Calabrò. 2020. “A step towards walkable environments:
spatial analysis of pedestrian compatibility in an urban context”. European Transport \ Trasporti Europei 76 n. 6. ISSN: 1825-3997.
9. International Transport Forum. 2015. Urban
Mobility System Upgrade - How shared self-driving cars could change city traffic.
Paris: Corporate Partnership Board Report. Available at:
https://www.itf-oecd.org/sites/default/files/docs/15cpb_self-drivingcars.pdf.
10. Jacyna M. 1998. “Some aspects of multicriteria
evaluation of traffic flow distribution in a multimodal transport
corridor”. Archives of Transport
10(1-2): 37-52.
11. Jacyna M., J. Merkisz. “Proecological
approach to modelling traffic organization in national transport system”.
Archives of Transport 2(30): 43-56.
12. Koul S., A. Eydgahi. 2020. ,,The Impact of Social Influence, Technophobia, and
Perceived Safety on Autonomous Vehicle Technology Adoption”. Periodica Polytechnica
Transportation Engineering 48(2): 133-142. DOI: https://doi.org/10.3311/PPtr.11332.
13. KPMG. „Parking demand in the
autonomous vehicle era”. Available at: https://home.kpmg/xx/en/home/insights/2017/07/parking-demand-in-the-autonomous-vehicle-era.html.
14. Llorca C., A.T. Moreno, R. Moeckel. 2017. „Effects of Shared Autonomous Vehicles on the Level of Service in the
Greater Munich Metropolitan Area”. International Conference on
Intelligent Transport Systems in Theory and Practice. Munich, Germany.
Available at: https://www.bgu.tum.de/fileadmin/w00blj/msm/publications/moeckel/2017_llorca_etal.pdf.
15. RAC Foundation. „Spaced Out -
Perspectives on parking policy”. Available at:
https://www.racfoundation.org/assets/rac_foundation/content/downloadables/
spaced_out-bates_leibling-jul12.pdf.
16. Schmidt Marie, Stefan Voss. 2017. „Advanced systems in public
transport”. Public Transport
9(1-2) Special Issue: 3-6.
17. Soteropoulos A., M. Berger, F. Ciari. 2019. „Impacts of automated vehicles on travel behaviour and land use: an
international review of modelling studies”. Transport Reviews
39(1): 29-49. DOI: https://doi.org/10.1080/01441647.2018.1523253.
18. The High Cost of Free Parking by Donald Shoup.
Summarized by Tri-State Transportation Campaign. 350 W 31st Street, New York,
NY 10001 p: (212) 268-7474 f: (212) 268-7333 www.tstc.org.
19. World Economic Forum. 2018. Reshaping Urban Mobility with Autonomous
Vehicles – Lessons from the City of Boston. Geneva: World Economic
Forum, 2018. Available at: http://www3.weforum.org/docs/WEF_Reshaping_Urban_Mobility_with_Autonomous_Vehicles_2018.pdf.
20. Zhang W., S. Guhathakurta, E.B.
Khalil. 2018. „The impact of private
autonomous vehicles on vehicle ownership and unoccupied VMT
generation”. Transportation Research Part C: Emerging Technologies 90:
156-165. DOI: https://doi.org/10.1016/j.trc.2018.03.005.
21. Zhang W., S. Guhathakurta, J. Fang, G. Zhang.
2015. „Exploring the Impact of Shared
Autonomous Vehicles on Urban Parking Demand: An Agent-based Simulation
Approach”. Sustainable Cities and Society 19: 34-45. DOI: https://doi.org/10.1016/j.scs.2015.07.006.
22.
Zhang W., S. Guhathakurta. 2017. „Parking Spaces in the Age of Shared Autonomous Vehicles”. Transportation
Research Record: Journal of the Transportation Research Board 2651: 80-91. DOI:
https://doi.org/10.3141/2651-09.
Received 15.07.2020; accepted in revised form 29.10.2020
![]()
Scientific
Journal of Silesian University of Technology. Series Transport is licensed
under a Creative Commons Attribution 4.0 International License