Article
citation information:
Makowski, P. Voice on quantitative methods in
risk management by an air operator. Scientific
Journal of Silesian University of Technology. Series Transport. 2020, 109, 103-116. ISSN: 0209-3324. DOI:
https://doi.org/10.20858/sjsutst.2020.109.10.
Piotr MAKOWSKI[1]
VOICE ON QUANTITATIVE
METHODS IN RISK MANAGEMENT BY AN AIR OPERATOR
Summary. This article is devoted
to the diagnosis of problems arising from risk management obligations under the
safety management system implemented in civil organisations of certified air
operators (carriers). Focus was on the use of quantitative methods in safety
risk analysis. The idea of an approach to determine the probability of
accidents and serious incidents based on the intensity of symptoms with lower
consequences and risk factors as a function of time or number of performed air
operations was proposed, based on Markov discrete processes [6,10-12,16]. The
essence of this approach is explained by the mathematical model of Runway
Excursion probability during landing operations. The concept of improvement of
operators' cooperation in the exchange of information about safety indicators
by profiling the organisation was presented. The last proposal concerns the
construction of a comprehensive risk assessment indicator using a safety risk
matrix.
Keywords: discrete processes, quantitative methods, risk
management, safety risk
1. INTRODUCTION
For
organisations providing civil air transport services, the risk associated with
ensuring the safety of air operations is a priority component of operational
risk, as well as affecting market risk (for example, given reputational risk).
The importance of proper safety management, including these risks, has led to
cooperation (among competitors) in this regard and the association of air
carriers within international organisations. The entry into force of the
provisions of Commission Regulation (EU) No. 965/2012 in 2014, laying down
technical requirements and administrative procedures related to air operations
conducted by holders of an Air Operator Certificate (AOC)[2] -
hereafter referred to as air operators (AOs), is part of the European Union
Aviation Safety Agency system (EASA System[3]), which
regulates, inter alia, the functioning of the Safety Management System (SMS) in
the management structure of civil AOs. It is designed to manage safety within
aviation organisations. More so, its implementation required the fulfilment of
organisational requirements for the performance of tasks related to it:
establishing safety policy and its objectives, safety risk management, safety
assurance and safety promotion.
Among the many
difficulties accompanying the process of SMS implementation in AOs management
organisations, the problems related to the development of effective
quantitative methods of safety risk assessment[4] that
meet the individual needs of these entities deserve attention. This problem was
left for AOs to solve. In other words, some forms of risk assessment were
proposed; however, the task of working out their content was entrusted to the
contractors. While it is not so difficult to assess the hazards and safety
status, given the usually extensive experience of safety personnel, predicting
the anticipated safety status in quantitative terms (risk assessment) is a
problem. The random nature of incidents and air crashes with an extremely low
probability of occurrence creates a situation where the assessment of the
testability of individual safety forecasts of a particular carrier is very
limited in practice. Thus, this does not allow for empirical verification of
the author's safety risk analysis and evaluation concepts and may hamper the
creativity of performers. Therefore, the assessment of any new proposals in
this area should be based on scientific achievements or a rational, careful
benchmarking of solutions from other areas of risk management.
This article
aimed to propose opportunities to improve AOs safety risk assessment, based on
quantitative risk analysis methods and subject them to the judgement of those
concerned, within the framework of this publication.
2. LITERARY
SOURCES REVIEW IN TERMS OF PROBLEMATIC SITUATION
The
problematic situation is created by the formal need to meet the recommendations
of the civil aviation authority to individually develop dedicated forms of
safety risk assessment by AOs. In the last edition of the Safety Management
Manual [1], serving as advisory documents of the International Civil Aviation
Organization (ICAO) dedicated to SMS implementations, it is difficult to find,
apart from general guidelines, the methodology of risk assessment, and
especially the proposal regarding methods of risk analysis and evaluation in
quantitative terms. Furthermore, it needs to be stressed that such a
methodology should be adapted to the specificity of AOs; hence, they should be
responsible for its creation. Important problems include choosing the methods
of safety risk analysis and ensuring measurability of data necessary for its
use [9].
The
source literature dedicated to the subject matter in question consists of
official publications of civil aviation authorities and information and
advisory materials. National publications on SMS issues omit aspects of safety
risk quantitative assessment methods; at most, they confirm the existence of
the problem [5]. Rich literature devoted to risk analysis methods allows
knowledge of the essence of many of them, unfortunately without assessing their
usefulness for AOs [6,7,10-12,16]. However, this does not
apply to quantitative-qualitative methods, as such [14].
For example, in the writings of Jacek Skorupski [14], we find descriptions of
several methods based on fuzzy logic, combined with techniques of discrete
(Petri net). These are simulation models and can be used, for example, to study
the effects of exceeding safety standards or their identification (for example,
time and space separations). The ability of AOs to apply this acquis in solving
risk assessment problems is further hampered by the fact that they require
expert data (which is a certain way to overcome the difficulty of accessing
"hard" data). (Name of author needed) of an innovative method
combining elements of statistics and expert assessments allowing for risk
evaluation of a specific flight plan and landing airports considering the
hierarchy of risk factors (the method is under development and evaluation).
Failure Mode Effect Analysis (FMEA), whose adaptation to the needs of aviation
has been announced for years is an example of such a method that has already
gained classic status. Sometimes, referring to expert evaluations is the only
way to achieve the goal, but it entails the need to identify the model with
reality, which is usually a long process and consequently forces it to return
to statistics. The shortage of incident data needed for statistical inference
and forecasting has long been reported by AOs. “The
use of incomplete numerical data, with omission of some unknown part of the
occurred incident data, introduces a latent and unrecognisable error into each
calculation, which will result in incorrect calculations of indices of
particular risks...”. [13, p.11]. These needs were offset by
several years of SMS operation and EASA's efforts to ensure the cooperation of
AOs for safety, which resulted in the definition of events reported in the
Mandatory Occurrence Reporting System (MORS) in civil aviation and their
corresponding indicators describing the state of safety, transmitted to
national databases and recorded in the European Central Repository (ECR). These
incidents are classified under the European Risk Classification Scheme (ECRS).
They include Aircraft Upset, Runway Excursion[5], Runway
Collision, Airborne Collision (list of 11 items), belonging to an identified
Key Risk Area [3]. Polish AOs are required to complete a quarterly spreadsheet,
which is available on the website of the Civil Aviation Authority (ULC),
stating the number of operations and the number of events according to the defined
list. This allows calculating the value of safety performance indicators
(SPIs), being the number of these events per number of operations or flight
hours multiplied by 1E4. SPIs used by AOs may belong to high-level SPIs and
their precursors may be described by low-level SPIs [5]. Moreover, it is worth
noting that events to which low-level SPIs are dedicated are in fact symptoms
allowing identifying safety risk through its component, related to the
occurrence hazard of an incident featured on the list of high-level SPIs.
Whereas
AOs can check in publications, for example, EASA or ULC, how their safety
status is compared to the aggregated results of other organisations
representing a similar type of service in terms of defined high-level SPIs
events, and the four priority factors of these events. These factors, combined
with statistical dependencies and consequences (high-level SPIs) could be
theoretically known as key risk indicators (KRI), however, there are no
publications on the subject. One of many statistics contained in the EASA
publication [3], is presented in Fig. 1, which plots the accidents and serious
incidents related to CAT Airlines, Air Taxi and non-commercial business, by the
key risk area, which the occurrence would potentially lead to safety issue.
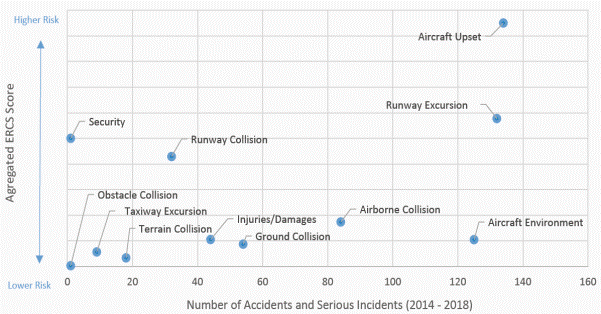
Fig.
1. Distribution of higher risk occurrences by number of events
and aggregated risk score ECRS
Source:
[3, p. 46]
The
risk margin (aggregated ECRS score) (Fig. 1.) is questionable, as there are no
explanations of what it is in the main text of the source material. As a side
note, it should be stated that the ECRS tools: “...
is still in the working tests and evaluation phase.” [15,
p. 7]. According to the definition of the safety risk, its measure should be
the estimated average severity of the consequences, which each AO assesses
according to a subjective scale of assessment. This shows difficulties in
developing methods of safety risk assessment, similarly at the EASA level.
Risk
assessments are ex ante assessments, while these safety assessments are ex post
assessments. They are undoubtedly useful for AOs; however, they do not solve
the problems of safety risk assessment in their organisations, because
aggregate statistics may not reflect the significant determinants of the organisation's
specificity concerning specific Key Risk Areas.
The
experience gained concerning the functioning of SMS resulted in the following
conclusion: “For example, aggregated safety
data may be valid to define SPIs related to airspace management. De-aggregation
may be necessary to address specific operational issues at particular
facilities (that is, ACAS/TCAS alerts), or related to different service
providers (that is, airline or ATS provider)” [1, p.
74].
In
turn, it is useful to refer briefly to the current form of risk assessment
proposed in the latest edition of the manual [1]. The definition of risk itself
is questionable: safety risk is defined as “The
predicted probability and severity of the consequences or outcomes of a hazard”
[1]. In this context, the risk is a specific indicator (a measure of hazard).
What should then be thought of other risk indicators? Thus, the following
problem arises: is a risk, as an ontic object, a feature of a situation that is
a fragment of reality, or is it a designator of the world of symbols as seen by
Popper[6]?
The consequence of this definition is the adoption, as a form of assessment, of
the risk matrix, here, with a three-stage scale of assessments: risk
intolerable for an index of risk:{5A, 5B, 5C, 4A, 4B}; risk tolerable for an
index of risk: {5D, 5E, 4C, 4D, 4E, 3B, 3C, 3D, 2A, 2B, 2C, 1A}; risk
acceptable - for other indexes of risk (Fig. 2).
|
Risk probability |
Risk severity |
|||||
|
Catastrophic A |
Hazardous B |
Major C |
Minor D |
Negligible E |
||
|
Frequent |
5 |
5A |
5B |
5C |
5D |
5E |
|
Occasional |
4 |
4A |
4B |
4C |
4D |
4E |
|
Remote |
3 |
3A |
3B |
3C |
3D |
3E |
|
Improbable |
2 |
2A |
2B |
2C |
2D |
2E |
|
Extremely improbable |
1 |
1A |
1B |
1C |
1D |
1E |
Fig.
2. Example of a safety risk matrix
Source:
[1, chapter 2, p. 16]
The
matrix dimension, which is a probability, was divided into 5 class ranges
(similarly to risk severity), whose indices were described by frequency
adjectives. No limits of these ranges were defined in terms of frequency units
or probability values. More so, the assessment horizon was not defined. In the
EU civil aviation, it was assumed that the probability of an aircraft crash is
assessed as improbable for event frequencies 1E-8 per hour flight [4, p. 8].
However, the content of the handbook does not state who owns the safety risk.
Does its assessment concern a specific air operation or all operations carried
out by AOs? It is easy to see that for a risk with a given probability index,
expressed as a measure of frequency, the actual severity (and its index) will
increase with the duration of AO's operations, as the actual and average number
of effects of the materialisation of risk will potentially increase.
The
matrix makes it difficult to assess hazards with a different distribution of
severity than the dichotomous one, and in the case of many hazards, it requires
solving the problem of a comprehensive assessment. In the proposed method of
comprehensive assessment based on FMEA, we are dealing with adding point
representations of risk indices of various hazards and factors to assess the
total risk, which contradicts the laws of mathematics for conducting
probability calculations.
To
monitor the state of security and formulate objectives in this respect, AOs are
recommended to draw up monthly lists of security indicators in the form of
charts[7]
[2]. For forecasting SPIs, it is recommended to use the method of, for
example, time series with moving average.
Conclusively,
it can be stated that one of the most important problems of safety risk
analysis within SMS is currently the determination of probability value in the
existing, available AOs, information environment and the lack of dedicated,
quantitative methods of its determination for safety risk assessment.
3.
METHODOLOGY AND THEORETICAL BASIS
Formulating
the diagnostic evaluations presented above, the source literature was
researched, the most important items of which were listed in and the results of
pilot studies carried out using the diagnostic survey method with the use of
expert interview technique. Selected employees of airlines, including Safety
Manager Small Planet Airlines (Poland)
Sp. z o.o. and Ground Operations Quality & Compliance Manager at Luxair
Airline[8], gave
interviews on problems of risk assessment in civil aviation organisations.
The
theoretical assumptions of the proposed method (later described in this
article), limited to the example of calculating the probability of occurrence
category from the high-level SPIs list based on the intensity of events from
the low-level SPIs list, were taken from Markov's process theory, described to
a sufficient extent in the literary references: [6,10-12,17] especially in the
aspect of the application of Kolmogorov stochastic differential equations for
homogeneous Markov processes, for which all intensities are finite and
stationary. The use of Laplace transformation to solve the proposed types of
differential equation systems with stationary coefficients was described in the
reference [8,11].
The
identification of an exemplary mathematical model, for obvious reasons, cannot
be experimental, as its validity results directly from accepting the results of
assumptions identification, the most important of which concerns the condition
that the probability of transition to the next state does not depend on
history. Replacement of a continuous variable (customary time) by a discrete
variable (number of air operations) is a known procedure (for example, from
analogous applications of normal distribution); however, it causes inaccuracies
in conclusions with small numbers of operations. The accuracy of the model
depends mainly on the reliability and accuracy of the input data.
The
remaining proposals for improving AOs risk management process, presented below,
were the result of the heuristic process and do not require further
explanation.
4.
RESULTS AND DISCUSSION ABOUT PROPOSED SOLUTIONS
4.1. Proposed
approach to determine the probability of accidents and serious incidents -
example of a probability estimation model of Runway Excursion
The
use of stochastic process theory or more precisely discrete processes to
determine the value of probabilities of aviation events with high consequences
(according to the ECRS classification belonging to the Key Risk Area), is an
idea resulting from the fact that in civil aviation organisations, safety
indicators of intensity (SPIs) are used.
Let
us consider an example of an incident from the Key Risk Area list. Risk
factors, particularly safety issues for this incident are also defined in ECRS,
in aggregated groups, only some of which fall under the responsibility of AO
(Tab. 1). Based on the flight’s register records analysis, AO is can
measure the number of premature/late touchdowns, which usually have no adverse
consequences (but can turn into Runway Excursion). They indicate a reduced
quality of procedure execution (low-level SPI incident). Furthermore, it can be
observed that the gross causes of both events are identical. The differences
concern technical problems or braking after touchdown (Table 1, rows 5 and 7).
AO can determine, within an assumed assessment horizon, the intensity of these
events, measured by the number of occurrences to the number of landing
operations of a given aircraft type at aerodromes equipped with a given
category of instrumental landing system.
Tab. 1.
List
of safety issues with an assessment of their impact for Runway Excursion
|
Safety
issues for Runway Excursion* Bands
of aggregated ECRS Risk Score |
AO
responsibility** |
Safety
issues for Premature/late touchdown** |
|
1 |
2 |
3 |
|
1.
Monitoring of flight parameters
and automation modes |
x |
x |
|
2.
Convective weather |
x |
x |
|
3.
Ice in flight |
x |
x |
|
4.
State of well-being and fight
for duties |
x |
x |
|
5.
Handing of technical failure |
x |
- |
|
6.
Crew Resource Management |
x |
x |
|
7.
Aircraft braking and steering |
x |
- |
|
8.
Flight planning and preparation |
x |
x |
|
9.
Inappropriate flight control
inputs |
x |
x |
|
10. Runway
surface condition |
- |
- |
|
11. Experience,
training and competence of Flight Crew |
x |
x |
|
12. Entry
of aircraft performance data |
x |
x |
|
13. Alignment
with wrong runway |
x |
x |
|
14. Bird/wildlife
strikes |
- |
- |
|
15. Ice
on ground |
- |
- |
|
16. Aircraft
maintenance |
x |
x |
|
17. Windshear |
- |
x |
|
18. Transport
and carriage of lithium batteries |
x |
x |
|
19. Baggage
and cargo loading |
x |
x |
|
20. Fatigue |
x |
x |
|
21. False
or disrupted ILS signal capture |
x/- |
x |
|
22. Handling
and execution of go-around |
x/- |
x |
* Column 1 quotes terms from [3, Table 7. Large
aeroplane safety risk portfolio, p. 48, 49]
** the characters: "x” - means yes,
"-" -I mean no.
Source: Author’s study based on [3]
Let us consider the graph of
selected states when landing a given type of aircraft (fig. 3).
State "1" vertex shall be the
agreed state of deciding on landing, "2" vertex is a premature
or late touchdown incident state, "3" vertex is the state of
the Runway Excursion event, "4" vertex is the good touchdown
incident. The criteria of Markov's discrete processes concern processes for
which the probabilities of transition to particular states from t1 to t2 moment
are dependent on the difference (t2 - t1) and do not
depend on history. In the model under consideration, it is assumed that the
time variable will be "mimicked" by the number of operations – n because we are interested in
the results solely for discrete values. Each number of air operations will
correspond to a specific probability of events for the vertices of the graph:
"1", "2", "3", "4"
regardless of what happened before.
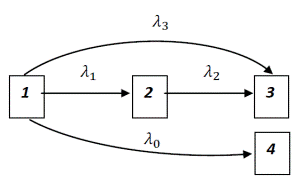
Fig.
3. The graph of selected aircraft states during landing
Source:
Author’s study
Number of good touchdowns
– events of k0 type:
"1"→"4", is the information available
and, when referred to the total number of operations - N, it allows determining
the intensity λ0 of
these events.
Number of events of k1 type: "1"→"2”
per N determines λ1 intensity
of these events and can be determined as a result of analysis of flight
parameter recorders (it aggregates information about their causes –
marked with "x" in column 3 of Tab. 1).
Number of events of k3 type: "1"→"3"
per N determines λ3
intensity of these events. Their causes are under the responsibility of the
aerodrome administrators or the causes of technical failures after the
touchdown (this aggregates information about their causes marked with
"-" symbol in column 2 of Tab. 1, except the items from row 17[9]), which
are the direct cause of the Runway Excursion incident.
Incident of k2 type: "2"→"3"
refers to a situation where a premature or late touchdown is transformed into a
Runway Excursion incident. The number of k2 events per N determines
the λ2 intensity of
these events. It can be determined from statistics relevant to the conditions
of landing operations considered in a given model, excluding events caused by
reasons of k3 type events.
Since the model is to be of a forecast nature,
the mentioned intensities should be predicted as stationary means in a given
time horizon, for example, by time series method, in general not only by AO
data. Additionally, it should be stressed that the levels of SPIs in civil
aviation are relatively constant, with slight downward trends [3].
For a graph in Fig. 3, the
following arrangement of Kolmogorov's differential equations can be arranged in
light of the aforementioned assumptions:
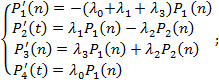 (1)
(1)
where:
P1(n) – probability of state “1” 1
continuing; P2(n) – probability of transitioning from
state „1” to state “2” P3(n)
– probability of state “3”; P4(n)
– probability of state „4”.
From the
physical side of the issue, it follows that:
![]() (2)
(2)
Considering the dependency
(2) results in the loss of the possibility of tracking the logic of physical
units in the transformations, but does not affect the final result, as from now
on all variables will be treated as dimensionless.
For the model under consideration, the following
initial conditions can be assumed for n=0: P1(0)=1
and P2(0)=P3(0)=P4(0)=0. By transforming Laplace's differential equations system (1) and
taking into account the initial conditions and equation (2), the following
algebraic system of equations was obtained:
 (3)
(3)
where: s – Laplace's
operator.
For example, Laplace's transformation was obtained
concerning the said probability of Runway Excursion:
![]() (4)
(4)
By performing a reverse transformation of Laplace's
dependency (4), the original was obtained:
![]() (5)
(5)
Dependency (5) allows assessing the risk of Runway Excursion (for
dimensionless input) for a single aircraft to n operations or for n operations
of the aircraft type used by the AO at any time within the assessment horizon.
Due to the nature of the variable n, the lower limit of the model
utility range was estimated[10] for n=20, which is sufficient in practice, considering the
volume of air operations of an average AO. This
allows simplifying the relation (5) to the form:
![]() (6)
(6)
The assessment horizon of P3(n)
depends on the input forecast horizon and the condition: n<20/λ2
should be met, which in practice usually means over 1E4 operations. In
practice, the relationships occur: λ1>> λ2 and λ3. Fig. 4. shows an example of the P3 (n) function.
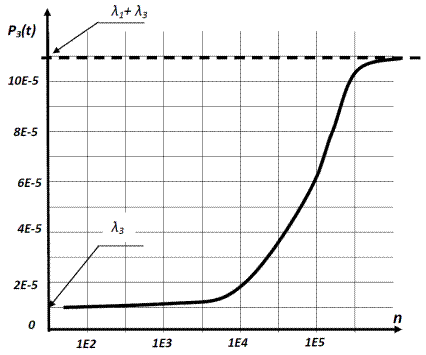
Fig. 4. Example of a graph for P3(n) dla: λ1=1E-4; λ2= λ3=1E-5
Source: Author’s study
The use of flight recorders for λ1
identification by AOs allows to aggregate autogenous risk factors. Thus, the
model reflects the reality of a given AO better than if the averaged data of
other AOs were used. In contrast, for λ2 and λ3
identification, it seems necessary to use the data resources of other AOs.
Hence, in this case, there is a need for data exchange between AOs, users of a
given type of aircraft with technical failures, bird/wildlife strikes and
runway surface condition safety issues from users of the same aerodromes as a specific
AO. Empirical data can be supplemented with the results of training on flight
simulators.
4.2.
Postulates regarding the data repository
Each of the ECRS classified events belonging to the
Key Risk Area requires separate profiling of
the data sources for its model for probability calculation. In the proposed
modelling approach, the relevant profiling criteria for these sources will be
the selected intensities of risk symptom (or SPIs), and possibly of risk
factors. A complete list of criteria can be identified after developing the final
form of the remaining models.
The proposed intensities (as criterions) have the
advantage that the differences in the size of the AO organisation are no longer
relevant.
Thus, it is proposed that the search for AOs with
similar risk profiles should be carried out in a variable, standardised[11]
criterion space for the required intensities, adequate to the current needs of
the model. For example, using Euclidean or urban metrics.
It seems obvious that the civil aviation authority of
AO’s country or EASA should administer the data repository of this data. This would facilitate the continuing
operational oversight of AOs by the Aviation Authority and ensuring data
confidentiality.
4.3.
Comprehensive risk assessment using
a risk matrix
The idea of using a risk matrix (Fig. 2) to illustrate
the situation in AO’s organisation consists in presenting assessments of
the most significant aviation events and incidents in terms of probability and
severity in the relevant cells of the matrix after assigning them with
probability and severity indices. Using this matrix for the assessment of a
serious accident appears to be pointless as it is not acceptable to assign this
type of incident with a risk index other than {1, A}. Identified causes of
such an incident shall be neutralised and AO shall suspend operations until
they are removed. Moreover, the incident is accompanied by fatalities, which
makes it practically impossible to compare the {A} index with other indices on
a quotient scale. However, there is a need to evaluate other aviation events (for example, from
the Key Risk Area list). Their number makes it difficult to comprehensively
assess and compare the risk profiles of different organisations. It should be
noted that these are independent incidents in terms of probability.
The condition for the usefulness of the proposals formulated
below is AO's estimation of severity accumulation rights, that is, mutual
relations between its indices: {B, C, D, E}. This can be done, for example, by
expressing severity in the form of forecasted losses measured in the quotient
scale using, for example, means of payment. This will allow defining the limits
of class ranges of indices {B, C, D, E}.
To express the risk profile of AO based on this risk
matrix by means of a comprehensive risk index - IRk,
with the indices of probability (IPk) and severity (ISk),
aggregating the m of the discussed events described by IRi
indices, where i falls within the range: <1, m>, the
following procedure is proposed:
1. For each IRi and given probability
index (IPi), if the value of the mathematical probability pi
can, if it is not known, be determined as the average value of the class
limits of a given IPi;
2. The value of the probability pk
needed to determine the IPk is proposed to be calculated from
the relationship:
![]() (7)
(7)
In practice, knowing that for the
probabilities of two independent events the following occurs:
![]() (8)
(8)
pk can be calculated using the
relation (8) in a simple recursive procedure (having the sum of the first two
components we treat it as a new component of the calculated relation (7)
aggregating the first two. The procedure is repeated until the result is obtained.
It is easy to see that for
real, very small pi from the range (1E-7, 1E-3), for
practical purposes, dependence (7) can be simplified to the following form:
![]() (9)
(9)
3. Based on pk we determine the IPk;
4. For each IRi and a given severity
index (ISi), determine the real losses of li, and if not known, determine
the value of li as the average value of the limits of the
class range of a given ISi;
5. The value of ISk should be formally
calculated based on the average value of the distribution of real losses lk
(considering the possible accumulation of air events). Considering that for
very small pi the value of ISk can be
estimated on the basis of a simplified relationship:
![]() (10)
(10)
6. Based on lk we determine ISk
;
7. We
determine IRk based on: IPk and ISk , which ends the procedure (Fig. 2).
5. CONCLUSION
The use of intensity indicators in safety assessments
provoked the search for solutions based on stochastic process theories. An
attempt to develop an exemplary model for calculating the probability of a
selected aviation incident from the ECRS Key Risk Area list, due to its
relative simplicity, makes the search direction more credible. The advantage of
the model is the possibility of aggregating data on many risk factors that are
difficult to observe by data obtained from the analysis of flight recorders. It
equally allows precise determining of the time horizon of risk assessment for
the form of the recommended matrix. The model can also be used as a factoring
tool to determine the directions of corrective actions. The construction of
subsequent models will allow defining precise needs concerning access to
statistical data by air operators, which will give shape to the outlined
concepts of improving selection and access to statistical data. They should be
more focused on the needs of air operators, by increasing the degree of
disaggregation of the statistics provided and allow searching for
"neighbours" in a variable set of criteria through profiling. These
are the general demands for building the data repository needed to provide the
data identified during the conceptualisation of the model described.
The postulated comprehensive assessment indicator for
a form of risk matrix can be an alternative to the popular FMEA method. Hence,
it seems logical, because of the separation of mathematical operations on probabilities
and losses. Whereas, the postulate of subjectivisation of loss counting by the
operator is the essence of risk subjectivity.
If the content of this article finds interest among
the aviation community, then it will be a source of satisfaction for the
author.
References
1.
Doc 9859 - BAZL. „Doc 9859 Safety Management
Manual four edition”. ICAO. 2018. ISBN: 978-92-9258-552-5.
Available at:
https://www.bazl.admin.ch+›+icao-doc-9859-safetymanagementmanualsmm&sourceid.pdf.
2.
Dziennik urzędowy - Urzędu Lotnictwa
Cywilnego. „Załącznik do Wytycznych nr 11 Prezesa Urzędu
Lotnictwa Cywilnego z dnia 24 listopada 2015 r. w sprawie wprowadzenia do
stosowania wymagań ustanowionych przez Organizację
Międzynarodowego Lotnictwa Cywilnego (ICAO) – Doc 9859, Podręcznik zarządzania
bezpieczeństwem (SMS)”. [In Polish: Appendix to
Guidelines No. 11 of the President of the Civil Aviation Authority of 24
November 2015 on the implementation of the requirements established by the
International Civil Aviation Organization (ICAO) - Doc 9859, Safety Management System (SMS), Official
Journal of the Civil Aviation Authority of 2015, item 64]. Available at:
https://www:edziennik.ulc.gov.pl›api›DU_ULC›2015›akt.
3.
EASA-Europa EU. „Annual Safety Review
2019”. Available at:
https://www.easa.europa.eu/document-library/general-publications/annual-safety-review-2019.pdf.
4.
European Organisation for the Safety of Air Navigation
- SKYbrary. „Enclosure 2: Supporting material for the establishment of a
risk classification scheme for the design of the air traffic management (ATM)
functional system”. Available at:
https://skybrary.aero/bookshelf/books/474.pdf.
5.
Galej Piotr. 2016. Zarządzanie
bezpieczeństwem przez operatora lotniczego [In Polish: Safety Management
by the Air Operator]. Zarządzanie
bezpieczeństwem w lotnictwie cywilnym [In Polish: Civil Aviation Safety Management]. Edited by Łuczak Katarzyna:
169-185. Katowice: Silesian
University in Katowice. ISBN: 978-83-63503-74-1.
6.
Gihman Iosif, Anatoli V. Skorochod. 1968. Wstęp do teorii procesów
stochastycznych. [In Polish: Introduction
to the theory of stochastic processes]. Warsaw: PWN.
7.
Higgoda Ruwan, Wasanthi Madurapperuma. 2020.
“Air passenger movements and economic growth in Sri Lanka: Co-integration
and causality analysis”. Journal of
Transport and Supply Chain Management 14: a508. DOI:
https://doi.org/10.4102/jtscm.v14i0.508.
8.
Kaczorek Tadeusz, Andrzej Dzieliński,
Włodzimierz Dąbrowski, Rafał Łopatka. 2016. Podstawy teorii sterowania. [In Polish: Basics of control theory]. Warsaw: PWN. ISBN: 9788301185916.
9.
Medic D., Z. Lusic, R. Bosnjak. 2019. “Comparative
Analysis of the Maritime Venture Risk and the Cost of Averting a Fatality in
the Republic of Croatia”. Nase More 66(2): 62-69. ISSN: 0469-6255. DOI: 10.17818/NM/2019/2.3.
10. Modarres Mohammad,
Mark P. Kaminskiy, Vasiliy Kristosov. 2017. Reliabyty
engineering and risk analisys. Great Britain: TJ International Ltd,
Conrwall. ISBN: 9781498745871.
11. Plucińska Agnieszka, Edmund Pluciński. 2004. Probabilistyka. Procesy stochastyczne,
statystyka matematyczna, rachunek prawdopodobieństwa. [In Polish: Probabilistics. Stochastic processes,
mathematical statistics, calculus probabilities]. Warsaw: WNT. ISBN:
978-83-7926-287-8.
12. Procesy stoch-2005 -
Scribd. „Procesy stochastyczne wybrane zagadnienia” [In Polish:
“Stochastic processes selected issues”]. Available at:
https://www.scribd.com/document/52170391/procesy-stoch-2005.
13. Publikacje Polski Klub lotniczy. 2015. „Analiza
procesów wdrażania systemu zarządzania bezpieczeństwem w
lotnictwie cywilnym w Rzeczpospolitej Polskiej. Raport Polskiego Klubu
Lotniczego”. [In Polish: Polish Aviation Club. 2015. “Analysis of
the Implementation Processes of the Civil Aviation Safety Management
System in the Republic of Poland. Report of the Polish Aviation Club”].
Available at: http://pkl.org.pl/publikacje-3.
14. Skorupski Jacek. 2018. Ilościowe metody analizy incydentów w ruchu lotniczym. [In Polish: Quantitative Methods of Air Traffic
Incidents Analysis]. Warsaw: Warsaw University of Technology Publishing
House. ISBN: 978-83-7814-759-6.
15. ULC gov.pl. 2019. „Sprawozdanie o stanie
bezpieczeństwa lotnictwa cywilnego za rok 2018”. [In Polish: “Report on the State
of Civil Aviation Safety for 2018”]. Available at:
https://www.ulc.gov.pl/pl/zarzadzanie-bezpieczenstwem/analizy-bezpieczenstwa.
16. Vermooten Joachim.
2020. “Closure and restart as an option for a sustainable South African
national airline”. Journal of
Transport and Supply Chain Management 14: a477. DOI:
https://doi.org/10.4102/jtscm.v14i0.477.
17. Wentzell Alexander D. 1980. Wykłady z teorii procesów stochastycznych. [In Polish: Lectures in Stochastic Process Theory]. Warsaw: PWN. ISBN:
83-0100748-6.
Received 10.07.2020; accepted in revised form 02.11.2020
![]()
Scientific
Journal of Silesian University of Technology. Series Transport is licensed
under a Creative Commons Attribution 4.0 International License