Article
citation information:
Jilek, P., Vrábel, L. Change of driver’s
response time depending on light source and brake light technology used. Scientific Journal of Silesian University of
Technology. Series Transport. 2020, 109,
45-53. ISSN: 0209-3324. DOI: https://doi.org/10.20858/sjsutst.2020.109.4.
Petr
JILEK[1], Luboš VRÁBEL[2]
CHANGE
OF DRIVER’S RESPONSE TIME DEPENDING ON LIGHT SOURCE AND BRAKE LIGHT
TECHNOLOGY USED
Summary. This paper deals with
finding out the influence of the type of light source of car brake lights on
the reaction time of the driver of the preceding vehicle. The driver’s
reaction time was measured in the form of pressing the brake pedal depending on
the lighting of brake lights on the leading vehicle. The measurement evaluation
consists of a comparison of the phase shift between the brake light signal of
the first vehicle and the brake light signal of the second vehicle. The experimental
measurement was performed for five people using the classic light bulb,
afterwards, an LED light source for the brake lights of the first vehicle. The
records confirmed that the driver’s reaction time depends on many
factors, with the source and intensity of the brake lights also playing an
important role. Further, it affects the reaction time and the activity or
inactivity of the rear sidelights. The reaction time of the driver of the
preceding vehicle was extended with their activation.
Keywords: reaction time, car, brake light, safety
1. INTRODUCTION
New
materials and construction methods are constantly appearing in automotive
technology. Therefore, their influence on the behaviour of drivers of the
surrounding vehicles should be considered. This influence needs to be
considered in a broader sense, concerning the happenings in the vehicle and
around the vehicle. An important element of active road vehicle safety is
lighting. The driver should be able to see and orientate himself/herself in
this way in road traffic. However, been seen is an equally important aspect. It
is especially true in areas where there is an emergency, such as a change of
direction or a speed reduction. Thus, the visibility of turn indicators and
brake lights is an important aspect. A large part of all accidents is caused by
failure to maintain a safe distance, when the driver is not able to react in
time and correctly to the situation in road traffic. From the point of view of
road safety, it is necessary to focus on measures to ensure that a safe
distance is maintained and that the driver’s reaction time is shortened [5,6,8,9,11-14,17].
The
shape of the headlights and taillights is a powerful tool in today’s
vehicles when dealing with vehicle designs. With new lighting technologies,
taillights are no longer simple in design but complex with 3D shapes.
Therefore, the brake lights can be part of the taillights and still fulfil
their functions.
2. MATERIALS AND METHODS
The
driver’s reaction time is determined by his/her physiological nature as a
living organism. Therefore, it cannot be infinitely short. Its length is
determined by moral integrity and the current psychological disposition;
possibly by any narcotic and addictive substances in the human body [9,12,15].
The reaction time can be considered as the time required for the driver’s
biological system to respond to a stimulus in the driver’s field of
vision, even in cases where the stimulus is sudden and unexpected.
The
optical response is given by the moment of perceiving an object that is outside
the driver’s field of vision. Visual perception is essential when
driving. The driver obtains about 90% of all information through it. The
optical response time ranges from 0 to 0.7 seconds and depends on the magnitude
of the angular deviation of the stimulus from the driver’s line of sight
[3,16].
Mental
response is defined as the time interval required by the driver to recognise
and evaluate the stimulus. This is a variable time depending on the complexity
of the situation, the ingestion of addictives and psychotropic substances and
fatigue. Moreover, the reaction is greatly affected positively by experience
and expecting a possible situation. A situation with more than one
solution has a negative effect. Here, the driver evaluates the situation and
decides what action to take according to the stimuli received. The mental
reaction duration is 0.2-0.6 seconds [4,12,22].
Muscular
response is similarly determined by the biological nature of the human body and
is the body’s response to a detected stimulus. It is significantly
affected by training and movement trajectory. It is the time interval wherein
the driver between the end of the mental reaction until the moment, in our
case, when the driver touches the brake pedal. The muscle reaction interval is
approximately 0.2 seconds [4,12].
The division
of the reaction time between the car and the driver can be realised according
to many aspects, which are elaborated in more detail in [2,10,18]. From the
viewpoint of road safety, great attention should be paid to the driver’s
reaction time. Any increase in reaction time is undesirable and increases the
overall distance required to stop the car safely; this is the reason assistance
systems are used. Assistance systems in the form of adaptive cruise control
(ACC), night vision systems [4], and panic braking systems [3,18] are becoming
increasingly popular in modern vehicles as elements reducing driver’s
reaction time.
2.1. Experimental measurements
We performed experimental measurements on stationary vehicles
to minimise the influence of disturbing environmental stimuli. These were
located in the covered premises of the laboratories of the Educational and
Research Centre in Transport of the University of Pardubice. The leading
vehicle was visible from the other vehicle. The illumination of the measurement
point was constant. The current conditions from the implementation of
the experiment are evident in Fig. 1. The Škoda Rapid and Škoda
Superb were selected for the experiment. The Škoda Rapid was the leading
vehicle that initiated the reaction stimulus.
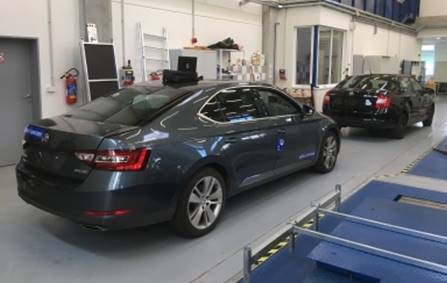
Fig. 1. Experimental measurements
2.2. Measured data records
Brake
signal BS - the leading edge is the
carrier of information about the beginning of braking in the test subject. This
is a rectangular signal, which with its falling edge defines the end of the
process of acting on the brake pedal by the test subject.
Optical
signal OS - is defined by the
beginning of the action on the brake pedal in the leading vehicle. The leading
vehicle is a car to which the test subject in the other vehicle responds to
when its brake lights come on.
Driver’s
reaction time DRT - it was calculated
from the mutual phase shift between the measured signals according to Equation
(1) from the measured brake and optical signal. Each signal corresponds to a
specific time interval.
![]() (1)
(1)
When the
leading vehicle’s brake pedal is pressed, the brake light is activated.
This is a simple optical stimulus for the test subject. Measuring control panel
(Fig. 2) (detailed specifications are given in [7,10] records the optical
signal OS of the leading vehicle by a
step change of the input parameter. When the brake pedal is pressed in the
other vehicle, the brake light of the vehicle with the test subject is
activated and the measuring relay is open at the same time. The measuring
control panel records the step change in the input parameter. Thus, the brake
signal BS of the vehicle with the
test subject is obtained.
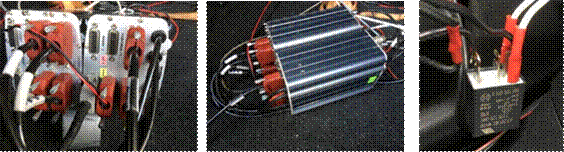
Fig. 2. Arrangement of the measuring system
Possible
logic levels of the evaluated signals are schematically shown in Fig. 3.
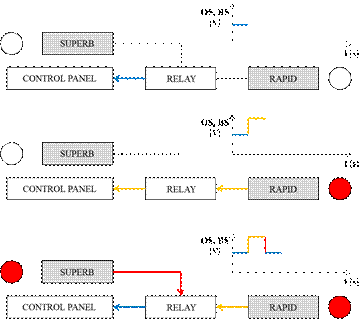
Fig. 3. Logic of measured signals
We chose
the original P 21/4 W bulb as the first luminous flux source. An LED source was
used as an alternative. It was without the necessary homologation for operation
on roads [1,21].
We
determined the interval of full light of the light source with the help of
video recording. These are ten measurements for a conventional light source and
then the same number of measurements for an LED. We evaluated the required rise
of the luminous flux by phasing the record [15,19,20]. The last frame for the
beginning of the lighting where the luminous flux is zero was selected. We
chose a frame where there was not an increase in the intensity of the luminous
flux in the following vehicle as the full light of the light source. It is
clear from the measurement results that the LED light source reaches full light
in 0.033 s and the conventional light bulb in 0.2 s, as shown in Fig. 4.
On a theoretical level, the driver’s reaction time when using an LED
light source should be 0.166 s shorter than when using a conventional
light bulb.
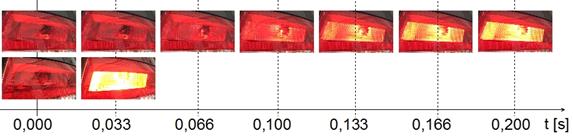
Fig. 4. Increase in luminous flux,
conventional light bulb / LED
2.3 Conditions for the experiment
implementation
The
reaction time was measured in the laboratory under artificial lighting. Four
men and one woman participated in the experimental measurement. The subjects
were in the age range of 27-44 years. The leading vehicle was in front of the
second vehicle with the test subject at a distance of 2.5 metres. The system of
rear brake lights of the leading vehicle was chosen as the optical stimulus. A
central brake lamp with an LED source of luminous flux would adversely affect
the nature of the measurement. Therefore, it was deactivated in the leading
vehicle. The leading vehicle turned on the brake lights at random intervals for
a set period. This created reaction stimuli for the test subject in the second
vehicle. The task of the test subjects was to press and hold the accelerator
pedal in the maximum position. This eliminated the readiness of the right
foot on the brake pedal. The test subject had to press the brake pedal
immediately noticing the random lighting of the driving vehicle’s brake
lights.
We experimented
with two options. The difference is that the rear sidelights were switched on
in the second case compared to the first set of measurements. Thus, the test
stimulus was less contrasting than with the sidelights off.
3. RESULTS AND DISCUSSION
To
determine the reaction time in the test subjects, we used a median![]() calculated according to Equation 2.
calculated according to Equation 2.
![]() (2)
(2)
where:
![]() –
number of
all values,
–
number of
all values,
![]() – the first value with an
index determining the position in an increasing sequence of values,
– the first value with an
index determining the position in an increasing sequence of values,
![]() – the second value with an index determining the
position in an increasing sequence of values.
– the second value with an index determining the
position in an increasing sequence of values.
The
resulting reaction time for the group of test subjects is given in Table 1.
Table. 1
Reaction time of a group of test subjects
|
Reaction time [s] |
Light source - bulb |
Light source - LED |
Difference |
|
Rear sidelights off |
0.592 |
0.560 |
0.032 |
|
Rear sidelights on |
0.608 |
0.572 |
0.036 |
A
graphical representation of the measurement results is shown in Fig. 5, 6 and 7.

Fig. 5. Partial results
for the sidelights off
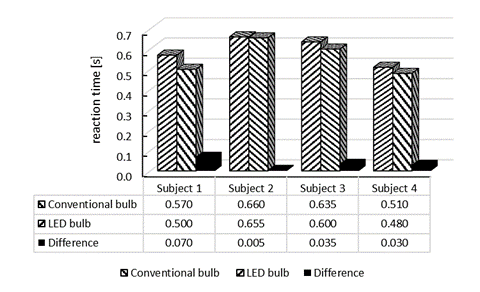
Fig. 6. Partial results
for the sidelights on
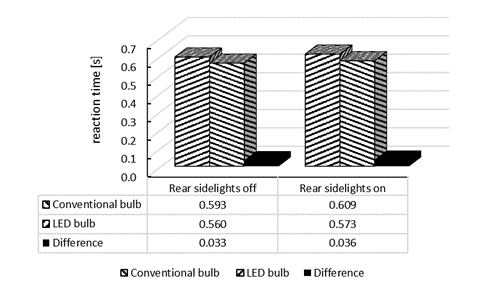
Fig. 7. Total results
The
largest reduction in reaction time in an individual was 0.07 s, which
corresponds to 42.2% of the expected reduction in driver’s response time.
The average reduction in the reaction time of the group was 0.03 s, which
corresponds to 20.7% of the expected reduction in the driver’s reaction
time. Based on the results of the experimental measurements, it can be assumed
that the human eye responds to the conventional light bulb during its turning
on, and not only to its full light. The experiment results did not show that
the reaction time would be shortened by the expected 0.17 seconds in the case
of replacing a conventional light bulb with an LED light bulb.
It is
evident from the measured results that the driver driving behind the vehicle
with an LED light source installed will start braking at a speed of 130 km.h-1
1.24 m earlier on average than when using a conventional light source. The braking
distance will be shortened by up to 2.5 metres in the case of the measured
maximum in a person. There is a presumption that the use of a homologated
source, which has a higher luminous flux than the non-homologated LED source
used by us, will further shorten the driver’s reaction time.
4. CONCLUSION
It is
evident from the experimental measurements that the change in the reaction time
occurred when using an LED light source. The length of the reaction time was
also affected by the rear sidelights being on or off. When the brake lights are
switched on while the sidelights are on at the same time, the trigger impulse
is less contrasting, causing the reaction time to be extended. When using an
LED light source, the reaction time was shortened compared to a conventional
light source. Since the tested driver expected a test stimulus in the form of
switching on the brake lights of the leading vehicle in the moment, the
reaction time of the driver’s mental reaction is reduced to a minimum.
Because the same testing conditions were for all experimental measurements and
the results are processed on a relative level and not an absolute one, this
simplification does not invalidate the experimental results.
To
express an exact conclusion based on the experiment results, it is necessary to
perform experimental measurements on a representative and statistically
significant sample of drivers and in various ambient conditions, or in an
experimental dynamic (driving) test. Subsequently, this is a subject for
further research for the authors.
References
1. Balal Nezah, Yael Balal, Yair Richter, Yosef
Pinhasi. 2020. „Detection of Low RCS Supersonic Flying Targets with a
High-Resolution MMW Radar”. Sensors 20(11): 3284. DOI:
https://doi.org/10.3390/s20113284.
2. Borecký
Petr. 2018. Reakční čas řidičů. [In
Czech: Drivers' reaction time].
Thesis. Praha: České vysoké učení
technické.
3. Bradáč A.
1997. Soudní inženýrství. [In Czech: Forensic engineering]. Brno:
Akademické nakladatelství CERM.
4. Cyganek Boguslaw,
Slawomir Gruszczynski. 2014.
„Hybrid computer vision system for drivers' eye
recognition and fatigue monitoring”. Neurocomputing
126: 78-94.
5. Czech Piotr. 2017.
„Physically disabled pedestrians - road users in terms of road
accidents”. Lecture Notes in
Networks and Systems 2: 157-165. DOI: 10.1007/978-3-319-43985-3_14. In:
Edited by: Macioszek E., Sierpinski G. Contemporary
challenges of transport systems and traffic engineering. 13th Scientific
and Technical Conference on Transport Systems. Theory and Practice (TSTP).
Katowice, SEP 19-21, 2016.
6. Dabbour Essam, Abdallah Badran. 2020.
„Understanding how drivers are injured in rear-end collisions“. European Transport \ Trasporti Europei
77 n. 1. ISSN: 1825-3997.
7. Devault L.
Travis, W. Thomas Seamans, F.Bradley Blackwell. 2020. „Frontal vehicle
illumination via rear-facing lighting reduces potential for collisions with
white-tailed deer“. Ecosphere
11(7) e03187. DOI: https://doi.org/10.1002/ecs2.3187.
8. Distefano Natalia, Salvatore Leonardi, Giulia
Pulvirenti, Richard Romano, Natasha Merat, Erwin Boer, Ellie Woolridge. 2020.
„Physiological and driving behaviour changes associated to different road
intersections“. European Transport
\ Trasporti Europei 77 n. 4. ISSN: 1825-3997.
9. Etinge Ariel,
Nezah Balal, Boris Litvak, t MosheEina, Boris Kapilevich, Yosef Pinhasi. 2014.
„Non-Imaging MM-Wave FMCW Sensor for Pedestrian Detection”. IEEE Sensors Journal 14(4): 1232-1237.
DOI: https://doi.org/10.1109/JSEN.2013.2293534.
10. Jilek Petr. 2018. Vývoj systému pro ověřování
jízdní stability silničního vozidla ve vztahu
k adhezním podmínkám. [In Czech: Development
of a system for verifying the driving stability of a road vehicle in
relation to adhesion conditions]. Dissertation. Pardubice: Univerzita
Pardubice.
11. Jurecki Rafal S. 2020. „Analysis of Road
Safety in Poland after Accession to the European Union“. Communications – Scientific Letters of
the University of Zilina (Komunikacie) 22(2): 60-67. ISSN: 1335-4205.
12. Kleprlík
Jaroslav. 2020. „Opatření pro zajištění
účinného a správného brzdění
silničních vozidel“. Perner’s Contacts 11(1): 68-81.
13. Montalva Sonia, Carlos Muñoz Juan,
Ricardo Paredes. 2010. „Assignment of work shifts to public transit
drivers based on stated preferences“. Public
Transport 2:
199-218.
14. Nowosielski Adam,
Krzysztof Malecki, Pawel Forczmanski, Anton Smolinski, Kazimierz Krzywicki.
2020. „Embedded Night-Vision System for
Pedestrian Detection“. IEEE
Sensors Journal 20(16): 9293-9304.
DOI: https://doi.org/10.1109/jsen.2020.2986855.
15. Osmančík Radek. 2017. Analýza
změny reakční doby vlivem působení
vnějších a vnitřních vlivů organizmu.
[In Czech: Analysis of the change in
reaction time due to the influence of external and internal influences of the
organism]. Thesis. VŠB – Technická univerzita.
16. Patella Sergio Maria, Simone Sportiello, Stefano
Carrese, Francesco Bella, Francesco Asdrubali. 2020.
„The effect of a LED lighting crosswalk on pedestrian safety: Some
experimental results“. Safety
6(2). Article number 20. DOI: https://doi.org/10.3390/safety6020020.
17. Prentkovskis Olegas, Edgar Sokolovskij, Vilius
Bartulis. 2010. “Investigating traffic accidents: a collision of two
motor vehicles”. Transport 25(2):
105-115.
18. Štěrba Pavel. 2013. Elektronika
a elektrotechnika motorových vozidel: seřizování,
diagnostika závad a chybové kódy OBD. [In Czech: Electronics and electrical engineering of
motor vehicles: adjustment, fault diagnosis and OBD fault codes]. CPress.
19. Vlk František. 2006. Automobilová elektronika.
[In Czech: Automobilová
elektronika]. Brno: Nakladatelství a vydavatelství Vlk.
20. You-Sun Won,
Chung-Hwan Kim, Sang-Gug Lee. 2015. „Range Resolution Improvement of a 24
GHz ISM Band Pulse Radar – A Feasibility Study“. IEEE Sensors Journal 15(12): 7142-7149.
DOI: https://doi.org/10.1109/JSEN.2015.2469154.
21. Zhangjing Wang, Yu
Wu, Qingqing Niu. 2019. „Multi-Sensor Fusion in Automated Driving: A
Survey”. Access IEEE 8: 2847-2868. DOI:
https://doi.org/10.1109/ACCESS.2019.2962554.
22. Zikmund
Tomáš. 2006. Dynamika
podvozkových částí silničních vozidel.
[In Czech: Dynamics of chassis parts of
road vehicles]. Dissertation. Pardubice: Univerzita Pardubice.
Received 02.08.2020; accepted in revised form 30.10.2020
![]()
Scientific
Journal of Silesian University of Technology. Series Transport is licensed
under a Creative Commons Attribution 4.0 International License