Article
citation information:
Hanusik, A. Identification and risk
assessment in carsharing. Scientific
Journal of Silesian University of Technology. Series Transport. 2020, 109, 33-43. ISSN: 0209-3324. DOI: https://doi.org/10.20858/sjsutst.2020.109.3.
Andrzej HANUSIK[1]
IDENTIFICATION
AND RISK ASSESSMENT IN CARSHARING
Summary. There are many new
concepts for doing business in the modern market. Carsharing is one of such
models that are directly related to the sharing economy. The current body of
literature shows an absence of reports about risk management in carsharing
operators. Further investigation of scientific databases confirms the existence
of a research gap in this field. The purpose of this article is for
identification of risks in carsharing and their latter assessment in terms of
probability of occurrence, impact on customer relationships, the importance of
a given category and the cost they generate. A way of aggregating various
categories of risks into one synthetic indicator to prioritise them was
proposed. The methodology of the process was based on a methodological
triangulation which is established on the following studies – analysis
and criticism of literature which helps to place discussed research problems on
a theoretical basis, qualitative research and observations allowing to identify
individual categories of risks and quantitative research enabling the
description of given categories of risks by appropriate variables on which
further risk modelling is performed. Such research may be a basis for
subsequent analysis and an impulse to an academic debate. Besides, it may
contribute to the creation of further studies, which deal with the problem
of assessment of the risk in concepts related to sharing economy.
Keywords: sharing economy, carsharing, risk assessment
1. INTRODUCTION
The modern market has a
very dynamic composition, which forces the search for newer and more innovative
solutions. Current situation brings many changes – both related to the
purely practical business environment and the field of economic sciences.
Certainly, it can be assumed that the advantage of the modern world is the
creativity of business entities and consumers, and thus, innovations that are
present on the free market (reflected by actions of enterprises or market-based
organisations) [1] on the non-market social level (both individual and group)
and even in the sector of government entities [2]. Globalisation and extremely
rapid development of technologies can be considered as factors of these
changes. Furthermore, these factors drive the world towards an increasingly
homogenous community. These changes concern not only the way of communication,
increasing mobility or standardisation of offered products but also the way of
thinking (economic, social and cultural). This situation prompted the emergence
of new concepts of offering using services or items on the market.
Increasingly, the
phenomenon of the shift in the focus of approach to economic goods is noticed
in the business models of enterprises and the consumption behaviour of people.
Business entities are realising a growing awareness of the fact that access to
a given good rather than the necessity of possessing it, is more economically
effective. Sharing economy is a process involving the joint use of goods by
many entities, extended by the aspect of engaging in joint activities [3].
Therefore, the traditional approach to market exchange, where ownership is,
above all, an unlimited possibility to dispose of the good by its owner and a
possibility of creating some kinds of boundaries for other entities that do not
have such good, hence, restricting access, renting or selling the good [4].
The phenomenon of
sharing economy is undeniably associated with market growth, which is being
progressively discussed by academics and businesspersons. The popularity of the
concept and constantly growing pace of solution in this area influences the
change of currently operating business models of enterprises. Sharing economy
is based on transactions related to granting access to a given good without
transferring ownership to it. Hence, the entity receives only a certain unit of
time specified in a contract, in which it can use the given food; acquires the
right to temporary usage [5]. This approach allows the use of certain goods by
entities that would not be able to buy them. This situation allows increasing
the productivity of the economy (by increasing the possibilities for individual
entities) and contributes to minimising the phenomenon of exclusion. The
weakness of this concept lies in the anonymity of entities using a shared good
(in some cases) and the possibility of improper use of the good. Consequently, there
is a risk that the entity, which only uses a given good, may not care for it as
much as in the situation that it owns it. This may result in decreasing the
quality of commonly used goods or services. Accordingly, this situation can be
observed in the case of goods shared by people rather than by enterprises.
Carsharing is one
element of the sharing economy. Carsharing consist of a paid access to a car,
which is not fully used by its owners (in case of private carsharing) or to a
specially adapted vehicle for a short rental (in case of business carsharing).
Access to vehicles is based on one-time or periodic payments. Cars are almost
only used for short local journeys, as renting a car for a longer period
attracts very high costs [6]. The whole transaction is concluded and settled
using a dedicated application, so there is no need for direct contact with the
client. The use of a sharing economy (including carsharing), in urban areas,
may contribute to the improvement of the transport situation in the given area;
transport will become cleaner, more intelligent and more sustainable. More so,
the mobility behaviour of citizens and business entities would change, which
will contribute to increasing the efficiency usage of infrastructure and
reduction of cost [7]. Such a solution is a very convenient form for
consumers; however, it is associated with an increased risk for the entity
offering the carsharing services.
It can be presumed that
concepts related to sharing economy will develop dynamically in the future. It
is related to the market itself and the nature of the Y-generation who are
increasingly active on the market. This generation is keen on searching for
innovative solutions, thus, they wholly embrace the sharing economy.
Additionally, the Y-generation are eager to take risky actions [8], which
impacts on the costs and risk bore by carsharing operators. Therefore, it is
necessary to identify risky activities and the probability of their occurrence
for entities offering carsharing services to create an efficient and effective
risk management system
2. METHODOLOGY AND DATA
The research methods and
techniques used in this work were based on methodological triangulation (Figure
1). The structure of the study allowed for an in-depth analysis of the problem
and for obtaining more reliable conclusions.
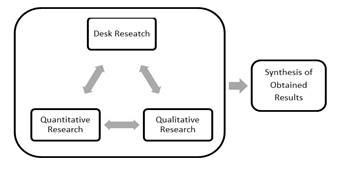
Fig. 1.
Methodological triangulation used in this study
In the first part of the
article, the method of analysis and criticism of literature (desk research) was
used. It includes a systematic and orderly study of previous scientific works
and existing publication resources [9]. The use of this method allowed the
identification of the research problem and defined ways to solve it.
Furthermore,
observations were made to identify risks that occur in carsharing activities.
This method consists of discreet observation of people using carsharing, their
behaviour when renting a vehicle, its use and return. This allowed identifying
the types of risks to be considered in the risk analysis.
Thereafter, the IDI
(Individual In-depth Interview) method was used. In-depth interview is a
qualitative research technique, which involves conducting intensive individual
interviews with a small number of respondents. The result of the interviews
provides information about their knowledge and point of view on the selected
topic. IDIs are used in the case of new research problems that were not
previously scientifically discussed or were discussed superficially [10].
In-depth interviews were conducted with carsharing users, sharing economy
experts, and carsharing services providers. The structure of the interviews was
semi-structured (respondents were asked questions following the prepared
scenario with freedom of expression allowed). Conducted interviews allowed the
identification of subsequent risk categories and their initial assessment.
The last step related to
collecting data was surveying the assessment of individual risk categories in
terms of likelihood of their occurrence, impact on customer relations (if
detected by the customer) and a subjective indication of a maximum of three
risks most relevant to carsharing activities. Overall, 528 people took part in
the survey (snowball sampling). The survey was conducted from October 1, 2019,
to October 22, 2019, using paper and online forms. Fourteen surveys were
rejected due to wrong filling, lack of information or illegibility.
Next, based on previous
steps and additional analyses, individual risk categories were assessed in
terms of the following indicators:
-
X1
– probability
of risk occurrence (expressed in the form of assessments obtained through
surveys), where:
o 1 – very low probability of
occurrence,
o 2 – low probability of occurrence,
o 3 – average probability of
occurrence,
o 4 – high probability of occurrence,
o 5 – very high probability of
occurrence.
-
X2
– impact on relations with customers (expressed in the form of
assessments obtained through surveys), where:
o 1 – very large negative impact,
o 2 – large negative impact,
o 3 – medium negative impact,
o 4 – little negative impact,
o 5 – very little negative impact.
-
X3
– significance of a given risk category - number of survey responses
(expressed in%).
-
X4
– costs associated with the occurrence of a given risk - to determine the
most likely cost associated with the occurrence of a given risk (Co), a triple estimation was used (following the PERT
methodology). Optimistic (Cc), most likely (Cm) and pessimistic (Cp) cost
values were adopted for each risk. The value was received via IDIs. The
expected value of the beta distribution was calculated from the formula [11]:
![]() (1)
(1)
Thereafter, the
calculation of key risks in carsharing activities was made. First, the
assignation of superior importance indicators and lesser importance indicators
for the carsharing enterprises were made. The weights were determined by
analysing in-depth interviews with representatives of carsharing companies. It
should be noted that each risk category has been described by four indicators,
which are characterised by different units and the values associated with the
highest level of risk in individual categories, once strive for maximum, once
for minimum. This situation required aggregating all indicators into one
synthetic indicator (Si), which allowed obtaining comparable results:
![]() (2)
(2)
where X’ij represents aggregated
values for individual indicators. Aggregated values were calculated from the
formulas:
![]() (3)
(3)
or
![]() (4)
(4)
where Xij is the indicator value for a
particular risk category. The maximum value means that the highest score is
associated with the highest risk, whereas, the minimum, the lowest score is the
highest risk.
It is likewise worth
noting that:
![]() (5)
(5)
To simplify the
calculation, the weight values for individual indicators have been allocated
using the percentage presented in decimal form:
![]() (6)
(6)
Thus, the formula for the synthetic
indicator has been simplified to the form:
![]() (7)
(7)
The procedure carried
out in this way leads to the aggregation of individual indicators into one
synthetic indicator, which allows for prioritising individual risk categories
and placing them in the strategy of a carsharing company.
3. RESULTS
Through the observations
and individual in-depth interviews (IDI), the following types of risk have been
identified to occur in carsharing:
-
Y1 –
vehicle theft – for the analysis, one of the most popular passenger
carsharing vehicles in Poland (Renault Clio) was selected. For example, it is
used by Traficar [12];
-
Y2 –
gasoline theft – the vehicle is not serviceable, it is necessary to
refuel and possibly tow;
-
Y3 –
total damage of the vehicle – the car is not capable of further use;
-
Y4 –
partial damage of the vehicle – the vehicle is capable of further use
after making the necessary repairs;
-
Y5 –
leaving the vehicle in a dangerous place – generates the risk of damage
or theft - direct costs associated with the necessity
of moving the vehicle or are connected with
lost sales opportunities;
-
Y6 –
leaving the vehicle in an unauthorised place – the risk of receiving a ticket, towing away or
damaging it;
-
Y7 –
dirty exterior of the car – the risk of losing customers and incurring
washing costs;
-
Y8 –
dirty
interior of the car – the risk of losing customers and incurring
cleaning costs;
-
Y9 –
running out of gasoline/discharging an electric vehicle during use – the
risk of losing customers, towing costs;
-
Y10 –
mobile application problems – the risk of losing customers;
-
Y11 –
making the vehicle available to third parties – the possibility of
damage, the problem with debt collection;
-
Y12 –
driving in a state of intoxication – the possibility of damage, the risk
of losing customers, negative opinions from customers;
-
Y13 –
counterfeit documents during registration – a problem with establishing
the driver's identity and with debt collection;
-
Y14 –
lack of funds for service fee - freezing capital, the need to start the debt
collection.
Categories of risk
listed above were assessed by respondents in terms of three measures and
supplemented by the estimation of costs associated with their occurrence. The
costs were estimated based on the real value of the vehicles, their equipment,
fuel prices or costs related to transport-related services; cleaning, towing,
repairs or costs of the debt collection process. Table 1 shows the results of
the conducted research (rounded to two decimal places).
Tab. 1
Research results
|
|
mX1 max |
mX2 min |
mX3 [%] max |
X4
[PLN] max |
|
|
Y1 |
2,58 |
1,93 |
37,88 |
Cc = 20 000; Cm= 50 000;
Cp = 60 000 the cost depends on
the age and condition of the car |
Co ≈ 46 667 |
|
Y2 |
2,69 |
2,31 |
12,12 |
Cc = 150; Cm= 250; Cp =
500 the cost depends on
the price of gasoline and the need for towing |
Co ≈ 275 |
|
Y3 |
3,00 |
1,75 |
41,67 |
Cc = 20 000; Cm= 50 000;
Cp = 60 000 the cost depends on
the age and condition of the car |
Co ≈ 46 667 |
|
Y4 |
3,92 |
2,08 |
48,48 |
Cc = 2 000; Cm= 5 000; Cp
= 20 000 the cost depends on
the scale of damage |
Co ≈ 7 000 |
|
Y5 |
3,53 |
2,62 |
21,97 |
Cc = 20; Cm= 50; Cp =
200 the cost of moving the
vehicle and loss of customers |
Co ≈ 70 |
|
Y6 |
3,77 |
2,74 |
25,00 |
Cc = 20; Cm= 100; Cp =
1 000 the cost of moving,
towing away, parking and loss of customers |
Co ≈ 237 |
|
Y7 |
4,02 |
3,55 |
3,03 |
Cc = 10; Cm= 30; Cp = 80 the cost of travelling
to the car wash and washing |
Co ≈ 35 |
|
Y8 |
4,01 |
2,88 |
21,97 |
Cc = 100; Cm= 250; Cp =
1 000 the cost of travelling
and cleaning service |
Co ≈ 350 |
|
Y9 |
3,40 |
2,39 |
11,36 |
Cc = 50; Cm= 100; Cp =
300 the cost of towing and
loss of customers |
Co ≈ 125 |
|
Y10 |
3,19 |
2,44 |
23,48 |
Cc = 30; Cm= 300; Cp =
5 000 the cost of losing
customers |
Co ≈ 1 038 |
|
Y11 |
3,23 |
2,83 |
18,94 |
Cc = 0; Cm= 30; Cp = 150 the cost of
non-payment, debt collecting and loss of customers |
Co ≈ 45 |
|
Y12 |
3,08 |
2,23 |
16,67 |
Cc = 0; Cm= 30; Cp = 1
000 the cost of
non-payment and a lawsuit |
Co ≈ 187 |
|
Y13 |
2,65 |
2,48 |
15,15 |
Cc = 0; Cm= 30; Cp =
1 000 the cost of
non-payment and possible damage |
Co ≈ 1 687 |
|
Y14 |
2,92 |
2,82 |
2,27 |
Cc = 0; Cm= 30; Cp = 100 the cost of
non-payment |
Co ≈ 37 |
The values of the X1, X2 and X3 measures presented in the table are the values
obtained in the survey. Costs are indicative values, which should be considered
individually in each case. Nevertheless, certain values must be adopted to
conduct a risk analysis. Their size depends primarily on the scale of the
problem or the occurring abuses. The values of individual measures were
estimated using IDI. Triple cost estimation was used to best fit the model to
reality.
The next part of the
research was to calculate the value of the synthetic indicator. The following
weights of individual factors were adopted in this study: w1 = 0.30; w2 = 0.20;
w3 = 0.20; w4 = 0.30. The base for establishing the weights of individual
factors were the expectations of the carsharing companies. According to IDIs, the
costs and probability of risk occurrence are the most important (they
constitute 60% of weight). Customer relations (the X2 and X3
measures) represent 20% in the analysis (10% per gauge). Table 2 presents the
results of the conducted analysis (to obtain more accurate results, the values
of the calculated indices have been rounded to four decimal places).
Tab. 2
Synthetic indicator results
|
|
X1 w1 =
0,30 |
X2 w2 =
0,20 |
X3 w3 =
0,20 |
X4 w4 =
0,30 |
∑ |
|
Y1 |
0,1925 |
0,1813 |
0,1563 |
0,3000 |
0,8301 |
|
Y2 |
0,2007 |
0,1515 |
0,0500 |
0,0018 |
0,4040 |
|
Y3 |
0,2239 |
0,2000 |
0,1719 |
0,3000 |
0,8958 |
|
Y4 |
0,2925 |
0,1683 |
0,2000 |
0,0450 |
0,7058 |
|
Y5 |
0,2634 |
0,1336 |
0,0906 |
0,0004 |
0,4880 |
|
Y6 |
0,2813 |
0,1277 |
0,1031 |
0,0015 |
0,5136 |
|
Y7 |
0,3000 |
0,0986 |
0,0125 |
0,0002 |
0,4113 |
|
Y8 |
0,2993 |
0,1215 |
0,0906 |
0,0022 |
0,5136 |
|
Y9 |
0,2537 |
0,1464 |
0,0469 |
0,0008 |
0,4478 |
|
Y10 |
0,2381 |
0,1434 |
0,0969 |
0,0067 |
0,4851 |
|
Y11 |
0,2410 |
0,1237 |
0,0781 |
0,0003 |
0,4431 |
|
Y12 |
0,2299 |
0,1570 |
0,0688 |
0,0012 |
0,4569 |
|
Y13 |
0,1978 |
0,1411 |
0,0625 |
0,0108 |
0,4122 |
|
Y14 |
0,2179 |
0,1241 |
0,0094 |
0,0002 |
0,3516 |
The conducted analysis
allows for prioritising individual risk categories in terms of their importance
for carsharing companies. The analysis methodology presented in this work can
be a starting point for further in-depth research. Moreover, the results obtained
may be the starting point for creating risk management strategies for
carsharing companies.
4. DISCUSSION
After the analysis,
individual risk categories were ordered according to their importance for the
risk management strategy of carsharing enterprises. Table 3 presents values of
the synthetic measure in a hierarchical order.
Tab. 3
Synthetic
indicator results in
descending order
|
Y3 |
0,8958 |
|
Y1 |
0,8301 |
|
Y4 |
0,7058 |
|
Y6 |
0,5136 |
|
Y8 |
0,5136 |
|
Y5 |
0,4880 |
|
Y10 |
0,4851 |
|
Y12 |
0,4569 |
|
Y9 |
0,4478 |
|
Y11 |
0,4431 |
|
Y13 |
0,4122 |
|
Y7 |
0,4113 |
|
Y2 |
0,4040 |
|
Y14 |
0,3516 |
The key risks for
carsharing companies were total vehicle damage (Y3), vehicle theft
(Y1) and partial vehicle damage (Y4). This situation is
associated with the higher costs of these events, in this case, a good solution
is vehicle insurance and a record in the regulations about the assignation of
costs related to vehicle damage to the consumer, such solutions are practically used in all carsharing companies, that is,
Traficar [13], Panek [14] or Drive Now [15]. The fee is usually transferred to
the user in a situation when there is a necessity of paying a parking fee (Y6),
cleaning the car (Y8) or when an unauthorised person drives a
vehicle (Y11).
Leaving the vehicle in a
dangerous place (Y5) may similarly be a big problem, as this may
result in damage to the vehicle or loss of customers. The solution may be the
so-called "cutting out zones", that is, determining areas in which
the car cannot be left unattended.
Application issues (Y10)
are very important problems. Although they are not associated with high costs,
they have a relatively large impact on the relationship with customers.
Moreover, according to the conducted research, problems with applications
happen at times, which also has an impact on the company's image.
Driving in a state of
intoxication (Y12) is a very big problem for road safety.
Furthermore, carsharing vehicles are often available in entertainment
districts, which may encourage inebriated people to use them, for example, when
returning home. It should be noted that driving in the state of intoxication is
not a very important risk for carsharing companies, in the event of an
accident, collision or dirt, the driver is held liable. Nevertheless,
preventive actions may be part of the CSR strategy of carsharing operators.
Running out of gasoline
or discharging an electric car (Y9) during usage of the vehicle is
unlikely. This situation is caused by a lack of care on the part of the
enterprises to constantly supplement them. However, it should be noted that
when such a situation occurs, it could contribute to significant traffic difficulties,
negative opinion about the entrepreneur, and in the worst case, even to a
collision or accident.
The use of counterfeit
documents during registration (Y13) is not a common situation.
Although, it may lead to problems with determining the driver's data and the
subsequent recovery of receivables, nevertheless, carsharing companies often
protect themselves in an additional way, the second stage of verification is
the need to connect to the credit card system and / or make a small amount
transfer. Such activities significantly impede the provision of false data.
However, they do not protect the enterprise against possible losses related to
the collection of receivables due to lack of funds for travel (Y14).
However, the losses, in this case, are small. More so, usually after sending a
reminder, the customer decides to pay. Nevertheless, in some cases it is
necessary to start the debt collection process, which is not profitable for
small amounts (such as those usually associated with car journeys for minutes),
which may result in the operator's unwillingness to initiate proceedings; the
case will probably result in blocking the account. However, these small
unrecovered amounts do not affect the overall balance of the enterprise (the
effect of scale works here), besides, they are also not often encountered,
which is the reason this risk was ranked last in the hierarchy.
The dirty exterior of
the car (Y7) is the situation with the highest probability of
occurrence. Whereas the costs associated with levelling it are small, and the
mere contamination of the car body does not affect the customer's decision to
rent the car. The standard public approach is the fact that cars are utility
items that could get dirty. Moreover, soiling the outside of the car does not
affect the comfort of travelling (unless the windows, lights or mirrors are
dirty).
Gasoline theft (Y2)
in modern times is quite a common situation (especially in transport
companies). This situation is primarily related to gasoline prices, a strong
correlation can be observed between the number of thefts and the price of
gasoline [16]. Nevertheless, there are many effective methods to prevent theft.
Additionally, vehicles of the carsharing fleet are constantly monitored, so
thieves prefer to steal from private cars.
5. CONCLUSION
The analysis allowed
obtaining a catalogue of risks related to carsharing activities and prioritise
them in terms of importance for operators. To the best of the author's
knowledge, no article dealing with these issues has been published before now.
The author is also aware of the diversity of expectations of individual operators,
which means that the conducted research indicates only the most important
factors in the industry. Moreover, the choice of measures for assessing
individual risk categories depends on the individual preferences of operators.
Nevertheless, the analysis may prove to be the foundation for further research
and provide a starting point for creating risk assessment strategies in
carsharing activities.
Furthermore, it should
be noted that each analysis is tailored to a specific market. The approach of
customers, the likelihood of a given risk or prices may vary depending on the
geographical location, the economic system of the given country or cultural
conditions. This analysis is adapted to the specifics of the Polish market;
however, some features may be common with other areas.
The author's goal was to
identify the research gap regarding the concept of sharing economics and
initiate an academic debate on this topic. This article is to constitute an
introduction to further extended research in this field.
References
1.
Amabile T. M. Creativity and Innovation in Organizations. Harvard Business School
Background Note. 1996. No. 396-239. 123 P.
2.
Paulus P., B.M. Dzindolet. 2008.
“Social Influence, Creativity and Innovation”. Social Influence 3(4): 228-229.
3.
Felson M., J. Spaeth. 1978. „Community
Structure and Collaborative Consumption: A Routine Activity Approach”.
The American Behavioral
Scientist
21(4): 614.
4.
Rudawska I. 2016. „Ekonomia
dzielenia się, czyli konsumpcja współdzielona i inne formy
alternatywnego dostępu do dóbr”. Studia Ekonomiczne. Zeszyty Naukowe Uniwersytetu Ekonomicznego w
Katowicach 254: 183-184. [In
Polish: „Sharing Economy – Collaborative Consumption and Other Forms of
Access-based Consumption”. Economic
Studies. Scientific Notebooks of the University of Economics in Katowice].
5.
Lovelock Ch., E. Gummesson. 2004. “Whither Service Marketing? In
Search of a New Paradigm and Fresh Perspectives”. Journal of Service Research 7(1): P. 29.
6. Bardhi F., G.M. Eckhardt.
2012. “Access-Based Consumption: The Case of Car Sharing”. Journal of Consumer Research 39(4): P.
886.
7. Flügge B. 2017. Smart Mobility – Connecting Everyone.
Trends, Concepts and Best Practices. Wiesbaden: Springer Vieweg.
8. Hanusik A.
“Y-generation's Perception of Sharing Economy”. 12th International Scientific Conference
“Analysis of International Relations 2019. Methods and Models of Regional
Development”. Conference Proceedings. Katowice, 2019. P. 5-16.
9. Cisek S. 2010. „Metoda analizy i krytyki
piśmiennictwa w nauce o informacji i bibliotekoznawstwie w XXI
wieku”. Przegląd Biblioteczny 3: P. 273-284. [In Polish: “Methods of Literature Analysis and Criticismin
Library and Information Ccience in
21st Century”. Library Review].
10. Boyce C., P. Neale.
2006. “Conducting In-depth Interviews: A Guide for Designing and
Conducting In-Depth Interviews for Evaluation Input”. Pathfinder International Tool Series.
Monitoring and Evaluation 2: P. 3-12.
11. Patan M. „Badania
operacyjne. Programowanie sieciowe. Metoda PERT”. Instytut Sterowania i
Systemów Informatycznych. Uniwersytet
Zielonogórski. Available at:
http://staff.uz.zgora.pl/mpatan/materialy/badoper/wyklady/druk_5d.pdf [In Polish: “Operations research. Network programming. PERT
method”. Institute of Control and
Information Systems. University of Zielona Góra].
12. Flota Traficara - samochody osobowe. Traficar.
Available at: https://www.traficar.pl/cars [In Polish: Traficara fleet -
passenger cars].
13. Regulamin korzystania z usługi Traficar. Traficar. Available at: https://www.traficar.pl/regulamin/pl/regulamin.html [In Polish: Regulations of using
the Traficar service].
14. Regulamin Panek S.A. w zakresie
najmu samochodów. Panek. Available at:
https://www.ipanek.pl/sites/all/pliki/regulamin_rac_6.03.2019.pdf [In Polish: Regulations of Panek S.A. in the field of
car rental].
15. Service fees. Drive Now. Available at:
https://www.drive-now.com/gb/en/pricing/standard-fees.
16. Moffatt S., J. Fitzgerald. 2006. “The relationship between petrol
theft and petrol prices”. Crime and
Justice Bulletin: Contemporary Issues in Crime and Justice 101: 1-4.
Received 10.08.2020; accepted in revised form 29.10.2020
![]()
Scientific
Journal of Silesian University of Technology. Series Transport is licensed
under a Creative Commons Attribution 4.0 International License