Article
citation information:
Mehriar, M., Masoumi, H.,
Nosal-Hoy, K. Correlations of urban sprawl with transport patterns and socioeconomics
of university students in Cracow, Poland. Scientific
Journal of Silesian University of Technology. Series Transport. 2020, 108, 159-181. ISSN: 0209-3324. DOI: https://doi.org/10.20858/sjsutst.2020.108.14.
Melika MEHRIAR[1],
Houshmand MASOUMI[2],
Katarzyna NOSAL-HOY[3]
CORRELATIONS
OF URBAN SPRAWL WITH TRANSPORT PATTERNS AND SOCIOECONOMICS OF UNIVERSITY
STUDENTS IN CRACOW, POLAND
Summary. Urban sprawl is considered as a western urban
development pattern, which is common in different cities around the world.
Although, a large number of studies have focused on urban sprawl, modelling
urban sprawl has been less emphasised, especially in various geographical
contexts. This study aims to investigate urban sprawl and its determinants in a
post-socialist country and model urban sprawl based on disaggregated data. In
addition, the correlations of urban sprawl with travel patterns were examined,
along with the socioeconomic characteristics of university students in Cracow,
Poland by applying the Weighted Least Square (WLS) regression model. The WLS
regression model was fitted based on the data from 1,288 online questionnaires
targeting university students. Furthermore, urban sprawl around the home and
the university for each student who indicated the nearest intersection to their
home and university were separately estimated by employing the Shannon entropy.
Based on the findings, urban sprawl around homes was correlated with 14
transport patterns and socioeconomic features such as gender, age, driving
license, financial dependency status, gross monthly income, number of commute
trips, mode of transportation for commuting, number of trips for shopping or
entertainment, daily shopping area, mode choice for shopping and entertainment
trips inside and outside the neighbourhoods, frequency of public transport use,
the attractiveness of shops inside the neighbourhoods, and the length of time
living in the current home. Additionally, urban sprawl around the university
was significantly correlated with age, car ownership, number of commute trips,
and a sense of belonging to neighbourhoods, entertainment place, and
residential location choice. Finally, a positive correlation was reported
between urban sprawl with higher income, elderly student, financial dependent
students, and car dependency trips, while urban sprawl was negatively related
to the use of public transit.
Keywords: urban sprawl, socioeconomics factors, travel
pattern
1. INTRODUCTION
Urban sprawl is considered as a
specific urban form which is characterised as a low-density, single land use,
car-dependent, discontinues or leapfrog new development, or uneven pattern of
growth between urban population and urban areas [14, 18, 26, 45]. Although urban sprawl is
well-known as an American urban form, it is regarded as a controversial topic
among urban planners and decision-makers in different parts of the world, which
has been discussed as a global problem. Urban sprawl is related to
environmental, social, and economic issues. For instance, urban sprawl can
influence the environment by increasing CO2 emission in more
long-distance commuting trips or using natural resources as a new development
area [16, 26, 49].
More distances are driven by car,
less use of walking and public transport, long-distance between home and
workplaces, lack of sense of place, low density and single land-use area are
highly related to different social, economic, cultural, and geo-demographic
circumstances, which should be considered in urban planning. Although, some
studies focused on the relationship between urban form and travel behaviour [6, 16, 17, 19, 20, 26, 30, 38-40, 43, 49], more should be conducted to
evaluate urban sprawl as an urban form which is correlated with various
socio-economic indicators and travel patterns based on different geographical
contexts. The correlation among urban sprawl, individual socio-economic
variables, and travel behaviour clarify a better understanding of modelling
urban sprawl and provide more practical policies for urban planners. Urban sprawl
has been a matter of concern not only in developed countries but also in
developing parts and emerging economies. Although, there is no agreement in
definition and its quantification, the characteristics of urban sprawl were
discussed by urban researchers [4, 10, 14]. However, less attention has been
paid to the mechanisms, processes, patterns, and factors related to urban
sprawl in different parts of the world. On the other hand, urban form plays an
important role in travel literature [11, 16, 19, 47]. Hence, urban sprawl as a specific
urban form associated with socioeconomic determinants and travel behaviours
based on economic, governmental, and geographical context. Although, urban
sprawl was studied in post-socialist cities [8, 21, 31, 35, 42], most paid more attention to the
differences between socialist and post-socialist cities and impact of
transformation on urbanisation in these cities. However, the socioeconomic
determinants, travel patterns, and their association with urban sprawl were not
considered in the literature.
Inhabitants living in sprawled
neighbourhoods suffer more from traffic congestion, air pollution,
long-distance commuting, lack of efficient public transport, lack of social
interactions than those who live in compact urban forms. Based on sustainable
development, studying the correlations between urban sprawl and its different
factors including individual, household and, socio-economic characteristics,
self-selection of the home place, mobility, urban form and perceptions in the
Polish city can provide a better understanding of urban sprawl and its
determinants in the post-socialist city. Urban sprawl is observed across the
continent, although, European urban areas are more compact than Western cities
in the United States. Recently, Urban sprawl has been developed in the
post-socialist context. However, no study has been conducted based on reliable
and disaggregated data.
Thus, this study aims to evaluate
the interrelations between urban sprawl, mobility choices, socioeconomics, and
perceptions of university students in Cracow, which represents Polish’s
larger city, as well as considering context-specificity of these factors by
conducting a descriptive comparison between the results of this paper and determinants
of urban sprawl in a different context. In addition, there is a shortcoming in
modelling effective factors on urban sprawl based on disaggregated data in
Eastern-European countries compared to the western countries. Therefore, urban
sprawl and urban form features were measured for each participant individually
in this study, and the features of urban sprawl were simulated.
The remainder of this paper is as
follows; Section 2 reviews the determinants of urban sprawl in the sprawl
literature, as well as in the context of emerging economies and post-socialist
cities, and an overview of urban sprawl in Polish cities. Section 3 describes
the brief explanation of the methodology. Section 4 presents the main findings
of the results. While, section 5 demonstrates urban sprawl and its determinants
contextually and discusses the findings in Poland and international literature,
as well as the implications of urban sprawl in Poland. Finally, the conclusion
is presented in Section 6.
2. THE RELATION BETWEEN URBAN SPRAWL
AND SOCIETAL PHENOMENA
There is no unique definition of
urban sprawl. The term "urban sprawl" describes low-density, single
land use, inefficient, suburban development around the edge of cities, leapfrog
and discontinues urban forms distinct from those identified in the United
States. Urban sprawl is defined as low-density, leapfrog development in a
relatively pristine setting [4]. Galster et al. (2001) argued that
urban sprawl is a pattern in an urban area which has a relatively low level of
eight dimensions including density, continuity, concentration, clustering,
centrality, mixed uses, and proximity [14]. Urban sprawl as a type of urban
form, which is related to socioeconomic and travel pattern, has attracted a lot
of attention during recent decades. In addition, metropolitan expansion, low
density, diversity of land use as three dimensions of urban sprawl were
evaluated along with their relation to flow network, mode-choice, and commuting
time in the metropolitan area of Madrid [15]. Further, the correlation between
socio-demographic features of households, the individual, urban structure at
both home and workplace with the travel pattern in Beijing, China was
considered. The results indicated a significant correlation between tour-travel
decision and socioeconomic attributes [24]. However, Zhao (2010) considered
the sprawl pattern of expansion and the increase in distance trip and
car-dependent travel in Beijing as a megacity [49]. Additionally, the differences
between socioeconomic causes of urban sprawl in China and western urban sprawl
were investigated to determine the drivers of urban sprawl in China. Thus,
urban population density, gross domestic product per capita, and industrial
structures in China were considered as main determinants [26]. Hamidi et al. (2016) applied principal
component analysis and cross-sectional data to operationalise
sprawl/compactness in four contributors of urban sprawl including development
density, land use mix, centralisation of activities, and street accessibility [19]. Ewing et al. (2016) examined the
relationship between urban sprawl and upward mobility for Americans. The result
indicated that upward mobility is considerably higher in compact areas than
sprawling areas due to more accessibility to better job [12]. European Environment Agency (2016)
measured the urban sprawl between European countries, along with urban sprawl
determinants and its impact on natural resources [9]. Guerra et al. (2018)
applied a multinomial model to examine the preference of commuters by different
transport modes based on the role of age, income, education, and information
about urban area [16]. Travisi et al. (2010) analysed the
causal relationship between spatial developments, the sprawling pattern of the
urban area and travel movement in seven major Italian cities using the mobility
impact index, the cross-section data, and the Casual Path Analysis (CPA). The
empirical results indicated the high impacts on travel behaviour of less
compact and mix-used cities [44]. Shorter distance to the city
centre and high-density neighbourhoods are associated with lower trip duration
to work or education. Thus, the residents in compacted neighbourhoods are more
willing to use active mode transport (walking and biking) than those living in
sprawled neighbourhoods [32]. The socio-economic contributors of
urban sprawl were modelled by employing regression model of urban sprawl metric
in Switzerland. Furthermore, the increase in population and income, and the
changes in social patterns such as single household and age resulted in
creating sprawl [32]. In another study in Switzerland,
the components of the urban sprawl metric developed by [22, 23], were applied in the
cross-sectional regression model to study urban sprawl, along with its
socio-demographic factors such as population, income, commuting pattern, price
of agricultural land, homeowner rate, age, and single household [47]. Urbanisation in the 20th century
was associated with modernisation and industrialisation as two primary
socio-economic trends [42]. Thus, post-socialist cities were
influenced by these two crucial trends like other parts of the world but at
different speeds and time. Evaluating the cities in socialist countries
indicated that the political economy is considered as a significant factor in
shaping urban areas. Cities have some similarities and differences between
capitalism and socialism in some aspects. In socialist cities, political
and economic forces drove the built environment, land use, and patterns of
allocation. However, there are some similarities in the spatial patterns of
both capitalism and socialism since industrialisation and modernism. Socialist
cities captured the features of capitalism context with the delay of a few
years. To understand the post-socialist city better, it is necessary to study
socialist cities' former Iron Curtain in East-Central Europe. Compared with the
capitalist cities, especially American types, cities were denser in the
socialist period. However, the industrialisation of the socialist economy led
to boom industrial centres, which attracted rural migrants to the cities.
Hence, socialist cities faced a fast growth in the urbanisation [21].
Socialist cities did not experience
urban sprawl like the United States. Inhabitants in socialist cities were
accommodated in mass-housing complexes between 1960 and 1980 in urban edges [5]. Socialist cities were governed
through the top-down centralised control of regional development. Spatial
public space and urban development were concentrated in target areas by land
development policies of a hierarchically organised system. In addition, the
construction of massive housing estates at the urban edge, a dense network of
public transportation, and allocation of services in neighbourhoods, districts,
and urban centres according to a hierarchically organised system characterised
socialist cities [3, 42]. The urban development of larger
cities in East-Central Europe has been transformed by collapsing socialism in
the 1990s. The interactions between the socialist urban structure and new
ideologies, the market economy, and the democratic governments have shaped
post-socialist cities. Transformation in spatial patterns of the urban area is
considered as one of the dimensions of transformation, along with the changes
in social, political, cultural, and economic aspects of East-Central Europe.
Suburbanisation has become the most familiar process of changing the landscapes
of post-socialist cites. Rapidly developing suburban sprawl and residential
segregation are regarded as a consequence of uneven development and following
globalisation in post-socialist cities [35, 42]. The clear edge of Eastern/Central
European city was vanished by the end of socialism. Land-cover changes studies
in Europe indicated a high rate of sprawling in post-socialist cities than
Western Europe [9]. Urban sprawl has been enabled by
transformation policies such as urban land, housing, and the properties have
been revalued as economic goods due to the cancelling restrictions on private
ownerships. In addition, car ownership increased in most parts of
Eastern/Central Europe, which affected public transport, urban structure,
especially in the urban form [21, 31]. After falling socialism in 1989,
some changes occurred in special and social aspects of urban structures.
Post-socialist suburbanisation and decentralisation of population and
employment in Polish cities were considered as an urban form. Hence, Polish
urban sprawl is in the early stages. Polish suburbanisation is identified by
the large distances from the city centres, the extension of single-family
housing, and the desire to live in the suburban zone compared to the core
cities [41].
New Polish urban structures in the
form of urban sprawl were driven by liberalising spatial planning, uneven
growth, and socio-economic transformation [25, 27, 28]. The government policies during
socialism emphasised relocation of workplaces outside the boundaries of Polish
cities. Thus, the low quality of coordinated pattern of land development, the
transformation of agricultural land, and degradation of natural resources are
considered as the consequences of these policies. Economy transition,
especially in land market, led to the escalating price of land in large Polish
city centres. Hence, more agricultural lands were sold in the periphery of the
cities [27]. Moreso, Polish cities faced
massive growth in car ownership since 1990, which is related to the territorial
development of urban areas and congestion on the roads [2]. Furthermore, privatisation and
residential suburbanisation were promoted by national policies to support
investment in housing during the 1990s. The lack of public facilities and
infrastructure in new development areas is considered as one of the most
critical issues accompanying urban sprawl in Poland because Polish local
governments are obligated to pay high compensation to landowners for allocation
of public facilities [29]. Mantey and Sudra (2019) studied 16
types of post-socialist suburbs in Warsaw, Poland, among which four planned the
pattern of housing and high-density populated based on street grid
neighbourhood. Contrarily, the other 12 categories followed leap-frogging new
neighbourhood based on cul-de-sac street network, which was considered as
sprawl pattern in the literature [29].
3. METHODOLOGY
3.1. Research objectives and
hypotheses
This study aims to identify the
determinants of urban sprawl in Cracow as an example of a large Polish city and
determine whether factors such as transportation, socioeconomics, human perceptions,
residential location choice, and urban form features of Cracow university
students are correlated with urban sprawl or not. In addition, it seeks to
determine the differences between these correlations in the case study compared
with those of high-income countries. Following, these objectives illustrate how
urban sprawl and its determinants, especially the relationship between urban
sprawl and travel behaviour, may be different in various social, historical,
cultural, and economic contexts.
The main hypothesis is that a wide
range of factors including commute and non-commute travel patterns,
socioeconomics, human perceptions, residential self-selections, and urban form
features are significantly correlated with urban sprawl in Cracow, Poland. Furthermore,
the correlation between urban sprawl and travel behaviour and socioeconomic
factors in Cracow as a post-socialist city is different from those in
high-income countries like North American cities, Western Europe, and
Australia. Hence, urban sprawl follows different patterns and determinants in
the different parts of the world based on various complex conditions between
developed and developing countries and emerging economies.
3.2. Data and variables
To test the hypotheses, 1,288 online Polish-language questionnaires were
collected and validated during the winter of 2019. The questionnaires were
randomly distributed among university students of Cracow, which indicated home
and university places in different districts of Cracow. It included 23 questions
based on individual and household socioeconomic factors, commute and
non-commute travel patterns, perceptions of the urban environment, and mode
choice of transportation. In addition, urban form and configuration of street
network variables were extracted by using Geographical Information System (GIS)
version 10.3 for both home places and university, respectively. Therefore, 24
variables were developed including 20 socioeconomic factors, travel behaviour
and perception variables such as gender, age, main daily activity, driving
license, car ownership, financial dependency status, gross income per month,
number of commute trips per week, mode of transportation of commute trips per
week, number of non-commute trips including those for shopping or recreation
per week both inside and outside of the neighbourhood, daily shopping area,
mode choice for shopping and recreational trips in both inside and outside of
the neighbourhood, the frequency of public transport use, sense of belonging to
the neighbourhood, entertainment place, the perception of the quality of
social-recreational facilities of the neighbourhood, residential location
choice, length of time living in the current home, and two urban form variables
for each home and university according to the home and university place
specified by each student. The respondents indicated the nearest intersection
to their home and university, and then their address was pinned in two layers
in the Google Maps as separate layers for home and university. The layers were
exported in KML format to get the GIS-ready layers. Hence, each point in the
layer of home and university represents each university student's home and
university, respectively. Afterwards, the 600-metre catchment area based on the
street network for each point was measured to compute other variables in the
catchment area. The inverse of Building Coverage Ratio (BCR) was calculated
around home and university. Furthermore, the free shapefiles of Cracow were
downloaded from Open Street Map (OSM) in the computing Shannon entropy and
inverse of building coverage ratio, and network dataset were built in ArcMap
version 10.3. All variables are presented in Tab. 1.
Tab. 1
Variables
|
Coding |
Source /
Quantifications |
Variables |
|
|
Men=1, female=2 |
Extracted by questionnaire |
Gender |
|
|
- |
Extracted by questionnaire |
Age |
|
|
Only student=1 Work and study=2 |
Extracted by questionnaire |
Main daily activity |
|
|
No=0 Yes=1 |
Extracted by questionnaire |
Driving license |
|
|
Without car=0 1 car &2 cars and
more=1 |
Extracted by questionnaire |
Car ownership |
|
|
No=0, yes=1 |
Extracted by questionnaire |
Financial dependency
status |
|
|
Below 1000 PLN=0 From 1001 to 2000 PLN=1 |
Extracted by questionnaire |
Gross monthly income |
|
|
- |
Extracted by
questionnaire/each respondent indicated the number of trips for last week |
Number of commute trips |
|
|
By car=1, other mode
choice=0 |
Extracted by questionnaire |
Mode of transportation for
commuting trips |
|
|
- |
Extracted by
questionnaire/each respondent indicated the number of trips for last week |
Number of trips for
shopping or entertainment |
|
|
Outside=1, inside=2 |
Extracted by questionnaire |
Daily shopping area |
|
|
By car=1, other mode
choice=0 |
Extracted by questionnaire |
Mode choice for
shopping/entertainment inside the neighbourhood |
|
|
By car=1, other mode
choice=0 |
Extracted by questionnaire |
Mode choice for
shopping/entertainment outside the neighbourhood |
|
|
Almost never=0, rarely=0,
a few times per month=0, a few times per week=1, every day=1 |
Extracted by questionnaire |
Frequency of public
transport use |
|
|
No=0, yes=1 |
Extracted by questionnaire |
Sense of belonging to the neighbourhood |
|
|
No=0, yes=1 |
Extracted by questionnaire |
Attractiveness of shops |
|
|
Far away=1, inside my neighbourhood=2 |
Extracted by questionnaire |
Entertainment place |
|
|
Not
attractive=0, little attractive=0, acceptably attractive=1, medium=0, very
attractive=1 |
Extracted by questionnaire |
Quality of
social/recreational facilities |
|
|
The house was affordable
to buy=1, the house was near my work=0, the surrounding environment is
attractive=1, the house will have higher price=1, to be near my relatives=1,
l live here since was born=1 |
Extracted by questionnaire |
Residential location
choice |
|
|
- |
Extracted by questionnaire |
Length of time living in
the current home |
|
|
- |
Measured by Shannon
entropy/Cracow divided to 4256 grids in GIS, then computed by employing zonal
extension and spatial analysis tools, home points joined to grids based on
common spatial location to get their amount of disaggregated Shannon entropy |
Urban sprawl around home |
|
|
- |
For each respondent who
indicated home place, the 600-metre catchment area calculated according to
the street network, thereafter the area of buildings divided by the area of
the catchment area and then one divided by the amount of BCR in each
catchment area. |
Inversed Building Coverage
Ratio (BCR) around the home (%) |
|
|
- |
Measured by Shannon
entropy/Cracow divided to 4256 grids in GIS, then computed by employing zonal
extension and spatial analysis tools, university points joined to grids based
on common spatial location to get their amount of disaggregated Shannon entropy |
Urban sprawl around
university |
|
|
- |
For each respondent who
indicated university place, the 600-metre catchment area calculated according
to the street network, thereafter the area of buildings divided by the area
of the catchment area and then one divided by the amount of BCR in each
catchment area |
Inversed Building Coverage
Ratio (BCR) around the university (%) |
|
3.3. Case study
Cracow is located in the south of Poland on the
Vistula River, the largest river in Poland. The city has 372 km² areas
with its suburban areas and is populated by nearly one million inhabitants by
considering suburban population. Cracow is the second-largest city and one of
the oldest cities in Poland. In 2016, Cracow was populated by 765,300
inhabitants (Female= 53%, Male=47%) [38]. It was considered
as an urban centre from the 9th century. Furthermore, Cracow is one of the
biggest academic centres in Poland with almost 160,000 students. There are 21
higher education institutions (Public=10, Non-public= 11) in the city, among
whom the students of public universities constitute the vast majority (86%)
[48]. Among the public universities, the majority of students study at
Jagiellonian University, while Andrzej Frycz Modrzewski Cracow University has
the biggest share among non-public universities. The highest number of variety
was related to the students of technical universities, specifically about 28%.
The universities have been of significant impact on the potential of Cracow as
a scientific, cultural, economic, and political centre since 1985 [34]. After 1989, Cracow
faced a series of transformations. The modern economic and political system
increased the processes of urbanisation in the city, especially when Poland
joined the European Union in 2004. Extension of the urban area in Cracow
happened in the 20th century when Cracow was extended five times [38]. The rapid
development in Cracow is a result of government policies on the construction of
housing estates. The first spatial development took place in 1945 and the
second important extension happened in 1973 in all directions [50]. Political
transformation from socialism to post-socialism could affect Cracow in four
aspects such as centralisation to decentralisation, industrialisation to
deindustrialisation, underrated to acclaimed city, and the inclusion of large
outside areas to city versus suburbanisation. The development of public transportation
network, improvement of urban facilities, as well as lower price of land in the
outskirts, resulted in extending peripheral areas in Cracow [38]. Ziobro (2019)
referred to urban sprawl in Cracow, especially towards the north. In the
northern part of the city, spatial structure transformed from villages into a
pre-urban structure with scattered pattern and residential land driven by
shortcoming urban planning system and uneven development [50].
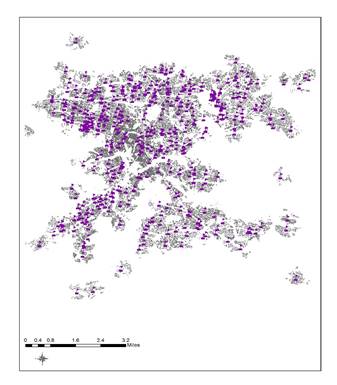
Fig. 1. The distribution of homes in
Cracow
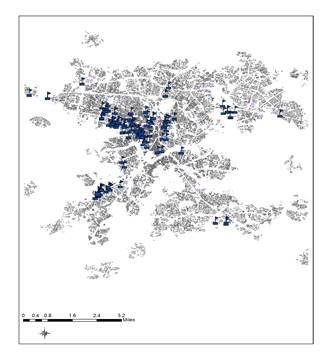
Fig. 2. The distribution of
university facilities in Cracow
3.3. Case study
Cracow is located in the south of Poland on the
Vistula River, the largest river in Poland. The city has 372 km² areas
with its suburban areas and is populated by nearly one million inhabitants by
considering suburban population. Cracow is the second-largest city and one of
the oldest cities in Poland. In 2016, Cracow was populated by 765,300
inhabitants (Female= 53%, Male=47%) [38]. It was considered
as an urban centre from the 9th century. Furthermore, Cracow is one of the
biggest academic centres in Poland with almost 160,000 students. There are 21
higher education institutions (Public=10, Non-public= 11) in the city, among
whom the students of public universities constitute the vast majority (86%) [48].
Among the public universities, the majority of students study at Jagiellonian
University, while Andrzej Frycz Modrzewski Cracow University has the biggest
share among non-public universities. The highest number of variety was related
to the students of technical universities, specifically about 28%. The
universities have been of significant impact on the potential of Cracow as a
scientific, cultural, economic, and political centre since 1985 [34]. After 1989, Cracow
faced a series of transformations. The modern economic and political system
increased the processes of urbanisation in the city, especially when Poland
joined the European Union in 2004. Extension of the urban area in Cracow
happened in the 20th century when Cracow was extended five times [38]. The rapid development
in Cracow is a result of government policies on the construction of housing
estates. The first spatial development took place in 1945 and the second
important extension happened in 1973 in all directions [50]. Political
transformation from socialism to post-socialism could affect Cracow in four
aspects such as centralisation to decentralisation, industrialisation to
deindustrialisation, underrated to acclaimed city, and the inclusion of large
outside areas to city versus suburbanisation. The development of public
transportation network, improvement of urban facilities, as well as lower price
of land in the outskirts, resulted in extending peripheral areas in Cracow [38]. Ziobro (2019)
referred to urban sprawl in Cracow, especially towards the north. In the
northern part of the city, spatial structure transformed from villages into a
pre-urban structure with scattered pattern and residential land driven by
shortcoming urban planning system and uneven development [50].
3.4. Analysis method
The correlation of urban sprawl and 20 socioeconomics,
travel patterns, and urban form variables were modelled by Weighted Least
Squares (WLS) regression modelling method in IBM SPSS version 22. Urban sprawl
was measured using Shannon entropy. By considering the definition of urban
sprawl, there are a lot of challenges regarding the methods for measuring urban
sprawl in the literature [1, 13, 22, 23, 33]. Bhatta et al.
(2010) argued different methods for measuring urban sprawl and indicated that
the Shannon entropy is the most reliable metric for measuring urban sprawl [1].
Yeh and Li (2001)
discussed that Shannon entropy can measure the density of land development in a
set of buffer zones that were drawn around the city centre. The value of
entropy is always between 0 and![]() and calculated by the following equation:
and calculated by the following equation:
![]() (1)
(1)
where ![]() represents the
proportion of urban area that is located in the
represents the
proportion of urban area that is located in the ![]() zone (
zone (![]() n is the number of zones, and
n is the number of zones, and ![]() is the observed value
of the phenomenon in the
is the observed value
of the phenomenon in the ![]() zone [48]. If urban areas have
a compact form, the Shannon entropy will show fewer amounts. Large value of
entropy indicates urban sprawl. The amount of Shannon's entropy is represented
in percent for easy interpretation in the model.
zone [48]. If urban areas have
a compact form, the Shannon entropy will show fewer amounts. Large value of
entropy indicates urban sprawl. The amount of Shannon's entropy is represented
in percent for easy interpretation in the model.
To measure disaggregated Shannon entropy for around
each home and university place, the land use raster shapefile of Cracow was
divided into 4256 grids to cover the whole of the city, and Shannon entropy was
calculated by using Zonal extension and Spatial Analysis tools in GIS version
10.3. To model the correlation of urban sprawl with explanatory variables
presented in Tab. 1, the inverse of building coverage ratio (BCR) was counted
as a weighted variable in the WLS regression model with the confidence level of
95% and P-value of 0.05. The inverse of building coverage ratio was selected
because building coverage ratio and Shannon entropy are inversely related. In
addition, the WLS regression model was applied for the correlation of urban
sprawl around home and university with 20 explanatory variables separately.
The model for home was made by 14 explanatory
variables. Six variables were respectively eliminated based on the low level of
significance such as the quality of social/leisure facilities in the
neighbourhood, car ownership rate, residential location choice, entertainment
place, sense of belonging to the neighbourhoods, and main daily activity.
F-test was applied to validate the model. The results indicated a significant
and marginal correlation with urban sprawl around the home perceptively.
The university model followed the abovementioned
steps. In the model for urban sprawl around universities, 11 variables were
successively eliminated based on the low level of significance in the model,
while the number of trips for shopping or entertainment, frequency of public
transport use, quality of social/leisure facilities of the neighbourhoods,
attractiveness of shops, mode transport for shopping and leisure in outside
trips of the neighbourhoods, financial dependency status, length time for
living in the current home, gross income per month, mode choice for
shopping/leisure of inside trips, driving license, gender, main daily activity,
mode of transport for commuting, and daily shopping area were eliminated and
the model was rebuilt to obtain WLS model with the high level of confidence.
The constant was not included in both models irrespective of its statistical
significance.
After modelling urban sprawl with socioeconomic
explanatory variables, a descriptive comparison was made to study the
similarities and differences between socioeconomic, and travel pattern
determinants of urban sprawl in the world, especially in the context of
developed and emerging economies. This is a shortcoming in modelling urban
sprawl based on socioeconomic determinants and travel patterns in the
literature.
4. FINDINGS
4.1. Descriptive statistics
The samples included 1,288 validated questionnaires,
the participants aged 17-37, among whom 42.5% worked and studied at the same
time and only 28.7% were financially independent of their families or other
sources. The majority of these participants (84.1%) had driving licenses and
the car ownership rate was two or more cars. Tram or trains were the dominant
transport modes used by the respondents for commute trips. Furthermore, 57.7%
of respondents did their shopping and leisure activity inside their
neighbourhoods by walking, while 31.4% preferred to go shopping and entertainment
outside of the neighbourhoods. The most popular mode choice for outside
shopping and leisure trip was tram or train (used by 43.6% respondents). In
addition, the car had a share of 4.3, 10.5, and 17.9% in mode choice for
commuting, that is, shopping trips inside and outside the neighbourhoods,
respectively. The public transport was used by 70.9 and 21% of the respondents
every day and a few times per week, respectively, while 0.9% did not use public
transport.
The inverse of Building Coverage ratio (BCR) was
counted as the weighted variable, which was developed for those that indicated
the nearest intersection to their home. After pointing the home in Google map,
670 home pinpoints were validated from 1,288 questionnaires. The sample size
for validated university pinpoints is 685. Shannon entropy around the home has
a range from 0.01 to 0.32%. In addition, the minimum and maximum of Shannon
entropy around the university are 0.02 and 0.25% from compacted to sprawled
areas, respectively. Tab. 2 indicates the descriptive statistics for the
continuous variables of the samples.
Tab. 2
Descriptive statistics of the continuous variables
of the sample
|
Continuous variables |
N |
Minimum |
Maximum |
Mean |
Std. Deviation |
|
Age |
1288 |
17 |
37 |
22.83 |
27.305 |
|
Number of commute trips |
921 |
6 |
40 |
11.06 |
4.632 |
|
Number of trips for shopping or entertainment |
1238 |
0 |
40 |
6.00 |
5.716 |
|
Length of time living in the current home |
1288 |
0 |
28 |
5.87 |
7.480 |
|
Urban sprawl around home (%) |
664 |
0.01 |
.32 |
0.1506 |
0.0503 |
|
Urban sprawl around university (%) |
680 |
0.02 |
.26 |
0.1471 |
0.0518 |
|
Inverse of building
coverage ratio around home |
655 |
0.05 |
286.01 |
8.0634 |
22.4663 |
|
Inverse of building coverage ratio around university |
674 |
0 |
1.23 |
.0786 |
0.1812 |
Two Weighted Least Square (WLS) models were developed
for analysing the correlation of urban sprawl around home and university with
the same socioeconomic and travel behaviour variables. The results of these two
models are explained in the following sections and the feedbacks to
international literature are described in the discussion section.

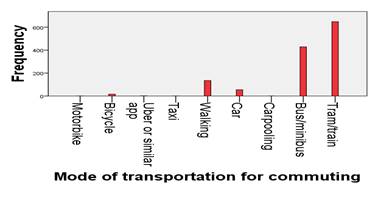
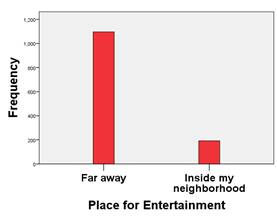
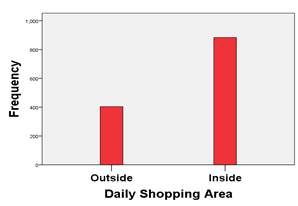
Fig. 3. Frequencies of some variables on the sample
4.2. The Weighted Least Square (WLS)
model for urban sprawl around the home
The variables including gender, age, driving license,
financial dependency status, gross income per month, the number of commute
trips per week, mode of transport in commute trips, the number of trips for
shopping or entertainment, the daily shopping area, the mode choice for
shopping and entertainment activities inside and outside of the neighbourhoods, the frequency of public
transport use, the attractiveness of shops inside of the neighbourhoods, and
the length time of living in the current home generated the explanatory
variables of WLS model after eliminating the variables (P> 0.10). As shown in
Tab. 3, the driving license is the weakest explanatory variable among the 14
variables, and the number of trips for shopping and entertainment and the
frequency of public transport use are marginally significant, in addition to
the driving license in the WLS model for urban sprawl around the home. The
number of commute trips is positively correlated with urban sprawl around the
home with the minimum P-value. In fact, the number of trips for commuting is
the most significant prediction power in the model. In other words, those who
have more commute trips per week are likely to live in sprawled areas. Daily
shopping area and mode choice of transport for shopping and entertainment trips
outside the neighbourhoods are negatively significant in the model. In fact,
the students who do daily shopping inside their neighbourhoods may live in
compacted neighbourhoods. Furthermore, those driving by car for shopping and
entertainment outside their neighbourhoods may live in the sprawled areas.
Tab. 3
WLS model for urban
sprawl around the home
|
|
B |
Std. Error |
Beta |
t |
P |
|
Gender |
0.018 |
0.007 |
0.2 |
|
.008 |
|
Age |
0.005 |
0.001 |
0.69 |
5.362 |
<0.001 |
|
Driving license |
0.015 |
0.009 |
0.084 |
1.632 |
.103 |
|
Financial
dependency status |
0.035 |
0.007 |
0.184 |
4.887 |
<0.001 |
|
Gross monthly
income |
0.02 |
0.007 |
0.088 |
2.8 |
.005 |
|
Number of commute
trips |
0.003 |
0.001 |
0.255 |
5.582 |
<0.001 |
|
Mode of
transportation for commuting |
-0.076 |
0.027 |
-0.058 |
-2.807 |
.005 |
|
Number of trips for
shopping or entertainment per week |
0.001 |
0.001 |
0.056 |
1.868 |
.062 |
|
Daily shopping area |
-0.038 |
0.007 |
-0.386 |
-5.559 |
<0.001 |
|
Mode choice for
shopping/entertainment trips inside neighbourhood |
0.079 |
0.013 |
0.161 |
6.182 |
<0.001 |
|
Mode choice for
shopping/entertainment trips outside neighbourhood |
-0.04 |
0.01 |
-0.121 |
-4.216 |
<0.001 |
|
Frequency of public
transport use |
-0.024 |
0.013 |
-0.144 |
-1.782 |
0.075 |
|
Attractiveness of
shops |
0.015 |
0.006 |
0.059 |
2.338 |
0.020 |
|
Length of time
living in the current home |
-0.001 |
0 |
-0.079 |
-2.238 |
0.026 |
|
Model Validation |
|||||
|
Model |
Sum of Squares |
df |
Mean Square |
F |
P |
|
Regression |
91.433 |
14 |
6.531 |
6.531 |
<0.001 |
|
Residual |
14.012 |
444 |
0.032 |
0.032 |
|
|
Total |
105.445 |
458 |
|
|
|
|
Modal Summery |
|
||||
|
R |
R Square |
Adjusted R Square |
Std. Error of the
Estimate |
|
|
|
1 |
0.931 |
0.867 |
0.863 |
0.17765 |
|
4.3. The Weighted Least Square (WLS)
model for urban sprawl around the university
Six highly significant variables including age, car
ownership, number of commute trips, sense of belonging to the neighbourhoods,
entertainment place, and residential location choice developed WLS model for
urban sprawl around universities (Tab. 4). The other variables were eliminated
based on the explanation in the analysis method section and there is no
variable with marginal significant in the model. Car ownership and age are the
most positively correlated variables. It can be formulated that urban sprawl
around the university is more likely correlated with the increase of car
ownership and age. In addition, the number of commute trips is negatively
correlated. In fact, the students may have fewer commute trips to the
universities if they are located in the sprawled areas.
Tab.
4
WLS model for urban
sprawl around the university
|
|
B |
Std. Error |
Beta |
t |
P |
|
Age |
0.003 |
0.001 |
0.512 |
3.451 |
<0.001 |
|
Car ownership |
0.076 |
0.023 |
0.532 |
3.276 |
<0.001 |
|
Number of commute
trips |
-0.001 |
0.000 |
-0.082 |
-2.639 |
0.009 |
|
Sense of belonging
to neighbourhood |
-0.013 |
0.004 |
-0.065 |
-3.167 |
0.002 |
|
Entertainment place |
0.014 |
0.006 |
0.112 |
2.217 |
0.027 |
|
Residential
location choice |
-0.014 |
0.005 |
-0.087 |
-3.013 |
0.003 |
|
Model Validation |
|||||
|
Model |
Sum of Squares |
df |
Mean Square |
F |
P |
|
Regression |
0.670 |
6 |
0.112 |
828.237 |
< 0.001 |
|
Residual |
0.064 |
473 |
0 |
|
|
|
Total |
0.734e |
479 |
|
|
|
|
Modal Summery |
|||||
|
R |
R Square |
Adjusted R Square |
Std. Error of the
Estimate |
|
|
|
1 |
.956a |
.913 |
.912 |
.01161 |
|
5. DISCUSSION
An increasing dispersed and segregated urban
development is considered as a serious problem worldwide. Urban sprawl has
substantial environmental, social, and economic consequences, which affects
natural resources, leading to higher infrastructure cost and an increase in
transport expenditure, lower social interaction, and more car dependency, and
ignorance of sustainable transport demand. Although, urban sprawl progresses
slower in European countries than the U.S., transforming from top-down system
to the liberal in East-Central Europe, which has created a lot of problems,
especially in the pattern of urban development. In addition to the economic and
governmental transformed systems in post-socialist countries, a change in
social structure, liberalisation, and more roles for women in societies have
influenced urbanisation. This study generated a model for understanding
socioeconomic determinants of urban sprawl in Cracow, as an example of a large
city in Poland. In fact, it aimed to determine the correlation of urban sprawl
around the home with 14 socioeconomic, travel patterns, and individual
perception, as well as six significant variables for urban sprawl around
universities. Urban sprawl for each participant was measured by Shannon
entropy, which indicated the nearest intersection to his or her home and
university. Thus, the disaggregated and weighted urban sprawl contributed to
the WLS model providing more accurate and reliable results. The findings
confirmed that urban sprawl is associated with socioeconomic features such as
age, gender, car ownership, gross income, and the financial dependency status
of university students in Cracow. Therefore, regarding the factors related to
urban sprawl, the comprehensive cultural, historical, geographical,
technological, political, and economic considerations are essential. Although
the results are in line with urban sprawl literature in some aspects, there is
a shortcoming in modelling urban sprawl based on various socioeconomic factors,
travel pattern, and urban form features at the city level. This study provides
a clear model to determine urban sprawl according to socioeconomic predictors
and travel pattern features in Cracow.
During recent decades, urban sprawl has attracted
researchers' attention. However, few studies were conducted for the
determinants of urban sprawl by focusing on the socioeconomic determinants of
urban sprawl at the macro level using aggregated national data. Furthermore,
most of the studies in urban sprawl were conducted at the country or
metropolitan level and less attention was given to its modelling, contextually.
For example, in the study related to urban sprawl in Europe, 15 demographic,
socioeconomic, geographical, and political variables at the country level
contributed to the regression model. Each variable affected three components of
urban sprawl according to the urban sprawl metric introduced by [22]. This
study investigated the effects of population density, ageing index, gross
domestic product per capita, employment rate, household size, car availability,
fuel price, road density, rail density, net primary productivity, relief
energy, irreclaimable area, fraction of coastal area, history of communism,
governmental effectiveness, and natural resource protection indicator on urban
sprawl index in European countries [9].
Based on the report of EEA, the higher ageing index is
related to lower urban sprawl among European countries, which are inconsistent
with the findings of this study. However, this index considered the ratio of
the 65-aged inhabitants and older to the number of 14-aged inhabitants and
younger. The present modelling represents that the older students are more
likely to live and study in sprawled neighbourhoods, although, this study was
done among university students with the maximum age of 37.
In addition, the results in urban sprawl around the university
confirmed the positive correlation between urban sprawl and car ownership.
Weilenmann et al. (2014) developed the ordinary least
squares regression model by applying cross-sectional data in municipal level of
Switzerland to quantify the attributes correlated with sprawl index which was
measured by [22]. The positive correlation between urban sprawl around homes
and gross income and age is consistent with the result obtained, which
indicated that higher-income people, outbound commuters, and elderly and
single-person household are positively associated with urban sprawl, while the
number of inhabitants, homeownership, and higher share of old building affected
the urban sprawl index in Switzerland negatively [47].
The results indicated a positive correlation between
urban sprawl and students’ gross monthly income in Cracow. By considering
the literature [3, 5], urban sprawl is significantly related to wealth. In
higher-income cities, people are more willing to live in detached houses with private
garden, and they can afford the cost of driving their own car. The results
confirm the positive relationship between income and urban sprawl in France
conducted by [36]. However, the findings contradict the negative correlation of
urban sprawl with the income in the study, which was conducted by [7].
Furthermore, the findings in Cracow indicate that
financially independent students and higher-income respondents are highly
significant predictors in urban sprawl around the home. Car ownership has a
positive correlation with urban sprawl around the university in Cracow. Thus,
the results of this study confirm those [26] who found that higher income,
number of trips to outside destinations, and car ownership are considered as
positive significant predicators for urban sprawl in China. Li et al. (2019)
generated a regression model and employed urban population density, gross
domestic product per capita (GDP), the percentage of the added value of the
secondary industry in GDP, and the percentage of the added value of the
tertiary industry in GDP as independent variables in the regression model to
find their relationship with urban sprawl metrics for 259 different size cities
in China based on national census during 2006-2014. The findings reported for
small cities demonstrated that the population density and industrial features
have less impact on urban sprawl than in larger cities. Thus, urban sprawl in
China differs depending on the region, urban size, and administrative hierarchy
[26]. This paper analysed socioeconomic features at the micro-level by
producing disaggregated data. Although, this study validated some determinants
such as higher-income, outbound trips (shopping and social trips to outside the
neighbourhoods), or car ownership rates, which confirms their correlation with
urban sprawl such as the abovementioned studies, the level, variables, and
method of analysis are different.
Automobile dependence is considered as one of the
characteristics of urban sprawl [18]. They validated the sprawl and its component
factors against sustainable transportation mode in large urban areas in the
United States, which is consistent with the results of this study in Cracow.
Thus, urban sprawl around the home is more dependent on driving by car for
commuting as well as shopping and entertainment in far destination trips.
Furthermore, the result on the frequency of public transport use is in line
with that of Guerra et al. (2018), which found that commuters are less likely
to drive in compacted neighbourhoods than sprawled and more likely to use
public transport in their commute trips [16]. An increase in the probability of
public transport use is strongly correlated with urban sprawl around the home
in Cracow.
5.1.
Implications for urban planning in Poland
The findings in this study have substantial urban
policy implications for Cracow as an example of a Polish socialist city. As
shown, urban sprawl in Cracow is significantly correlated with a range of
socioeconomic indicators and travel patterns. To tackle the disadvantages of
urban sprawl and formulate effective preventive policies, decision-makers
should consider effective determinants of urban sprawl. The results revealed
the strong and weak predictors of urban sprawl. Therefore, sprawl can be
controlled by effective urban planning policies in Cracow. Mixed land use of
urban forms is regarded as an important factor in addressing the negative
points of urban sprawl. Urban sprawl around the home in Cracow has a
significant correlation with the attractiveness of shops and daily shopping
area. Thus, mixed-use neighbourhoods with social and entertainment facilities
are more compacted compared to those without efficient amenities. More so, it
represents the quality of the urban environment as an important factor to limit
urban sprawl in Cracow and the way of designing urban structures influences
urban sprawl in Cracow. Investing in efficient and high-quality public
transport system and designing an urban environment for fostering more walking
and biking are considered as other urban policies to control car-dependent
urban structures and sprawling. Based on the results, car ownership is an
important predictor in commuting and non-commuting trips by university students
in Cracow.
This study focused on determining socioeconomic features
such as gender, age, financial dependency status, gross income, driving license
and their correlations with urban sprawl. Hence, providing a clear
understanding of the inhabitants’ needs and behaviours is helpful for
addressing urban sprawl and planning sustainable urban land use. Furthermore,
contextual evaluation of urban sprawl creates a deeper understanding of its
determinants irrespective of the different economic and planning systems.
Finally, considering different planning systems, along with cultural, social,
historical, and economic conditions in the setting for controlling urban sprawl
can provide efficient tools.
6. CONCLUSION
The results of this paper shed light on the urban
sprawl and its socioeconomic determinants in a post-socialist city and may be
used in sustainable urban planning, which can tackle negative aspects of urban
sprawl in cities. In addition, an increase in age, driving license, gross
monthly income, number of commute trips, and number of trips for shopping or
entertainment was correlated with the probability of increasing urban sprawl
around Cracow university students’ home places. However, the length of
living in the current home had a negative correlation with urban sprawl around
the home. Furthermore, the results indicated that students in the sprawled
neighbourhoods use the automobile as a dominant mode for commuting, shopping or
leisure trips to far destinations, as well as prefer to do daily shopping
outside the neighbourhoods. In terms of university students in Cracow, the
probability of living in sprawling neighbourhoods is higher for women than men.
Urban sprawl around the university was significantly correlated with age,
number of commute trips, car ownership, entertainment place, sense of belonging
to the neighbourhoods, and residential location choice. Additionally, an
increase in age and car ownership led to an increase in urban sprawl around the
university and the students who selected to live near the university resided in
compact neighbourhoods rather than sprawled areas.
Although the socioeconomic features of the respondents
were considered, they were limited for the university students. In fact, they
failed to represent a large variation in some variables such as age, gross
income, and main activity. In addition, students may financially rely on their
families and live alone. Thus, some variables like house ownership or household
size are not related to our sample. Hence, we are limited in some variables,
which seem more logical.
Future studies can be conducted to evaluate
socioeconomic factors and travel patterns, as well as urban form determinants
of urban sprawl, contextually, according to various circumstances in developed,
developing, and emerging countries to compare the results to get a better
understanding of urban sprawl in the different parts of the world. Although the
literature on urban sprawl is strong, these studies were limited to aggregated
data by applying national statistics and limited variables. Moreover, few
studies were conducted on modelling urban sprawl based on socioeconomic, travel
behaviour, and urban form predictors. In addition to the descriptive findings
in the geographic context, it is necessary to conduct more studies on the
post-socialist cities to obtain the general modelling of urban sprawl in
post-socialist cities. This is so as modelling urban sprawl based on reliable
predictors and considering economic and geographic context can provide a clear
framework for the urban planners and decision-makers to prevent negative
impacts of urban sprawl on natural resources, economic systems, and social
life. Finally, this study focused on a large city as a case study, although,
urban sprawl and its determinants may happen in smaller cities in less-studied
contexts. Thus, other studies for comparing urban sprawl and its determinants
in different city sizes can improve the weaknesses of literature on urban
sprawl.
Acknowledgement
The cooperation between researchers of this study was
funded by the German Academic Exchange Service (DAAD). Grant number:
DAAD-Personenkennziffer: 91722843 to the second co-author for guest-lecturing
at Cracow University of Technology (15.10.2018-15.04.2019).
References
1.
Bhatta B., S.
Saraswati, D. Bandyopadhyay. 2010. “Urban sprawl measurement from remote
sensing data”. Applied Geography
30: 731-740.
2.
Bartosiewicz
Bartosz, Iwona Pielesiak. 2019.
“Spatial patterns of travel behaviour in Poland”. Travel Behaviour and Society 15:
113-122. DOI: https://doi.org/10.1016/j.tbs.2019.01.004.
3.
Bruegmann Robert.
2006. Sprawl: a compact history.
Chicago, USA: University of Chicago Press.
4.
Burchell Robert
W., Catherine C. Galley. 2003. “Projecting incidence and costs of sprawl
in the United States”. Transportation
Research Record 1831(1): 150-157. DOI: https://doi.org/10.3141/1831-17.
5.
Couch Chris, Lila
Leontidou, Gerhard Petschel-Held. 2007. Urban
sprawl in Europe. Landscapes, land-use change & policy. Real estate issues.
Blackwell, Oxford, Malden MA.
6.
Czepkiewicz
Michał, Juudit Ottelin, Sanna Ala-Mantila, Jukka Heinonen, Kamyar
Hasanzadeh, Marketta Kyttä. 2018. “Urban
structural and socioeconomic effects on local, national and international
travel patterns and greenhouse gas emissions of young adults”. Journal of Transport Geography 68:
130-141. DOI: https://doi.org/10.1016/j.jtrangeo.2018.02.008.
7.
DeSalvo Joseph S.,
Qing Su. 2017. “Determinants of urban
sprawl: a panel data approach”. International
Journal of Regional Development 4(2): 26-41.
8.
Du Jinfeng,
Jean-Claude Thill, Richard B. Peiser, Changchun Feng. 2014. “Urban land
market and land-use changes in post-reform China: a case study of
Beijing”. Landscape and Urban
Planning 124: 118-128. DOI:
https://doi.org/10.1016/j.landurbplan.2014.01.012.
9.
European
Environment Agency. 2006. EEA environmental statement 2006.
10. Ewing Reid. 1997. “Is Los Angeles-Style Sprawl
Desirable?”. Journal of the
American Planning Association 63(1): 107-126. DOI:
https://doi.org/10.1080/01944369708975728.
11. Ewing Reid, Robert Cervero. 2010. “Travel and
the Built Environment”. Journal of
the American Planning Association 76(3): 265-294. DOI:
https://doi.org/10.1080/01944361003766766.
12. Ewing Reid, Shima Hamidi, James B. Grace, Yehua D.
Wei. 2016. “Does urban sprawl hold down upward mobility?”. Landscape and Urban Planning 148: 80-88.
DOI: https://doi.org/10.1016/j.landurbplan.2015.11.012.
13. Amnon Frenkel. 2004. “The potential effect of
national growth-management policy on urban sprawl and the depletion of open
spaces and farmland”. Land Use
Policy 21(4): 357-369. DOI:
https://doi.org/10.1016/j.landusepol.2003.12.001.
14. Galster George, Royce Hanson, Michael R. Ratcliffe,
Harold Wolman, Stephen Coleman, Jason Freihage. 2001. “Wrestling sprawl
to the ground: defining and measuring an elusive concept”. Housing Policy Debate 12(4): 681-717.
DOI: https://doi.org/10.1080/10511482.2001.9521426.
15. García-Palomares Juan C. 2010. “Urban
sprawl and travel to work: the case of the metropolitan area of Madrid”. Journal of Transport Geography 18(2):
197-213. DOI: https://doi.org/10.1016/j.jtrangeo.2009.05.012.
16. Guerra Erick, Camilo Caudillo, Paavo Monkkonen, and
Jorge Montejano. 2018. “Urban form, transit supply, and travel behavior
in Latin America: Evidence from Mexico's 100 largest urban areas”.
Transport Policy 69, 98–105. DOI:
https://doi.org/10.1016/j.tranpol.2018.06.001.
17. Guimpert Ignacio, Ricardo Hurtubia. 2018.
“Measuring, understanding and modelling the Walking Neighborhood as a
function of built environment and socioeconomic variables”. Journal of Transport Geography 71:
32-44. DOI: https://doi.org/10.1016/j.jtrangeo.2018.07.001.
18. Hamidi Shima, Reid Ewing. 2014. “A longitudinal
study of changes in urban sprawl between 2000 and 2010 in the United
States”. Landscape and Urban
Planning 128: 72-82. DOI: https://doi.org/10.1016/j.landurbplan.2014.04.021.
19. Handy Susan, Xinyu Cao, and Patricia Mokhtarian. 2005.
“Correlation or causality between the built environment and travel
behavior? Evidence from Northern California”. Transportation Research Part D: Transport and Environment 10(6):
427-444. DOI: https://doi.org/10.1016/j.trd.2005.05.002.
20. Hareshkumar Dahyabhai Golakiya, Ritvik Chauhan, Ashish
Dhamaniya. 2020. “Evaluating safe distance for pedestrians on urban
midblock sections using trajectory plots”. European Transport \ Trasporti
Europei. Issue 75. Paper no 4. ISSN 1825- 3997.
21. Hirt Sonia. 2013. “Whatever happened to the
(post)socialist city?”. Cities
32: 29-38. DOI: https://doi.org/10.1016/j.cities.2013.04.010.
22. Jaeger Jochen A.G., René Bertiller, Christian
Schwick, Felix Kienast. 2010. “Suitability criteria for measures of urban
sprawl”. Ecological Indicators
10(2): 397-406. DOI: https://doi.org/10.1016/j.ecolind.2009.07.007.
23. Jaeger Jochen A.G., Christian Schwick. 2014.
“Improving the measurement of urban sprawl: Weighted Urban Proliferation
(WUP) and its application to Switzerland”. Ecological Indicators 38: 294-308. DOI:
https://doi.org/10.1016/j.ecolind.2013.11.022.
24. Jing Ma, Gordon Mitchell, and Alison Heppenstall.
2014. “Daily travel behaviour in Beijing, China: an analysis of workers'
trip chains, and the role of socio-demographics and urban form”. Habitat International 43: 263-273.
25. Kotus Jacek. 2006. “Changes in the spatial
structure of a large Polish city – the case of Poznań”. Cities 23(5): 364-381. DOI:
https://doi.org/10.1016/j.cities.2006.02.002.
26. Li Guangdong, Feng Li. 2019. “Urban sprawl in
China: differences and socioeconomic drivers”. The Science of the Total Environment 673: 367-377. DOI:
https://doi.org/10.1016/j.scitotenv.2019.04.080.
27. Lisowski Andrzej, Dorota Mantey, Waldemar Wilk. 2014.
“Lessons from Warsaw”. Confronting
suburbanization. Urban decentralization in postsocialist Central and Eastern
Europe: 225-255. Kiril Stanilov, Ludek Sykora (Eds.). Malden, MA:
Wiley-Blackwell. DOI: https://doi.org/10.1002/9781118295861.ch8.
28. Mantey Dorota. 2017. “Social consequences of
gated communities: the case of suburban Warsaw”. The Professional Geographer 69(1): 151-161. DOI:
https://doi.org/10.1080/00330124.2016.1184986.
29. Mantey Dorota, Paweł Sudra. 2019. “Types of
suburbs in post-socialist Poland and their potential for creating public
spaces”. Cities 88: 209-221.
DOI: https://doi.org/10.1016/j.cities.2018.11.001.
30. Marmolejo-Duarte Carlos, Jorge Cerda-Troncoso. 2019. “Metropolitan Barcelona 2001-2006, or how
people’s spatial – temporal behaviour shapes urban
structures”. Regional Studies
105(5): 1-13. DOI: https://doi.org/10.1080/00343404.2019.1583326.
31. Mihai Bogdan, Constantin Nistor, Gabriel Simion. 2015.
“Post-socialist urban growth of Bucharest, Romania – a change
detection analysis on Landsat imagery (1984-2010)”. Acta Geographica Slovenica 55(2). DOI:
https://doi.org/10.3986/AGS.709.
32. Mouratidis Kostas, Dick Ettema, Petter Næss. 2019. “Urban form, travel behavior, and travel
satisfaction”. Transportation
Research Part A: Policy and Practice 129: 306-320. DOI:
https://doi.org/10.1016/j.tra.2019.09.002.
33. Nazarnia Naghmeh, Christopher Harding, Jochen A.G.
Jaeger. 2019. “How suitable is entropy as a measure of urban sprawl?”.
Landscape and Urban Planning 184:
32-43. DOI: https://doi.org/10.1016/j.landurbplan.2018.09.025.
34. Niedźwiedź Anna. 2009. “Mythical
vision of the city: Cracow as the ‘Pope’s City’ ”. Anthropology of East Europe Review
27(2): 208-226.
35. Nuissl Henning, Dieter Rink. 2005. “The
‘production’ of urban sprawl in eastern Germany as a phenomenon of
post-socialist transformation”. Cities
22(2): 123-134. DOI: https://doi.org/10.1016/j.cities.2005.01.002.
36. Pirotte Alain, Jean-Loup Madre. 2011.
“Determinants of urban sprawl in France”. Urban Studies 48(13): 2865-2886. DOI:
https://doi.org/10.1177/0042098010391303.
37. Pritikana Das, Mukti Advani, P. Parida, M. Parida,
S.P. Singh. 2019. “Development of Landuse based Pedestrian Level of
Service in Indian Context”. European Transport \ Trasporti Europei. Issue
74. Paper no 2. ISSN 1825- 3997.
38. Romańczyk Katarzyna M. 2018. “Krakow
– The city profile revisited”. Cities
73: 138-150. DOI: https://doi.org/10.1016/j.cities.2017.09.011.
39. Schmidt Marie, Stefan Voss. 2017. „Advanced
systems in public transport”. Public
Transport 9(1-2) Special Issue: 3-6.
40. Smart Dumba. 2017. “Informal public transport
driver behaviour and regulatory policy linkage: An expose”. Journal of Transport and Supply Chain
Management 11(a315). DOI: https://doi.org/10.4102/jtscm.v11i0.315.
41. Solecka Iga, Marta Sylla, Małgorzata Świąder. 2017. “Urban sprawl impact on farmland
conversion in suburban area of Wroclaw, Poland”. IOP Conf. Ser.: Mater. Sci. Eng. 245(72002). DOI:
https://doi.org/10.1088/1757-899X/245/7/072002.
42. Sýkora Luděk. 2015. “Cities Under
Postsocialism”. International
Encyclopedia of the Social & Behavioral Sciences: 605-611. Elsevier.
DOI: https://doi.org/10.1016/B978-0-08-097086-8.74030-X.
43. Tiziana Campisi, Antonino Canale, Giovanni Tesoriere.
2019. “The development of walkability in the historic centre of Enna: the
case of Saint Tommaso neighbourhood”. European Transport \ Trasporti
Europei. Issue 75. Paper no 4. ISSN 1825- 3997.
44. Travisi Chiara M., Roberto Camagni, and Peter Nijkamp. 2010. “Impacts of urban sprawl and commuting: a
modelling study for Italy”. Journal
of Transport Geography 18(3): 382-392. DOI:
https://doi.org/10.1016/j.jtrangeo.2009.08.008.
45. Tsai Yu-Hsin. 2005. “Quantifying urban form:
compactness versus 'sprawl' ”. Urban
Studies 42(1): 141-161. DOI: https://doi.org/10.1080/0042098042000309748.
46. Weilenmann Barbara, Tobias Schulz. 2014.
“Socio-economic explanation of urban sprawl: evidence from Switzerland
1970-2000”. 54th ERSA Congress.
St. Petersburg.
47. Wen Ming, Namratha R. Kandula, Diane S. Lauderdale.
2007. “Walking for transportation or leisure: what difference does the
neighborhood make?”. Journal Of
General Internal Medicine 22(12): 1674-1680. DOI:
https://doi.org/10.1007/s11606-007-0400-4.
48. Yeh Anthony Gar-On, Xia Li. 2001. “Measurement
and monitoring of urban sprawl in a rapidly growing region using
entropy”. Photogrammetric
Engineering and Remote Sensing 67: 83-90. ISSN: 0099-1112.
49. Zhao Pengjun. 2010. “Sustainable urban expansion
and transportation in a growing megacity: consequences of urban sprawl for
mobility on the urban fringe of Beijing”. Habitat International 34(2): 236-243. DOI:
https://doi.org/10.1016/j.habitatint.2009.09.008.
50. Ziobro Anna. 2019. “Urban sprawl in the context
of Cracow city limit”. IOP Conf.
Ser.: Mater. Sci. Eng. 471(112036). DOI:
https://doi.org/10.1088/1757-899X/471/11/112036.
Received 29.02.2020; accepted in revised form 27.05.2020
![]()
Scientific
Journal of Silesian University of Technology. Series Transport is licensed
under a Creative Commons Attribution 4.0 International License