Article
citation information:
Izdebski, M., Jacyna-Gołda,
I., Gołębiowski, P., Gołda, P., Pyza, D., Żak, J. Decision problems in
designing database architecture for the assessment of logistics services. Scientific Journal of Silesian University of
Technology. Series Transport. 2020, 108,
53-71. ISSN: 0209-3324. DOI: https://doi.org/10.20858/sjsutst.2020.108.6.
Mariusz IZDEBSKI[1],
Ilona JACYNA-GOŁDA[2],
Piotr GOŁĘBIOWSKI[3],
Paweł GOŁDA[4],
Dariusz PYZA[5],
Jolanta ŻAK[6]
DECISION
PROBLEMS IN DESIGNING DATABASE ARCHITECTURE FOR THE ASSESSMENT OF LOGISTICS
SERVICES
Summary. This paper presents decision problems which occur in
designing database architecture for the assessment of logistics services. In
the work, it was emphasized that the key stages in database design is to define
a database model comprising a set of rules that characterize the structure of
data in the database and a list of operations that can be performed on the data
entered into the database. Research presented in the article is conducted as part
of the project on the European Portal of Logistics Services (EPLOS) implemented
on the basis of an agreement with the National Center for Research and
Development under the EUREKA program. As part of the research carried out as
part of the project, the principles of functioning of distributed architecture
were developed and evaluated for the services offered by carriers or logistics
operators operating on the international market. These include operators
providing air services, international road, intermodal, sea transports, etc.
The article indicates that the purpose of the database responsible for
processing information in cargo intermodal connections is not only to collect
input data on aviation and road infrastructure, but also to save the results generated
by computational modules. At work, the modular database structure for assessing
logistics services consisting of among others from dynamic data module, archive
module, data entry module, optimization algorithm calibration module was
proposed. Catalog structure and rules for supplying the database with data on
the example of a railway operator were presented in detail.
Keywords: database architecture, logistics services, the
European Portal of Logistics Services
1. INTRODUCTION
Research presented in this article was
conducted as part of the project on the European Portal of Logistics Services
(EPLOS) implemented based an agreement with the National Center for Research
and Development under the EUREKA program. On the air services market, the
growing importance of logistics operators in cargo transport can be noticed in
both domestic and international relations. The choice of a logistics operator
to implement specific logistics services is quite a difficult and complex
decision problem. This is primarily due to the need to consider many factors
posed by buyers of cargo logistics services on the one hand, and on the other
hand, the capabilities of logistics operators [3-6, 13, 16, 17].
The use of appropriate tools supporting the decision
of logistic service buyers in this area reduces the costs of providing the
service and increases the satisfaction of customers reporting the demand for
logistics services [21, 22]. Systems
supporting decision making in logistics and transport issues are one of such
systems. These issues relate to various areas of operation of logistics
operators, carriers [15, 16, 24], storage processes [18], selection of the location of warehouse facilities [1, 17, 19] and intermodal transport terminals [30].
Databases are a basic element in the design of complex
information systems, which take into account the large amount of information
processed [32]. Information processing in
the database is possible due to the database management system, which is based
on defining specific IT procedures [2, 4].
Designing database architecture for the logistics
services market is a big challenge for all participants in the process,
including logistics service operators, transport organisers, etc. According to
the first works 9, the database is a collection
of record information that can be placed in appropriate tables adequate to
write matrix tables in information systems. The tables have an appropriate
function assigned to specific, specific thematic issues, for example, technical
or economic parameters of a given process or elements of equipment of the
examined system. Importantly, the information in databases is collected
according to strictly defined rules and then processed by algorithms and
database management systems [20, 30].
As numerous studies in this area indicate, database
design usually proceeds according to several stages, considering [11, 14]:
-
defining the purpose of creating (designing) the
database – stage I,
-
choice of query language – stage II,
-
selection of system catalogue capacity – stage
III,
-
defining transaction algorithms – stage IV,
-
defining database recovery algorithms – stage V,
-
defining systems controlling access to databases
– stage VI,
-
defining data transmission tools – stage VII.
The process of creating databases requires knowledge
of many rules and relational rules between various elements (directories) of
data. Therefore, when designing database architecture for the assessment of
logistics services implemented on the international market, one should
consider:
-
IT aspect – creating database architecture as an
IT system,
-
subjective aspect – data resources – types
of data catalogues that are necessary for system users.
In terms of the first issue, it is necessary to define
a database model including a set of rules that characterise the structure of
data in the database and a list of operations that can be performed on the data
entered into the database. The database model is often presented in graphic
form. From an IT point of view, the data management system that is entered into
the database, for example, operations of adding, editing, modification, etc. is
important.
In the aforementioned stages of database design, it is
important to develop appropriate algorithms and methods to maintain the
correctness of the database, that is, a set of rules that allow not only the
consistency and correctness of data and database, as well as their efficiency
to be maintained.
The logistics services market concerns a wide spectrum
of services and includes many participants who take part in the implementation
of services at various levels of their implementation. For example, for the
design of warehouse facilities, a range of input data from various thematic
areas is necessary [14].
1. THE
ESSENCE OF DATABASE DESIGN IN LITERATURE
As previously mentioned, the most convenient tool for
collecting and processing large amounts of data are databases. Different
database models are used, defined as sets of rules or principles characterising
the structure of collected data and allowed operations performed on them.
It follows, therefore that each database model has its
characteristics. Some of them may be of advantage when it comes to the work of
systems for assessing logistics services implemented on an international
market, while some may be serious obstacles to their use. The important element
for each model is the base diagram.
There are many database models in the literature on
the problem. Typical types include [2, 7,
9, 12, 19, 21]:
– a hierarchical data
model in which data is arranged in a tree structure ordered from the general
(for example, data on means of transport) to the detail (for example, data on
components of means of transport),
– relational data
model, in which the connections between data in the database are mathematical
relations (for example, means of rail transport remain in relation to warehouse
trucks),
– network (graph)
data model, which was created based on a hierarchical model - an important
modification is that the possibility of creating many (∞) to many
(∞) relationships have been introduced,
– the object-oriented
data model that was developed as a combination of relational database concepts,
object-oriented programming languages and object-oriented paradigms,
– a data model in the
form of a semantic network, which can be presented as a set of objects related
to each other by relationships (for example, means of external transport is a
type of means of transport).
In the case of a relational model, the data is stored
in the form of tables that are connected by mathematical relations. This allows
one to consider all possible relationships between individual elements.
Furthermore, access to data is quick and there is no need to know the structure
of the database to find specific information
[7].
In the hierarchical model, access to data is difficult
due to the tree structure. To get to a particular data one should look for it
from the general to the detailed. As a result, the access time to data is
extended, and there is a need to know the structure of the database. In the
network model, however, only many-to-many relationships are allowed.
The efficiency of processing large amounts of data
depends on the implemented database management system. In the literature on the
problem, the Database Management System (DBMS) is defined as a program that
allows access and performs operations on data through the use of appropriate
search and compilation mechanisms [19, 20]. The management
system controls the physical structure of the data, determining how to access
the data, determining how to update the data, creating and deleting it. The
implementation of the system is necessary for it to function properly.
Database management systems can act as a
"client-server", that is, an architecture in which the role of the
client application and server application is clearly separated. In such cases,
the database management system acts as a server application, that is, the
database must be simultaneously shared among many users [7] This architecture can be used to separate
applications such as IBM DB2, Informix Dynamic Server, Firebird, MariaDB,
Microsoft SQL Server, MySQL, Oracle Database and PostgreSQL. In case the
database does not have to be shared between several users at the same time,
applications that do not require client-server architecture are used. These
applications are Microsoft Access and Kexi.
The method and principles of performing tasks in a
given system forced the use of an appropriate client-server architecture among
which we can distinguish a two-layer architecture, whose main task is to limit
the amount of data sent through the network. It comes down to the fact that the
system has been divided into two parts. The first is responsible for maintaining
data consistency and storage. The second is responsible for downloading,
displaying and processing data that is sent to the server to remember or
generates queries to obtain information. Two interpretative forms of the
"thin and fat client" are shown in Fig. 1.
The use of two-layer architecture, despite its
flexibility, is not applicable to large systems due to a large number of
functions that the application must perform using multiple server "data
sources". The solution to this problem resulted in the creation of the
concept of three-layer architecture, particularly the third layer, independent
of the application and server, however, responsible for information processing
as shown in Fig. 2.
Decision-making problems in developing databases occur
at the stage of constructing the database management system and at the stage of
integration of the entire user application with the developed database.
Development of the Database Management System (DBMS) is one of the main
problems that occur in the construction of databases. The database management
system is an organised set of tools enabling the definition of a database as
well as downloading and modifying data contained in it. This management system
is a universal software that has an interface with a user application and a
database.
Fig. 1.
Two-layer architecture imaging "thin fat client”
Fig. 2.
Imaging three-layer architecture
The basis of operation of each IT system [24] is the exchange of data both between individual
program modules and between the program and the user. The number of exchanged
data and the number of operations that must be performed on the data
necessitates the use of professional tools to collect and perform operations on
many types of data.
A typical IT system diagram is shown in Fig. 3.
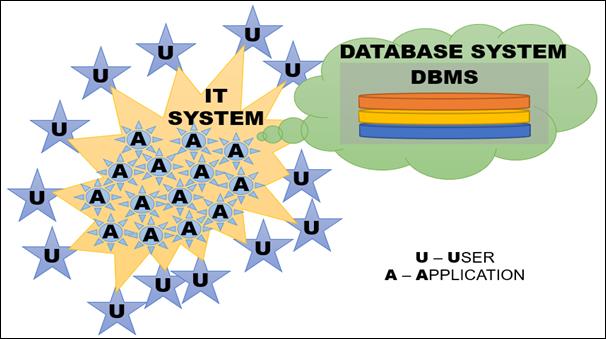
Fig.
3. Typical IT system diagram
In Fig. 3, easily notable is a database system that
consists of a database and a database management system (DBMS). As mentioned
above, a database is an instrument on which data describing reality are stored
according to strictly defined rules [5]. The DBMS is
responsible for the proper storage and collection of data. Therefore, it allows [11]: data administration, ensuring data integrity and
security, disaster recovery, access to collections of many users at a given
moment, granting access rights to particular types of users and optimisation of
the database work.
2. THE
CONCEPT OF DATABASE ARCHITECTURE FOR THE EPLOS SYSTEM
As part of the research carried out as part of the
project on the European Portal of Logistics Services, the principles of
functioning of distributed architecture were developed and evaluated for the
services offered by carriers or logistics operators operating on the
international market. These include operators providing air services,
international road, intermodal, sea transports, etc. We know that the purpose
of the database responsible for processing information in cargo transport using
intermodal connections is partly to collect input data on aviation and road
infrastructure and also to save generated results by calculation modules. In
general, three types of data can be distinguished: static data obtained from
the description of the characteristics of individual participants in the entire
process, dynamic data resulting from the work of modules and additional data.
A general view of the database architecture for the
EPLOS system, which is ultimately to be the European Logistics Services Portal,
is presented in Fig. 4.
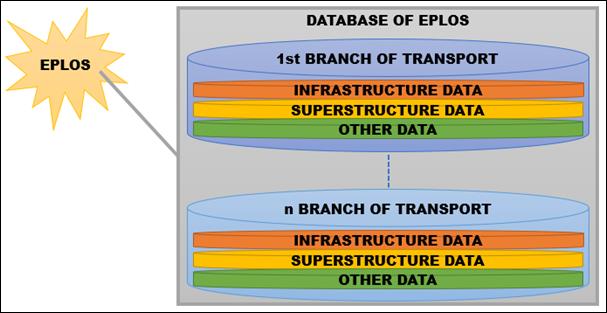
Fig. 4. The concept of the
EPLOS database
The general concept of the database dedicated to the
European Logistics Services Portal can, therefore, be presented as follows;
Individual parts of the database are data on individual branches of transport [16, 21, 32, 33]. Therefore, railway transport
data will be stored separately, separately for road transport, separately for
intermodal transport, etc. To properly group the data in the database, it was
decided that the data for individual branches of transport be stored in three
separate groups: infrastructure data (both linear and point), data on the
superstructure and other data [8, 12, 13,
28, 29].
Specific
parameters will be stored within these groups.
In databases, rows are called records. Each
record contains data related to a specific element and is independent of other
items in this table, for example, in the "aircraft" table, the row
will contain information about one specific aircraft served at a given airport:
its identification number, type, and carrier. Each column in the database is
called a field. Each field of the table stores information of a specific type
for each record, for example, in the "aircraft" table, the
"registration number" column is a field that contains the
registration numbers of all aircraft served at a given airport.
The same type of data is stored in each column. The type of data stored determines the size of the column. Access offers several types of data:
-
text
– text type. The maximum field size is 255 bytes,
-
memo
– notebook type. The maximum field size is 64,000 bytes,
-
number
– a number type. Field size from 1 to 4 bytes,
-
currency
– quota type, reserved for money. The field size is 8 bytes,
-
date/time
– allows one to save the date and time in the field. The field size is 8
bytes,
-
yes/no
– logical type, true or false. The field size is 1 bit,
-
counter
– this type of data is consecutive natural numbers, generated
automatically.
The tables are connected by logical
dependencies called relationships. If the data repeated many times in the records
are moved to a separate table and shared with the key, data redundancy can be
avoided (repeated storage of the same data). The process of catching and
eliminating duplicate data is called normalisation. Relationships between
tables are defined by means of common fields and there can be the following
dependencies:
-
1
on 1 – one to one relationship,
-
1
on n – one to many relationship,
-
n
on m – many-to-many relationship.
An example of the first type of relationship
could be the situation: one aircraft can be served at one stop. Meanwhile,
there may also be a situation where one aircraft can be operated at several
parking spaces, so this is an example of the second type of relationship. A
classic example of the third type of relationship is the situation that occurs
at each airport: one aircraft is served at one parking space, but many other
types of aircraft can also be served at this parking space.
There is a structure of interdependence between
the data within the database, this is the data integrity. This means that, for
example, data from one table cannot be deleted as long as it is referenced in
other tables.
To sort data and gain quick access to it,
database systems use index files. Sorted key field values are stored in them,
for example, reader ID and their respective record numbers. Sorting or
searching for data is therefore limited to sorting and viewing the index file.
Updating and searching the index file does not take much time, and for one
database can be created multiples of such files according to different sorting
criteria.
SQL is an abbreviation of Structured Query
Language. It is a language developed by IBM for the implementation given by
E.F. Codd rules for relational databases. SQL is a structured language defined
by syntax rules. The user can use SQL commands interactively or using an
interface such as the QBE grid.
The data supply module allows for
implementation, control and management of objects, which are presented in Tabs.
1to 3 and in Figs. 5 and 6.
The basic data sets stored in
the database to assess logistics services implemented internationally as part
of the European Logistics Services Portal are data on companies from the TSL
sector, in particular, for transport and forwarding companies concerning:
– charges for using the infrastructure,
–
traffic
restrictions,
–
current traffic
volume,
– infrastructure
technical parameters, including in particular:
o
for
speed limit,
o
permissible axle
loads on the road,
o
for limiting the
total weight and permissible gross weight,
or restrictions for ADR vehicles,
o
limitations of the
vertical gauge.
o
for railway lines
additionally: permissible length and gross weight of trains and limitations of
the horizontal gauge,
o
for waterways
additionally: navigability classes.
– infrastructure
services, including in particular:
o
petrol stations,
o
car wash,
o
guarded parking
lots,
o
unguarded parking
lots,
o
ports.
– transhipment
terminals for data on:
o
access
restrictions,
o
serviceability,
o
terminal
type,
o
the owner of the
terminal,
o
terminal
equipment,
o
the scope of
services rendered.
– warehouse
facilities as regards data on:
o
access
restrictions,
o
additional
services,
o
the owner of the
object,
o
the scope of
services rendered,
o
the equipment of
the facility,
o
the surface of the
object.
Tab. 1
Sample aircraft implemented to the simulation tool
|
Aircraft |
||||
|
LIGHT |
MEDIUM |
MEDIUM |
HEAVY |
HELICOPTERS |
|
CESSNA C-150 |
ATR-42 |
BOEING B-737-800 |
BOEING B‑747 |
EUROCOPTER EC-35 |
|
CESSNA C-172 |
ATR-72 |
AIRBUS A-320 |
BOEING B‑757 |
S-60 BLACKHAWK |
|
DIAMOND DV-20 |
DE HAVILLAND DASH
DH-8D |
AIRBUS A-321 |
BOEING B‑767 |
MI-8 |
|
AERO AT-3 |
SAAB 340 |
MCDONNEL DOUGLAS MD-82 |
BOEING B‑777 |
ROBINSON R‑-44 |
|
CESSNA C-208 |
M-28 SKYTRUCK |
EMBRAER E-195 |
BOEING B‑787 |
W-3 SOKÓŁ |
|
BEECHCRAFT BE-20 |
LOCKHEED C-130 HERCULES |
GULFSTREAM IV |
AIRBUS A‑330 |
BEL-427 |
|
BEECHCRAFT BE-35 KING AIR |
FOKKER F-50 |
FOKKER F-100 |
AIRBUS A‑340 |
SW-4 PUSZCZYK |
Source: authors’ study
based on a printout from a simulation tool
Tab. 2
Planned aircraft arrival table
|
STA |
FLIGHT |
CODE |
ORG |
TMO |
ATA |
OBL |
A/C |
REG |
RWY |
POS-A |
PAX |
REMARKS |
|
19:30 |
W1442 |
|
Rome |
19:30 |
19:39 |
19:45 |
320 |
HALPL |
|
000 |
|
19:46 |
|
19:55 |
LH3024 |
|
Dusseldorf |
19:41 |
19:50 |
19:53 |
CR9 |
DANCK |
|
035 |
60 |
19:53 |
|
19:55 |
W6151 |
|
Gdansk |
19:52 |
20:00 |
20:07 |
320 |
HALPZ |
|
047 |
|
20:07 |
|
20:05 |
LO3826 |
Lo5443 |
London Luton |
20:05 |
20:12 |
20:17 |
320 |
HALWC |
|
091 |
62 |
20:17 |
|
22:00 |
LO0280 |
|
Prague |
|
|
|
319 |
CSTTK |
|
020 |
60 |
|
|
22:25 |
OK700 |
|
London Stansted |
|
|
|
DH4 |
SPEQH |
|
035 |
|
|
|
21:20 |
L0536 |
Nh6731 |
Brussels |
|
|
|
AT3 |
SPLNE |
|
019 |
56 |
EX 21:20 |
|
21:20 |
L0320 |
|
Prague |
|
|
|
E95 |
SPLDG |
|
012 |
49 |
EX 21: 25 |
|
21:25 |
L0280 |
LO5041 |
London Heathrow |
|
|
|
E70 |
SPLLF |
|
042 |
126 |
DE 21:50 |
|
21:25 |
L0320 |
|
Milan |
|
|
|
734 |
SPLII |
|
037 |
64 |
DE 21:55 |
Source: authors’ study
based on a printout from a simulation tool
Planned aircraft departure table
|
FLIGHT |
DES |
SDT |
APT |
OFB |
ADT |
PAX |
CHECH-IN |
GATE |
RWY |
POS-D |
A/C |
REg |
|
LO1442 |
Cracow |
19:35 |
KRK |
20:02 |
20:11 |
27 |
219 |
32 |
23 |
019 |
E70 |
HALPL |
|
LH3024 |
London Heathrow |
19:40 |
LHR |
20:36 |
|
51 |
241 |
12 |
23 |
012 |
320 |
DANCK |
|
W6151 |
Oslo |
19:40 |
OSL |
20:18 |
20:24 |
128 |
233 |
18 |
23 |
036 |
733 |
HALPZ |
|
W3826 |
Vienna |
19:55 |
VIE |
19:52 |
19:59 |
43 |
241 |
5 |
23 |
031 |
E70 |
HALWC |
|
LO333 |
Paris |
20:00 |
CDG |
19:57 |
20:06 |
44 |
212 |
42 |
23 |
024 |
E75 |
CSTTK |
|
OK700 |
Helsinki |
20:00 |
HEL |
|
20:14 |
64 |
271 |
41 |
23 |
008 |
E90 |
SPEQH |
|
AY0536 |
Bergamo |
20:05 |
LTN |
20:12 |
20:20 |
54 |
208 |
44 |
23 |
013 |
320 |
SPLNE |
|
FR3320 |
Praga |
23:50 |
LHR |
|
|
|
250 |
13 |
23 |
038 |
E95 |
SPLDG |
|
OK 780 |
Amsterdam |
06:05 |
BOY |
|
|
85 |
17 |
20 |
23 |
022 |
A13 |
SPLLF |
|
KL1362 |
London Stansted |
06:20 |
PRG |
|
|
102 |
34 |
31 |
23 |
025 |
320 |
SPLII |
Source:
authors’ study based on a printout from a simulation tool
On the one hand, these are static
data regarding technical and economic parameters, as well as infrastructural
equipment of individual participants of the entire process including the
implementation of logistics services. Whereas, the second group of data
concerns dynamic data constituting the results of the work of individual
modules of the designed system.
Remarkable of note is the data
necessary to track and visualise the implementation of selected processes.
These data can be grouped into several sets - data necessary at the stage of
preparation of the load for transport, the performance of services or
implementation of warehouse processes or carried out at transhipment terminals.
An important group of data that will similarly be located in the database is
the previously mentioned parameters.
In functional terms, the
database architecture consists of the following modules (Fig. 7):
–
permanent
data module – contains database tables on infrastructure, means of
transport, operators, etc.,
–
dynamic
data module – designed to handle data that can be added, modified and
removed by users during system operation, for example, stoppage times at
reloading points, service, transport costs, service costs, etc.,
–
archive
module – is part of the database intended for storing analysis reports,
results of services,
–
data
entry module – designed to support the user direct input process,
–
data
presentation module – acts as an intermediary in the process of providing
access to data collected in the database for authorised users,
–
optimisation
and calculation module – the result of the module's operation are reports
and data sets regarding logistics service plans, this module is based on the
built-in optimisation algorithm,
–
optimisation
algorithm calibration module – sets and stores the parameters of the
optimisation algorithm,
–
results
verification module – checks the correctness of results generated by the
optimisation algorithm,
–
data
exchange module – it is an interface between applications based on
different base systems.
Input data entered into the database
are included in the mathematical model describing the analysed problem and
processed by the optimisation algorithm.
3. CATALOGUE STRUCTURE AND RULES FOR SUPPLYING THE
DATABASE WITH DATA ON THE EXAMPLE OF A RAILWAY OPERATOR
As mentioned in the previous section of this
article, the database of the European Logistics Services Portal (EPLOS) has a
structure divided into individual branches of transport and each branch is
divided into a data subbase related to infrastructure, a subbase related to the
superstructure and a subbase related to other elements. Characterising the
structure of data catalogues and the principles of supplying data to the
database for all modes of transport would be quite extensive. Therefore, this
article focuses on the database of railway transport, which is one of the
important elements of the logistics service chain and intermodal transport [20, 27, 31].
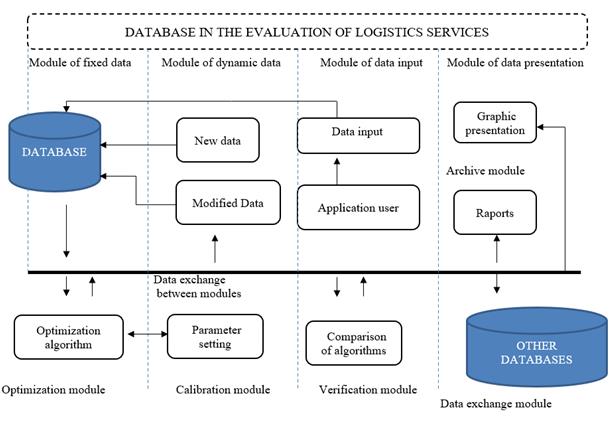
Fig. 7. Database architecture in the
issue of logistics services assessment on
the international market
The first data subbase of railway transport contains
all the necessary information related to railway transport infrastructure. Due
to the fact that the project is co-financed by the European Union, it is
reasonable to use infrastructure components for the development of the
database, which was classified in the Directive of the European Parliament and
of the Council 2012/34 / EU of November 21st, 2012 on the creation
of a single European railway area [38]. According
to this directive, all the elements that make up a given part of the railroad
are included, sidings inclusive. By adapting the list to the needs of the EPLOS
system, the following elements constituting the railway transport
infrastructure can be distinguished [38]:
–
lands,
–
tracks
and subgrade, ... freight ramps, including ... at freight terminals ...,
...
– railway crossings,
...
– access routes for ... goods,
including access roads ...,
...
– lighting systems for railway traffic
and safety purposes,
...
– buildings used by the infrastructure
department, ....
The first transport
infrastructure element regarded as important from the viewpoint of the EPLOS
system are lands. Their mapping in the portal allows locating specific
logistics service providers in space. Furthermore, it allows determining which
areas belong to railway infrastructure managers, which will give the portal
user the opportunity to search for specific development sites. Therefore, it
will be necessary to create a catalogue of railway lands in which individual
plots would be appropriately parameterised. An example table structure with
data on lands from the database is presented in Tab.
4.
Tab. 4
Table structure with data on railway lands
|
No. |
Land name |
Land location |
Land area |
Others |
|
1 |
… |
… |
… |
|
|
… |
… |
… |
… |
|
Source: authors
Similar data for Poland can be
obtained using the Geoportal or maps of railway infrastructure managers.
The second important element
is data on railway infrastructure. Here, it is necessary to map railway lines
located in the area of interest to the project and data on operational points
involved in the movement of freight trains. Obtaining this data is necessary,
among others to determine the possible start and end point of the shipment, to
estimate the distance between the potential shipment point and the potential
pickup point, or to determine the approximate time of delivery. Therefore, it
will be obligatory to create a catalogue of operational points and a catalogue
of railway lines, where the values of individual important parameters would be
placed. An example of the table structure with data on operational points from
the database is presented in Tab. 5 while regarding railway lines in Tab. 6.
Tab. 5
Table structure with data on operational points
|
No. |
Parameter |
V1 |
V2 |
V3 |
|
1. |
Point number |
… |
… |
… |
|
2. |
Point name |
… |
… |
… |
|
3. |
Point location |
… |
… |
… |
|
4. |
Railway line no. |
… |
… |
… |
|
5. |
Km of the railway line |
… |
… |
… |
|
6. |
Track width at a point |
… |
… |
… |
|
7. |
Number of tracks for freight trains |
… |
… |
… |
|
8. |
Minimum track length for freight trains |
… |
… |
… |
|
9. |
Maximum track length for freight trains |
… |
… |
… |
|
10.
|
Supported types of freight wagons |
… |
… |
… |
|
11.
|
Equipment for handling goods (service infrastructure) |
… |
… |
… |
|
12.
|
Access route for goods |
… |
… |
… |
|
13.
|
Lighting system |
… |
… |
… |
|
14.
|
Buildings related to the handling of goods |
… |
… |
… |
|
15.
|
Neighbouring exploitation points |
… |
… |
… |
|
16.
|
Distance to neighbouring points |
… |
… |
… |
|
17.
|
Other |
… |
… |
… |
Source: authors
Tab. 6
Table structure with data on railway lines
|
No. |
Parameter |
V1 |
V2 |
V3 |
|
1. |
Railway line no. |
… |
… |
… |
|
2. |
Railway line route |
… |
… |
… |
|
3. |
Length of the railway line |
… |
… |
… |
|
4. |
Track width |
… |
… |
… |
|
5. |
List of operational points with location |
… |
… |
… |
|
6. |
Are freight trains allowed? |
… |
… |
… |
|
7. |
Maximum speed of freight trains |
… |
… |
… |
|
8. |
Permissible axle load |
… |
… |
… |
|
9. |
Approval of a given type of wagon to run |
… |
… |
… |
|
10. |
Minimum length of freight trains |
… |
… |
… |
|
11. |
Maximum length of freight trains |
… |
… |
… |
|
12. |
Price for access to infrastructure |
… |
… |
… |
|
13. |
Neighbouring railway lines |
… |
… |
… |
|
14. |
Service points where adjacent lines appear |
… |
… |
… |
|
15. |
Other |
… |
… |
… |
Source: authors
Similar data for Poland and
neighbouring countries can be obtained from the Network Statements, which
railway infrastructure managers in European countries are obliged to compile.
When characterising operational points, it is important to consider freight
terminals, dry ports, etc. In addition, the table includes the characteristics
of the access route for goods for a given point and the characteristics of
buildings intended for goods handling.
The third group of data
relevant for the EPLOS portal are data on railroad crossings. They are quite
insignificant from the viewpoint of the organisation of freight trains,
however, they can be a potential point of transhipment of oversized goods from
road transport to railway transport and vice versa. Therefore, there is a need
to properly parameterise them. An example of the table structure with data on
railroad crossings from the database is presented in Tab. 7.
Tab. 7
Table structure with data on railroad crossings
|
No. |
Parameter |
V1 |
V2 |
V3 |
|
1. |
Railroad crossing
number |
… |
… |
… |
|
2. |
Name of the
railroad crossing |
… |
… |
… |
|
3. |
Location of
railroad crossing |
… |
… |
… |
|
4. |
Railway line no. |
… |
… |
… |
|
5. |
Km of the railway line |
… |
… |
… |
|
6. |
Equipment for handling freight (service
infrastructure) |
… |
… |
… |
|
7. |
Neighbouring operational points |
… |
… |
… |
|
8. |
Distance to neighbouring points |
… |
… |
… |
|
9. |
Other |
… |
… |
… |
Source: authors
Similar data for Poland can be
obtained using the Geoportal or maps of railway infrastructure managers.
The second data subbase of
railway transport data contains all necessary information related to the
railway transport superstructure. From the viewpoint of the EPLOS project
implementation, the important data are the parameters of the wagons with which
freight can be transported. Therefore, a catalogue of freight wagons should be
created in which their characteristic parameters would be placed. An example of
the table structure with data on freight wagons from the database is presented
in Tab. 8.
Tab. 8
Table structure with data on freight wagons
|
No. |
Parameter |
V1 |
V2 |
V3 |
|
1. |
Wagon type |
… |
… |
… |
|
2. |
Wagon series |
… |
… |
… |
|
3. |
Wagon dimensions |
… |
… |
… |
|
4. |
Wagon load capacity |
… |
… |
… |
|
5. |
Permissible axle loads |
… |
… |
… |
|
6. |
Track width |
… |
… |
… |
|
7. |
Purpose of the wagon |
… |
… |
… |
|
8. |
Admissibility of parcel type transport |
… |
… |
… |
|
9. |
Other |
… |
… |
… |
Source: authors
Similar data for Poland can be
obtained from the catalogue of freight wagons of railway undertakings.
The third subbase of railway
transport data contains all other information related to railway transport that
is not included in the subbases discussed so far. This part of the database
stores both parameters that will be entered by the user or generated by the
EPLOS system but only in the field of railway transport. Catalogues should
include a set of data on the parameters of a freight shipment. An exemplary
table structure with data on a freight shipment from the database is presented
in Tab. 9.
Tab. 9
Table structure with data on a freight shipment
|
No. |
Parameter |
V1 |
V2 |
V3 |
|
1. |
Freight shipment number |
… |
… |
… |
|
2. |
Shipment characteristics |
… |
… |
… |
|
3. |
Shipping Weight |
… |
… |
… |
|
4. |
Weight of one package |
… |
… |
… |
|
5. |
Dimensions of one package |
… |
… |
… |
|
6. |
Shipment susceptibility |
… |
… |
… |
|
7. |
Shipment type |
… |
… |
… |
|
8. |
Other |
… |
… |
… |
Source: authors
Presently, it is difficult to
indicate other catalogues that could appear in the third subbase regarding
railway transport.
4.
CONCLUSIONS
The choice of a logistics operator to perform specific
logistics services is determined by its ability to effectively perform a
specific task commissioned by customers. The effectiveness of the task can be
assessed by various measures, for example, time, cost of transport,
punctuality, safety or reliability in delivering the load to a given pickup location.
The choice of logistics operator takes into account
many factors posed by demanding logistics service buyers in the context of the
mode of transport, the type of preferred transport as well as the capabilities
of logistics operators and the transport technologies they offer.
To effectively provide logistics services, entities
existing on the logistics market compete with each other in terms of the
quality of these services and the selection of effective transport means that
reduce the time and cost of carrying out the tasks assigned. Offering services
characterised by the minimum time and cost of their implementation is a key
factor increasing the competitiveness of a given logistics operator on the
market.
Considering the complexity of problems arising from
the implementation of specific logistics services, and the desire to increase
the efficiency of the implementation of tasks by operators, it is advisable to
use computer support.
Systems supporting decision making in logistics and
transport issues related to various areas of operation of logistics operators,
carriers, storage processes, and selection of the location of warehouse
facilities or intermodal transport terminals. The key element of any decision
support system is based on information characterising a given decision problem.
This information in the form of input data is processed by the system, saved or
transferred to further calculation processes. An important element is the
efficient transmission of various types of data between a given system and a
database supporting the work of that system.
Designing database architecture for the logistics
services market is a big challenge for all process participants, including
logistics service operators, transport organisers, etc.
The structure of the database is characterised by the
number of relevant catalogues and records, so it depends on the mathematical
model of the problem as well as on the optimisation algorithms used to solve
the problem, and such a structure should be developed first.
Acknowledgement
This work was
performed within the framework of the EUREKA project implemented based on an
agreement with the National Center for Research and Development No. EUREKA /
EPLOS / 3/2017 on the European Logistics Services Portal (EPLOS).
References
2.
Babaian T., W.
Lucas. 2013. “Modeling data for enterprise systems with memories”. Journal of Database Management 24(2):
1-12.
10.
Directive 2012/34
/ EU of the European Parliament and of the Council of November 21, 2012 on the
creation of a single European railway area.
11.
Elmasri R. 2008. Fundamentals of database systems.
Pearson Education India.
12. Gołda P., M. Izdebski, E. Szczepański. 2018.
“The application of ant algorithm in the assignment problem of aircrafts
to stops points on the apron”. Journal
of KONES 25(4): 479-488.
13. Gołda P., M. Kowalski, C. Wasser, P. Dygnatowski,
A. Szporka. 2019. “Elements of the model positioning of aircraft on the
apron”. Archives of Transport
51(3): 101-108.
15. Jacyna M., M.
Izdebski, E. Szczepański, P. Gołda. 2018. „The task assignment of vehicles for a production
company”. Symmetry-Basel 11(10): 1-19. DOI: 10.3390/sym10110551.
19. Jacyna M., A. Bobiński. 2016. SIMMAG jako narzędzie dla wizualizacji obiektów magazynowych w 3D. [In Polish: SIMMAG as a tool for visualization of warehouse objects in 3D]. Warsaw University of Technology Publishing House. ISBN: 978-83-7814-637-7.
21. Jacyna M., M. Wasiak (eds.). 2014. Simulation model to support designing a
sustainable national transport system. Warsaw University of
Technology Publishing House. ISBN: 978-83-941338-0-1.
24. Kłodawski
M., R. Jachimowski, I. Jacyna-Golda, M. Izdebski. 2018. „Simulation analysis of order picking efficiency with congestion
situations”. International Journal of Simulation Modelling 17(3): 431-443.
26. Kukulski J., M. Jacyna, P. Gołębiowski. 2019.
“Finite element method in assessing strength properties of a railway
surface and its elements”. Symmetry-Basel
8(11): 1-29. DOI: 10.3390/sym11081014.
27. Sibilski K., A. Żyluk, M. Kowalski. 2015. „Simulation studies of micro air vehicle”. Journal of KONES 22(4): 243-252.
32. Żochowska R. 2014. “Selected issues in
modelling of traffic flows in congested urban networks”. Archives of Transport 29(1): 77-89.
Received 27.03.2020; accepted in revised form 19.06.2020
![]()
Scientific
Journal of Silesian University of Technology. Series Transport is licensed
under a Creative Commons Attribution 4.0 International License