Article
citation information:
Mindur, M. Significance of the port of
Singapore against the country’s economic growth. Scientific Journal of Silesian University of Technology. Series
Transport. 2020, 106, 107-121.
ISSN: 0209-3324. DOI: https://doi.org/10.20858/sjsutst.2020.106.9.
Maciej MINDUR[1]
SIGNIFICANCE
OF THE PORT OF SINGAPORE AGAINST THE COUNTRY’S ECONOMIC GROWTH
Summary. The economy of Singapore is characterised by a
stable political environment, favourable business conditions and very well-developed
infrastructure attracting foreign direct investment, being the driving force of
the economy. It is highly dependent on export, as well as on the dynamic
sectors of transport, business and financial services. Singapore’s
natural deep-sea ports and the geographical location at the crossroads of
important shipping channels makes its trade a major economic sector, next to
production and services. There are currently more than 5,000 maritime companies
operating in Singapore, including over 130 international shipping groups, which
constitute an important pillar for the international maritime transport hub.
This article discusses Singapore’s economic situation by analysing the
dynamic GDP growth over the years 1960–2016 as well as other economic
indicators achieved in 2004–2017, including the dynamics of foreign
trade. This research covers the port’s ownership and organisational
structure, and its terminals have been reviewed in terms of their location,
infrastructure and functions by taking into account the new generation terminal
of the port of Tuas, currently under development. Over the years, the port has
seen a steady increase in revenue from transhipment, which is confirmed by the
dynamics of the container volume growth over the years 1972–2017, the
transhipment volume over the years 2007–2018 and the number of container
ships calling at the port along with their total capacity over the years
2007–2017, as elaborated in the article.
Keywords: port of Singapore,
economy, terminals, transhipment
1. INTRODUCTION
The
Singapore seaport is the busiest transhipment hub in the world. Located at the
southern end of the Malay Peninsula, 30 km southwest of the port of Johor in
Malaysia, it provides connectivity to more than 600 ports in 123 countries.[2] The island nature of the
city-state of Singapore (besides the main island of Singapore, it contains 60
small coastal islands) determines the dynamic development and excellent
maintenance of both linear and point infrastructure of transport, and maritime
transport in particular.
Fig. 1. Geographical
location of Singapore
Source: https://www.google.pl/maps/place/Singapur/data=!4m2!3m1!1s0x31da11238a8b9375:0x887869cf52abf5c4?sa=X&ved=2ahUKEwil_ZGf7qHhAhUj_SoKHYzdA0sQ8gEwAHoECAkQAQ
For centuries, Singapore
performed the important role of a transhipment hub for regional and
international trade as the economic capital of the Malay Peninsula. However,
once Singapore gained full independence in 1965 (in 1963, following its merger
with Malaysia, it ceased to be a part of the British Empire), the port was
forced to compete with others in the region. Along with its progressing
revival, the economy was being oriented towards obtaining raw or semi-processed
products from regional and global markets as well as exporting the processed
products back to these markets.[3]
In the late 1960s, a
decision was made to build a container terminal in East Lagoon (today’s
Tanjong Pagar) in the port of Singapore, being the first in Southeast Asia,
even though container ships were not yet widespread means of freight transport
at that time. As the transport of containerised cargo developed and the volume
of bulk cargo increased, the port’s facilities have been successively
expanded since the 1980s in order to increase its capacity. In terms of the number
of transshipped containers counted in TEU, Singapore is only second to Shanghai
among the world’s largest ports (with 36.6 million TEU transshipped in
2018; Shanghai’s volume being 40.2 million TEU).
The transformation of a
small regional port into one of the busiest ports in the world has undoubtedly
been determined not only by its favourable geographical location at the
crossroads of important trade routes but also by the courageous and visionary
plan to build the first container terminal.
2. ECONOMY OF SINGAPORE
In only a few decades, Singapore has advanced from a
poor post-colonial region to the rank of the largest Southeast Asian centre of
business, commerce and finance with highly developed and successful free-market
economy. The city primarily owes its high level of development to the highly
advanced industrial production based on the latest technologies.
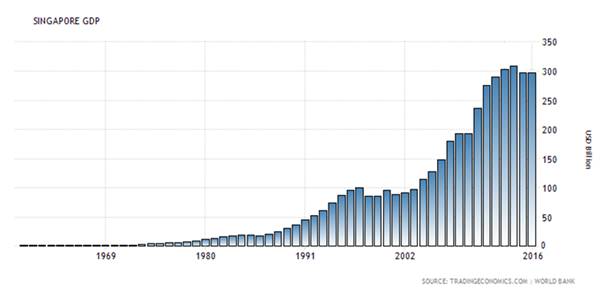 Fig. 2. Trends in the GDP of
Singapore over the years 1960–2016
Fig. 2. Trends in the GDP of
Singapore over the years 1960–2016
Source:
https://tradingeconomics.com/singapore
The economy of Singapore is characterised by a stable
political environment, favourable business conditions and very well-developed
infrastructure attracting foreign direct investment, being the driving force of
the economy. The Doing Business 2018 ranking on the ease of doing business
ranks Singapore second among 43 countries of the Asia-Pacific region. The
service sector generates nearly 70% of the GDP, while the industry and the
construction – more than 30%. The maritime industry accounts for 7% of
the GDP and employs more than 170,000 people. The agricultural sector does not
contribute significantly to the GDP. It is for the lack of arable land that in
terms of employment the agriculture accounts for a mere 1.3% of the total
labour force.
Tab. 1
Indicators of Singapore’s economy
for the years 2004–2017 (in per cent)
|
|
2004 |
2005 |
2006 |
2007 |
2008 |
2009 |
2010 |
2011 |
2012 |
2013 |
2014 |
2015 |
2016 |
2017 |
|
GDP |
13.7 |
8.1 |
8.8 |
12.1 |
0.4 |
0.5 |
15.2 |
5.4 |
3.4 |
4.4 |
2.9 |
2.0 |
2.4 |
3.6 |
|
Private consumption |
5.1 |
4.3 |
6.2 |
10.5 |
8.5 |
0.2 |
9.8 |
8.1 |
6.8 |
4.3 |
2.8 |
3.7 |
4.1 |
3.9 |
|
Unemployment rate (%) |
3.4 |
3.1 |
2.7 |
2.1 |
2.2 |
3.0 |
2.2 |
2.0 |
2.0 |
1.9 |
2.0 |
1.9 |
2.1 |
2.2 |
|
Inflation rate |
1.7 |
0.5 |
1.0 |
2.1 |
6.6 |
0.6 |
2.8 |
5.2 |
3.6 |
2.4 |
1.0 |
-0.6 |
-0.5 |
0.6 |
|
Export |
20.5 |
14.0 |
12.8 |
4.4 |
5.8 |
-18.0 |
22.4 |
7.5 |
4.2 |
8.0 |
3.6 |
-6.8 |
-3.1 |
10.3 |
|
Import |
23.6 |
13.6 |
13.7 |
4.5 |
13.9 |
-21.0 |
18.8 |
8.6 |
5.9 |
9.8 |
1.2 |
-11.1 |
-4.9 |
12.1 |
|
Total investment |
12.5 |
-9.2 |
12.4 |
-15.3 |
16.9 |
-39.3 |
103.1 |
29.6 |
1.0 |
19.8 |
3.6 |
5.4 |
-15.6 |
14.1 |
Source: Ministry of Trade and Industry, Singapore; https://www.mti.gov.sg/
In 2017, Singapore’s GDP increased by 3.6% compared
to 2016 and was twice as high as forecasted. The greatest impact on such
results of the Singaporean economy, being particularly sensitive to global
economic fluctuations, was exerted by the increased global demand for
electronic products, which was also one of the most important growth drivers in
2018.
Singapore’s unemployment rate is very low, as it ranged between 2.1
and 3.4% in the years 2004–2009, however, it has remained at a fixed
level of ca. 2% since 2010.
Immediately after the
global financial crisis, Singapore was struggling with high inflation exceeding
5% in 2011. However, this record-breaking level was drastically reduced to 0.6%
in 2017.
The Singaporean economy is highly dependent on
exports, especially of electronics, petroleum products, chemicals, medical and
optical equipment, pharmaceuticals, as well as dynamic sectors of transport,
business and financial services.[4]
In 2017, following two consecutive years of decline, Singapore’s
foreign trade regained its typical dynamics, as the trade volume increased by
11.1%, the imports grew by 12.1% and the exports by 10.3%. The aforementioned trade revival
was mainly driven by an increase in the trade of electronics. Singapore’s
main import partners are China (14.2%), Malaysia (11.2%), the European Union
(10.2%), the USA (8.3%) and Hong Kong (7.2%), while the most important export
markets are China (14.5%), Hong Kong (12.3%), Malaysia (10.6%), the EU (8.4%)
and Indonesia (7.5%).
The dynamic development
of international trade in commodities is by no means limited by
Singapore’s lack of natural resources or shortage of land. Its natural
deep-sea ports and geographical location at the crossroads of important
shipping channels make its trade a major economic sector, next to production and
services.[5] There are currently more than 5,000 maritime companies operating in
Singapore, including over 130 international shipping groups, which constitute
an important pillar for the international maritime transport hub.[6]
3.
OWNERSHIP STRUCTURE VS PORT MANAGEMENT
The port of Singapore is
administered and supervised by the state, in terms of both financing and
development. It is managed by a government agency, the Maritime and Port
Authority of Singapore (MPA), established in 1996 by the merger of the Marine
Department, the National Maritime Board and the regulatory departments of the
former Port of Singapore Authority (PSA), which was transformed into a holding
company in 2004.
The MPA operates on
behalf of the state government in the areas of maritime transport as well as
port management, development and promotion. Some of its tasks are as follows:
-
collaboration
with the government and maritime partners to ensure that the port develops on a
continuous basis and strengthens its position in the global market,
-
supervision
of the marine traffic, safety and the navigation system, coordination of
terminals, implementation of measures to reduce the negative environmental
impact of shipping,
-
undertaking initiatives to encourage major ship-owners and operators to
commence operations in Singapore,
-
representing
the interests of the Singaporean maritime transport sector abroad[7].
The port operations
performed in both general cargo (container and conventional) and ro-ro
terminals are handled by two port groups: PSA Singapore (established by way of
transformation of the Port of Singapore Authority) and Jurong Port. Both groups
belong to Temasek Holdings, owned by the state treasury and providing funding
for the port’s continuous development. Temasek Holding also controls a
significant number of other companies operating in Singapore, including the DBS
bank (the Development Bank of Singapore Limited) and Singapore Airlines.[8]
The bulk cargo terminals
are predominantly managed directly by their users, such as refineries, chemical
industry companies, etc. (companies such as LANXESS, BASF, BP, SHELL or EXONN
MOBIL run their plants in Singapore).
4. PORT ORGANISATION AND
INFRASTRUCTURE
There
are two main port groups functioning in Singapore: PSA Corporation Limited,
with its subsidiary company, PSA Singapore, primarily responsible for container
transhipment, and Port Jurong, handling general, bulk and container cargo. Both
ports are suitable for all types of vessels. Container handling services are the
port’s key activity, with approximately 85% of the containers arriving in
Singapore being transshipped onto vessels bound for another port of call. The
handling capacity of the port of Singapore is 50 million TEU per year.
Fig. 3. Arrangement of
ports and their respective terminals in the port of Singapore
Source: https://www.straitstimes.com/singapore/full-steam-ahead-for-new-tuas-mega-port
5. PSA SINGAPORE
PSA Singapore currently offers 67 quay berths at its
container terminals in Tanjong Pagar, Keppel, Brani and Pasir Panjang, being
operated as a single and undivided integrated facility. In 2018, PSA Singapore
handled 36.31 million TEU of containers. This transhipment hub accounts for
nearly one-seventh of the total container transhipment capacity worldwide and
for more than 4% of the global container handling capacity.
There is one of the world’s largest warehouse
parks on the premises of PSA Singapore, offering more than 12,000 refrigeration
units (more than 1.3 million TEU of refrigerated containers were handled there
in 2016). The integrated refrigeration monitoring system (iRMS) is linked to
the CITOS® system, which enables cargo to be tracked on a real-time and
online basis at every stage of operation. It allows customers to monitor the
condition of their cold stores wherever they actually are in the world by means
of PSA Portnet® via the internet. The Reefer Maintenance & Repairs
(RMNR) system, on the other hand, keeps track of all failures, enabling quick
response whenever refrigeration units require repairs, as they may contain
sensitive and valuable cargo.
PSA Singapore handles more than 0.5 million TEU of
dangerous goods per annum. Some of the services rendered in this scope include
processing of dangerous goods (DG), leakage/damage control to ensure safe
shipment, labelling for containers with missing mandatory warning labels or
ones that do not conform with the IMDG codes, as well as handling and storage
of highly dangerous goods for local delivery or onward shipment. At the same
time, PSA supplies full sets of spare parts for each refrigerated container
type. Moreover, a full range of standard storage warehousing is available at
docking stations for empty containers. PSA operates as the main transhipment
hub for collecting empty containers from ships or for sending them out.[9]
The flagship PSA Singapore terminal is Pasir Panjang,
featuring the most technologically advanced transhipment machinery and
equipment. The terminal is currently used for testing a fully automated
electric crane system, 30 automatic-control vehicles, eight hybrid and 22
battery-powered electric vehicles.[10] It is expected that the
solutions tested at Pasir Panjang will be implemented at Singapore’s Tuas
mega port, currently under construction, which is described below.
In the second half of
2016, the transport group of CMA CGM-PSA Lion Terminal Pte. Ltd. (CPLT),
established by CMA CGM S.A. (CMA CGM) and PSA Singapore Terminals Pte. Ltd.
(PSA), commenced its operations in Pasir Panjang. The company has four berths
for mega container ships at its disposal on the premises of Pasir Panjang
Terminal (PPT), which has been extended under phases 3 and 4 (Fig. 3). CPLT
uses the most highly advanced port infrastructure and the latest technologies,
and they also provide long-term terminal services for CMA CGM and its shipping
service divisions.
Another joint venture
operating in the port, namely COSCO-PSA Terminal Pte Ltd (CPT), was established
by COSCO Shipping Ports Limited (CSP) and PSA. Founded in 2003, CPT was
functioning as the main container transport hub in the region until 2017 when
it moved from the formerly managed two-berth terminal to one with three
mega-ship berths completed under phases 5 and 6 of the expansion. In November
2018, CSP and PSA signed an agreement on the commissioning of two new berths
and rendering them available to the company. This means that CTP will control
five berths in total, which will increase its annual handling capacity from 3
to approximately 5 million TEU. The new mega-ship berths, similar to the
existing ones, will be supported by the shipyard’s highly automated
technology.
In March 2006, MSC-PSA Asia Terminal (MPAT) was officially opened as a
joint venture between the world’s second largest shipping line, the
Mediterranean Shipping Company (MSC) and PSA International. The berths owned by
MPAT are fully integrated with other berths in Pasir Panjang. MPAT is capable
of handling mega-ships with a capacity exceeding 14,000 TEU.
The Pacific International Lines (PIL) dedicated container terminal is
located in Keppel. The joint management and operation of the terminal for PIL
and PSA Singapore (PSA) is performed by the joint venture company PIL-PSA
Singapore Terminal Pte Ltd (PPST). Both the terminal and the berths in Keppel
are fully integrated with other facilities operated by PSA.
The first Singaporean terminal dedicated to cars, that is, the Asia
Automobile Terminal (Singapore) (AATS), was launched in January 2009. It is a
joint venture of PSA, Nippon Yusen Kabushiki Kaisha (NYK) and Kawasaki Kisen
Kaisha Ltd (K Line).
Next to
the terminals managed by joint ventures in Pasir Panjang, there are also
multifunctional terminals. These are Pasir Panjang Automobile Terminal (PPAT),
which commenced its operations in January 2009, and the multi-purpose terminal
of Sembawang Wharves. PPAT is a ro-ro vessel transhipment hub, featuring three
separate quay berths. The unroofed car parking yard and the multi-storey car
park provide a total of approximately 20,000 parking spaces. The multi-purpose
Sembawang Wharves terminal handles general and speciality cargo, including
heavy equipment, steel products and cables. There are numerous storage
facilities, including open ones, at the Sembawang wharf for long and short-term
rental.
6. TUAS PORT
Like many other ports around the world, the port of
Singapore has developed into a city, which used to serve as a focal point for
trade and cargo shipping operations in the past. The lease of three terminals
originally sited on municipal territories, that is, Tanjong Pagar, Keppel and
Brani, expires in 2027. The Singaporean authorities have decided to revitalise
the vacant areas as a part of the Greater Southern Waterfront project assuming
that a quayside district with futuristic residential buildings, entertainment,
recreation and tourist attractions will be built in this place, providing
access to numerous green areas and the sea itself.[11]
The relocation of port facilities as
well as the personnel from the Tanjong Pagar, Keppel and Brani terminals to
newer facilities with deeper basins in Pasir Panjang, to be operated by PSA for
at least another 20 years, began in 2016. The target is to move all operations
to a new generation terminal on a new artificial peninsula, known as the port
of Tuas, which is due to be completed in 2040 (phase 1 is scheduled for
completion in December 2020, with the port to be gradually commissioned
starting from 2021).[12] The PSA Singapore
container terminals will eventually be consolidated in a single location.[13] The new port of Tuas will be
capable of handling the largest container ships in the world, and it will
become the world’s largest automated container terminal with an annual
capacity of 65 million TEU.[14] It is, by all
means, an adequate location due to its sheltered deep waters and the proximity
to both international shipping routes as well as major industrial areas in the
western part of Singapore. The decision-makers responsible for the port
construction and development intend to make the port of Tuas a part of a larger
ecosystem integrating various stakeholders in a logistic community, both
digitally and physically, and to enable deployment of integrated intermodal
supply chain solutions that will result in more reliable and faster delivery of
goods to their destinations.
The new port will feature such infrastructure as automated
quay cranes and automatic-control vehicles. New systems are to be deployed to
enable synchronised negotiating between all port facilities. The future
dispatch centre will combine the functions of control and coordination of the
terminals, ensuring the organisation of all automated port operations and
maintenance. It will be capable of remotely servicing and diagnosing the
equipment.
7. JURONG PORT
The port of Jurong was
commissioned in 1965 to function as a port for handling of bulk and general
cargo, intended to meet the needs of the industrial development of
Singapore’s Jurong district. Its main terminal located in Singapore
currently receives more than 15,000 vessels per year, both from the region and
from abroad.[15]
Jurong
Port hosts the world’s largest cement terminal serving more than 90% of
Singapore’s bulk cement imports. The annual handling capacity of a
terminal arranged on a 5.3 ha plot of land exceeds 7.5 million MT. The terminal
features a state-of-the-art infrastructure and equipment to ensure safe,
efficient and environmentally friendly cement discharge. Cement terminals 1 and
2 are situated at deep-water quay berths of up to 12.9 m in length, and they
can accommodate ships with a capacity of up to 50,000 DWT. They feature 5 screw
unloading machines, and their closed-loop air transport system enables cement
to flow freely into storage silos.
Steel Terminal is specialised in handling all kinds of
steel products (sheets, wire coils, reinforcing bars, pipes, beams, rollers,
etc.). The terminal offers storage yards and warehouses with an area of 484
thousand m2 and can handle vessels of 15.5 m in draught.[16]
Owing to its excellent connectivity
solutions and excellent modern port infrastructure, Jurong Port Combi Terminal
provides for transhipment of different types of containers and general cargo on
multipurpose vessels.
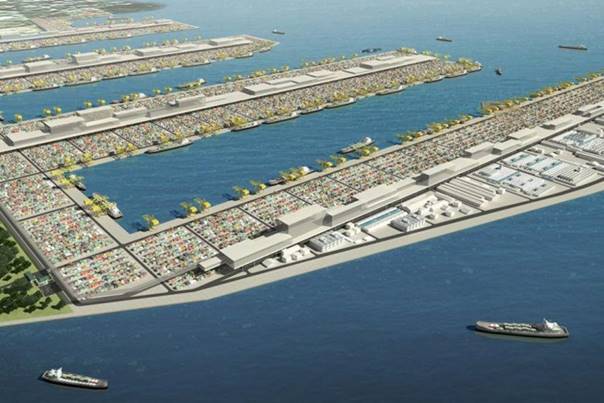
Fig. 4. Visualisation of the Tuas mega port
Source: https://www.straitstimes.com/singapore/spore-plans-to-keep-port-attractive
There is a project being implemented at Jurong Port to
build Jurong Tank Terminal, a state-of-the-art liquid bulk cargo handling
terminal equipped with 19 tanks for storage and handling of clean petroleum
products and chemicals. With the estimated value of 140 million USD, the
project is a joint venture of Jurong Port Singapore Holding and Oiltanking
Investment Holdings. The new terminal, sited on 16 hectares of land, is facing
the Jurong Island petrochemical centre in Singapore, both to be connected by
pipelines. It will have quay berths capable of accommodating vessels of 16 m in
draught and up to 120,000 tonnes in deadweight. The terminal’s initial
capacity will come to ca. 232,000 m3, while after phase 2 of the
project is completed, it will potentially rise to 470,000 m3.
There are two terminals in Jurong Port, which play a
key role in the domestic ship supply sector, namely, Penjuru Lighter Terminal
intended to service lighter ships, and Marina South Wharves used to supply
ships with spare parts and food. These terminals handle a total of 800,000 MT
of cargo per year. They provide quay services, berth and ancillary services.
8.
PORT’S TRANSHIPMENT SERVICES
The port of Singapore is a
multi-purpose port with an area of 752 ha and a quay length of 21,630 m,
handling transhipment of general cargo (containerised and conventional), bulk
cargo (liquid and dry) as well as ro-ro vehicles. The port is capable of
handling 1,000 ships entering or leaving the port per day in 10-minute
intervals.[17]
Over
the years, the port has seen a steady increase in revenue from transhipment. In 2018, the volume of
container transhipment increased from 33.7 to 36.6 million TEU, that is, by
7.2% compared to the previous year. The dynamics of the container volume growth
is shown in Fig. 5.
As the
world’s demand for goods transported by sea increases, shipowners are
using larger and larger container ships capable of carrying enormous quantities
of cargo in order to reduce shipping costs. Due to meticulous planning and
continuous improvement of its infrastructure, Singapore has become one of the
few ports in the world that can serve the largest vessels.
Tab. 2
Number of container ship
arrivals at the port of Singapore over the years 2007-2017
|
Year |
Container ship
arrivals |
Number of
transhipments (‘000 TEU) |
|
2007 |
19,946 |
27,935.5 |
|
2008 |
20,589 |
29,918.2 |
|
2009 |
18,005 |
25,866.6 |
|
2010 |
18,967 |
28,431.1 |
|
2011 |
19,290 |
29,937.7 |
|
2012 |
18,567 |
31,649.4 |
|
2013 |
17,798 |
32,578.7 |
|
2014 |
17,219 |
33,869.3 |
|
2015 |
17,722 |
30,922.3 |
|
2016 |
17,932 |
30,903.6 |
|
2017 |
17,663 |
33,666.6 |
Source: author’s own materials
based on
https://www.mpa.gov.sg/web/portal/home/maritime-singapore/port-statistics.
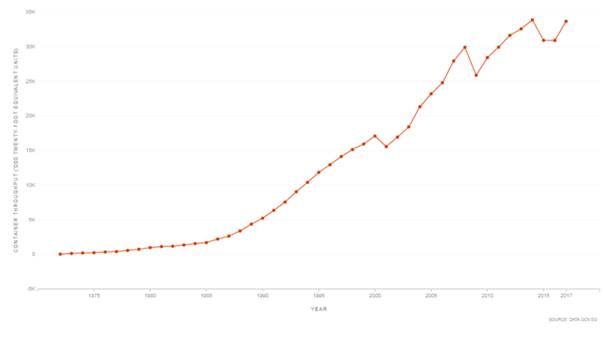
Fig. 5.
Volume of container transhipment in the port of Singapore over the years 1972–2017 in million TEU
Source:
https://data.gov.sg/dataset/container-throughput-annual?view_id=ebe25612-f598-422e-9326-fd7dbc4c6ae0&resource_id=dcf81859-2a92-4ff6-a499-5356a0b82011
The volume of
transhipments handled over the years 2007–2018, in a breakdown into
general cargo (including containerised and conventional) and bulk cargo has been
summarised in Table 3.
Tab. 3
Volume of container
transhipment in the port of Singapore over the years 1972-2017 according to the
type of cargo in ‘000 tonnes
|
Year |
General cargo |
Bulk cargo |
Total |
||
|
containerised |
conventional |
liquid |
dry |
||
|
2007 |
289,094.2 |
25,823.2 |
157,382.3 |
11,316.4 |
483,616.1 |
|
2008 |
308,489.7 |
27,934.9 |
167,318.9 |
11,671.8 |
515,415.3 |
|
2009 |
262,896.8 |
17,452.1 |
177,323.7 |
14,627.2 |
472,300.3 |
|
2010 |
289,693.5 |
23,989.7 |
177,070.2 |
12588.7 |
503,342.1 |
|
2011 |
309,379.9 |
26,130.6 |
183,843.3 |
11,821.8 |
531,175.6 |
|
2012 |
323,714.0 |
29,827.6 |
169,671.5 |
14,799.0 |
538,012.1 |
|
2013 |
333,049.0 |
32,067.3 |
179,160.8 |
15,303.9 |
559,581.0 |
|
2014 |
353,538.7 |
30,879.7 |
181,679.4 |
15,170.3 |
581,268.0 |
|
2015 |
331,739.7 |
30,118.8 |
195,836.9 |
18,150.4 |
575,845.8 |
|
2016 |
328.195.7 |
25,047.8 |
221,413.4 |
18,639.9 |
593,296.7 |
|
2017 |
349,101.4 |
26,944.3 |
233,038.8 |
18,603.6 |
627,688.1 |
|
2018 |
367,421.9 |
24,323.3 |
221,525.4 |
16,854.6 |
630,125.3 |
Source:
https://www.mpa.gov.sg/web/portal/home/maritime-singapore/port-statistics
Singapore
is often referred to as the leading petroleum trading hub in Asia (being the
third largest in the world, after New York and London) and one of the five
largest petroleum refining centres in the world.[18] This raw material and
its derivatives constitute the main bulk cargo handled in the port of Singapore,
subsequently processed by the highly developed petrochemical industry. The number of tanker arrivals at the port over
the years 2007–2017, as well as the volume and type of liquid bulk cargo
transported by these vessels have been collated in Table 4 (in 2018, the port
received 24,165 tankers).
Tab. 4
Tanker arrivals at the
port of Singapore over the years 2007-2017 according to the type of cargo
shipped
|
Year |
Petroleum and its
derivatives |
Chemicals |
LNG and LPG |
Total |
||||
|
number of tankers |
cargo in ‘000
tonnes |
number of tankers |
cargo in ‘000
tonnes |
number of tankers |
cargo in ‘000
tonnes |
number of tankers |
cargo in ‘000
tonnes |
|
|
2007 |
14,343 |
367,249 |
3511 |
29,635 |
1458 |
48,564 |
19,312 |
445,448 |
|
2008 |
13,756 |
378,629 |
3843 |
34,226 |
1861 |
71,561 |
19,460 |
484,415 |
|
2009 |
14,059 |
424,172 |
4337 |
43,854 |
1684 |
59,591 |
20,080 |
527,618 |
|
2010 |
15,093 |
467,715 |
4607 |
48,393 |
1655 |
53,286 |
21,355 |
569,394 |
|
2011 |
15,861 |
536,895 |
4588 |
49,011 |
1831 |
66,776 |
22,280 |
652,682 |
|
2012 |
15,702 |
561,785 |
4534 |
49,854 |
1994 |
82,200 |
22,230 |
693,839 |
|
2013 |
16,125 |
567,950 |
4493 |
49,833 |
1999 |
87,060 |
22,617 |
704,884 |
|
2014 |
15,349 |
555,127 |
4629 |
51,924 |
2240 |
100,413 |
22,218, |
707,464 |
|
2015 |
14,676 |
567,341 |
5083 |
58,032 |
2303 |
94,072 |
22,062 |
719,445 |
|
2016 |
15,805 |
620,756 |
5209 |
60,336 |
2681 |
99,757 |
23,695 |
780,849 |
|
2017 |
16,895 |
702,926 |
4763 |
56,268 |
2753 |
116,642 |
24,411 |
875,837 |
Source:
https://www.mpa.gov.sg/web/portal/home/maritime-singapore/port-statistics
The port of Singapore also
provides supplies and repair services for vessels passing through the Strait of
Malacca. In 2017, out of the total number of 216,342 port arrivals, as many as
71,682 (33%) were due to an intent to replenish fuel or food supplies or to
perform repairs.[19]
9. CONCLUSIONS
The seaport has been
performing a key role in the Singaporean economy for years. The
government’s policy of maintaining low import tariffs affects the
port’s revenues, technological progress and dynamically growing trade
with China, Hong Kong, Indonesia, Japan, South Korea, Malaysia, Saudi Arabia,
the USA and the European Union. This small city-state has been consistently
implementing the policy of free trade, perceiving it as an opportunity for
further development and increasing competitiveness in relation to other
dynamically developing economies of Asia.
Singapore’s
particularly attractive investment climate and stable political environment
attract foreign direct investment from global investors and institutions. The business-friendly
environment is not only conducive to investment but also boosts the economy.
The service sector provides jobs for 80% of workers and creates more than 75%
of the GDP, while ca. 20% of the GDP is produced by the industry and the
secondary sector employs 15% of all the workforce. Additionally, a very
important factor in this context is the link between the businesses operating
in Singapore and state-owned enterprises. Business groups established as
holdings or trading companies create a larger outlet market and provide access
to foreign technologies or managerial methods. This is particularly important
for the development of key economic sectors such as trade, shipping and
logistics, all the more so since Singapore’s economic growth is heavily
dependent on exports, especially of electronics, petroleum products, chemicals,
medical and optical equipment, pharmaceuticals, as well as transport, business
and financial services.
Considered particularly
important in Singapore is its high-end manufacturing based on the latest
technologies, including semiconductors and consumer electronics, as well as
machinery, transport equipment and ships. Public funds are typically allocated
in sectors which may become the future of economic growth, such as aviation and
aeronautics, precision engineering and life sciences, including biotechnology,
medical equipment and pharmaceuticals. The Singaporean authorities are also
committed to investing in infrastructure projects and new industrial parks.
It should be noted that
Singapore suffered greatly from the global financial crises of 2001 and 2009,
having experienced some of the most severe recessions since it gained
independence. The collapse in prices in most of the world’s leading stock
exchanges and the abrupt drop in industrial production also exerted a negative
impact on its export-dependent economy, which declined by 1-2% at the time.
However, with time there was an observed rapid recovery and a return to dynamic
growth, both in the years 2004-2007 and in 2010, when the annual growth rate
came to 15.2%, one of the world’s highest.
Singapore is an active
member of NATO, ASEAN and other international trade organisations. The country
has entered into numerous free trade agreements, including the one signed with
the European Union in 2015 as the first ASEAN member state.
References
1.
Buková Bibiána, Eva
Brumerčíková, Pavlína Kolářová.
2015. “A study of a logistics transport chain in the transport of
selected commodity from eastern Europe to China”. Naše More 62(4): 256-263.
2.
Centre for Liveable Cities (CLC).
Available at:
http://www.clc.gov.sg/documents/books/research-workshop/2016/singapore-port-and-the-city-heart-of-innovation-presentation-paper.
3.
Civil Services
College. Available at: https://www.csc.gov.sg/articles/connecting-to-the-world-singapore-as-a-hub-port.
4.
Departament of Statistics Singapore.
Available at: https://www.singstat.gov.sg/modules/infographics/economy.
5.
Forbes. Available at: https://www.forbes.com/places/singapore/.
6.
Heng Derek. 2005.
„Continuities and Changes: Singapore as a Port-City over 700
Years”. Biblioasia. Singapore: National
Library Board (1): 12-16. ISSN 0219-8126.
7.
InterNations. Available at: https://www.internations.org/singapore-expats/guide/29457-economy-finance/the-economy-of-singapore-16045.
8.
InterNations. „The Economy of
Singapore”. Available at: http://www.internations.org/singapore-expats/guide/29457-economy-finance/the-economy-of-singapore-16045.
9.
Jurong Port. Available at: http://www.jp.com.sg/our-expertise/terminals/cement-terminal/.
10.
Jurong Port. Available at:
http://www.jp.com.sg/our-expertise/terminals/steel-terminal/.
11.
Maritime Singapore Connect. Available
at: https://www.maritimesgconnect.com/features/spotlight/5-things-you-should-know-about-new-tuas-mega-port.
12.
Maritime and Port Authority of Singapore
(MPA). Available at: http://www.mpa.gov.sg/web/portal/home/about-mpa.
13. Maritime
and Port Authority of Singapore (MPA). Available at: www.mpa.gov.sg/web/portal/home/maritime-singapore/port-statistics.
14. Ministry
of Trade and Industry, Singapur. Available
at: https://www.mti.gov.sg/.
15.
Ministry of Transport Connecting,
Singapore. Available at: https://www.mot.gov.sg/about-mot/sea-transport/advancing-the-maritime-industry.
16.
Obed Ndikom, Nwokedi Theophilus C., Sodiq
Olusegun Buhari. 2017. “An appraisal of demurrage policies and charges of
maritime operators in nigerian seaport terminals: the shipping industry and
economic implications”. Naše
More 64(3): 90-99.
17.
Ojadi Francis, Jackie Walters. 2015.
“Critical factors that impact on the efficiency of the Lagos
seaports”. Journal of Transport and
Supply Chain Management 9(a180): 1:13. ISSN: 2310-8789.
18.
Operating Revenue and
Total Expenditure as at 2017 estimate. Singapore Budget 2017. February 2017.
19.
Port of Singapore. Available
at: https://www.ship-technology.com/projects/portofsingapore/.
20.
PSA SINGAPORE. Available at: http://www.singaporepsa.com/about-us.
21.
Safety4Sea. Available at: https://safety4sea.com/shanghai-continues-as-the-worlds-busiest-container-port/.
22.
Singapore - Oil and Gas. Available at:
http://www.export.gov/article?id=Singapore-Oil-and-Gas.
23.
Sumayah Goolam Nabee, Jackie Walters.
2018. “Liner shipping cascading effect on Southern African Development
Community port strategies”. Journal
of Transport and Supply Chain Management 12(a394): 1:12. ISSN: 2310-8789.
24.
Tank news international. Available
at: https://www.tanknewsinternational.com/jurong-port-tank-terminals-officially-launched/.
25.
Temasek. Available at: http://www.temasek.com.sg/en/who-we-are/about-us.html.
26.
The Maritime Executive. Available
at: https://www.maritime-executive.com/article/two-new-berths-planned-for-cosco-psa-terminal-singapore.
27. The Straitstimes. Available at: https://www.straitstimes.com/business/an-icon-of-the-port-of-singapore.
28. The Straitstimes. Available at: https://www.straitstimes.com/business/tanjong-pagar-terminal-cleared-ahead-of-schedule.
29.
The
Straitstimes. Available at: https://www.straitstimes.com/singapore/full-steam-ahead-for-new-tuas-mega-port.
30. The Straitstimes. Available at: https://www.straitstimes.com/singapore/spore-plans-to-keep-port-attractive.
31.
The week in Asia. Available at: https://www.scmp.com/week-asia/business/article/2148878/singapores-tuas-mega-port-plain-sailing-ahead.
32.
World Bank. 2017. Doing Business 2018: reforming to create
jobs – Singapore (English). Doing Business 2018. Washington, D.C.:
World Bank Group.
33.
Yap C., R. Lum. 1990. “A
port’s story, a nation’s success”. Singapore: Times Editions.
Received 01.11.2019; accepted in revised form 22.12.2019
![]()
Scientific
Journal of Silesian University of Technology. Series Transport is licensed
under a Creative Commons Attribution 4.0 International License