Article
citation information:
Mindur,
M. The development of sea transport in South Korea
between 2002-2017. Scientific Journal of Silesian University of
Technology. Series Transport. 2019, 105,
183-199. ISSN: 0209-3324. DOI: https://doi.org/10.20858/sjsutst.2019.105.15.
Maciej MINDUR[1]
THE
DEVELOPMENT OF SEA TRANSPORT IN SOUTH KOREA
BETWEEN 2002-2017
Summary. The transformation of South Korea from one of the
poorest countries in the world in the 1950s to an industrial power and a member
of OECD was exceptionally fast. The policy promoting the import of raw
materials and the latest technologies enabled Korea to join the group of the
most rapidly growing economies in the world in 2004. Such an imposing growth
rate was the result of booming industrial production, trade expansion to Asian,
American and European markets and a liberal economic policy. The Korean economy
is the most foreign-trade dependent country of all OECD members, with sea
transport playing a predominant role. This article analyses basic Korean
macroeconomic indicators within 2002-2018, with particular emphasis on the GDP.
It discusses sea transport figures, including the cargo handling capacity of
Korean ports, as well as port and logistics operations and the throughput of
Busan, the largest South Korean and one of the largest seaport in the world.
Additionally, this article shows innovation and ecology focus in the port of
Busan, and primary directions of the state policy in the field of
environmentally friendly growth.
Keywords: South Korea, port of
Busan, cargo handling, modern technology, ecology
1. INTRODUCTION
Next to Taiwan,
Singapore, Malesia and Thailand, South Korea is considered as one of the newly
industrialised countries. These countries have a relatively developed public
sector, reduced income disparities and high labour productivity. All
above-mentioned countries noted rapid economic growth due to their offensive
export policy and specialisation in manufacturing of highly processed
industrial goods, which require the latest technologies.
The transformation of
South Korea from one of the poorest countries in the world in the 1950s to an
industrial power and a member of OECD was exceptionally fast (South Korea is a
member of various international organisations, such as UN, G-20, Association
of Southeast Asian Nations and World Trade Organization). The policy promoting
the import of raw materials and the latest technologies enabled Korea to join
the group of the most rapidly growing economies in the world in 2004. Such an imposing
growth rate was the result of booming industrial production, trade expansion to
the Asian, American and European markets and a liberal economic policy[2].
In 2018, South Korea was the seventh largest
exporter and 11th largest economy in the world[3].
The Korean shipbuilding
industry, competing with that of China and Japan, significantly contributes to
the growth of the South Korean economy. In the
1970s and 1980s, South Korea became the lead producer of ships, including
supertankers and oil rigs[4]. The country has maintained this status until today.
Such
a fast economic growth needs to be matched with large capacity
handling seaports. Busan, the largest South Korean transhipment
port of south-east Asia and the fifth busiest container port in the world[5], boasts of
its outstanding results in this area.
2. SOUTH
KOREAN ECONOMY
The development strategy
of South Korea, a country that inherited industry, infrastructure and
bureaucracy from Japan after the Japanese occupation, followed the footsteps of
the same country. Therefore, after economic difficulties, the country started a
phase of rapid economic growth as late as 1963[6].
Still, in the 1960s, the GDP per capita in South Korea was comparable to that
of poorer countries in Africa and Asia. However, it grew from 6% of the OECD average in 1970 to 89% in 2017[7].
In 2002–2008, the
GDP was stable (with 4.65% average growth), whereas the lowest level was noted
in 2009 (0.7%) as a result of a drop in export due to the global economic
crisis. Nevertheless, due to direct stimulation
measures implemented by the Korean government and strong domestic consumption,
which compensated major reduction of exports, the Korean economy avoided
recession contrary to the majority of industrialised economies, and the country
noted positive economic growth in two consecutive years into the crisis. In
2010, the GDP growth was 6.5%, until 2018 when the economic growth slightly
slowed down (with average annual growth of 3%). Initially, it was the result of
shrinking domestic consumption and investment, and recently also the result of
the downturn in exports, the economic slowdown in China and US customs policy
towards Chinese goods (Tab. 1)[8].
In the period concerned, the unemployment rate was low and stable (from
3.1 to 3.8%).
Tab. 1
Basic macroeconomic figures in Republic of Korea in
2002-2018 (annual change in %)
|
Item |
2002 |
2003 |
2004 |
2005 |
2006 |
2007 |
2008 |
2009 |
2010 |
2011 |
2012 |
2013 |
2014 |
2015 |
2016 |
2017 |
2018 |
|
GDP |
7,4 |
2,9 |
4,9 |
3,9 |
5,2 |
5,5 |
2,8 |
0,7 |
6,5 |
3,7 |
2,3 |
2,9 |
3,3 |
2,8 |
2,9 |
3,1 |
2,7 |
|
Private
consumption |
8,9 |
-0,5 |
0,3 |
4,4 |
4,6 |
7,2 |
6,0 |
2,7 |
7,0 |
6,7 |
4,2 |
2,9 |
2,8 |
3,1 |
2,5 |
2,6 |
2,8 |
|
Total
investment |
6,9 |
4,8 |
2,9 |
2,0 |
3,6 |
5,0 |
-0,9 |
0,3 |
5,5 |
0,8 |
-0,5 |
3,3 |
3,4 |
5,1 |
5,6 |
8,6 |
1,6 |
|
Unemployment
rate |
3,3 |
3,6 |
3,7 |
3,7 |
3,5 |
3,2 |
3,2 |
3,6 |
3,7 |
3,4 |
3,2 |
3,1 |
3,5 |
3,6 |
3,7 |
3,2 |
3,8 |
|
Government
gross debt (% GDP) (surplus/deficit) |
3,5 |
1,6 |
0,1 |
0,9 |
1,1 |
2,2 |
1,4 |
-1,5 |
1,3 |
1,4 |
1,3 |
1,0 |
0,6 |
0,0 |
1,0 |
1,4 |
1,7 |
|
Current
account balance |
0,8 |
1,8 |
3,9 |
1,4 |
0,4 |
0,9 |
0,2 |
3,7 |
2,6 |
1,4 |
4,0 |
5,9 |
5,9 |
7,6 |
6,9 |
4,9 |
4,7 |
|
Export |
13,0 |
13,9 |
20,6 |
7,8 |
12,1 |
12,7 |
7,5 |
-0,3 |
12,7 |
15,1 |
5,1 |
4,3 |
2,0 |
- 0,1 |
2,6 |
1,9 |
5,5 |
Source: The World Bank
Of all OECD countries,
the Korean economy is the most dependent on foreign trade, which accounts for
over 80% of its GDP, whereas goods and services exported
from South Korea account for 43.1% of the total Korean production. The
most important trade partner for South Korea is China. In 2018, China’s
import of Korean goods (chiefly electronic components) was 26.8% of the Korean
exports. An equally important trade partner was the United States (12.1%),
Vietnam (8%), Hong Kong (7.6%) and Japan (5.1%). As regards the continental
distribution of Korean exports, Asia accounts
for two thirds (67%) in terms of the value, North America 14.9%, and Europe
11.4% (including Germany 1.5%)[9]. The most valuable outbound shipments include
electronic chips, refined oil products (oils), cars and spare parts and
accessories.
Tab. 2
Main
exports from South Korea
|
Item |
Value, in bn USD |
% of total export |
|
Electrical machinery, equipment |
184,6 |
30,5 |
|
Machines including computers |
77,7 |
12,8 |
|
Vehicles |
61,2 |
10,1 |
|
Mineral fuels including oil |
48,2 |
8,0 |
|
Plastics, plastics articles |
34,9 |
5,8 |
|
Optical, technical and medical apparatus |
27,8 |
4,6 |
|
Organic chemicals |
25,4 |
4,2 |
|
Iran, steel |
24,8 |
4,1 |
|
Ships, boats |
20,3 |
3,4 |
|
Articles of iron or steel |
10,5 |
1,7 |
Source: http://www.worldstopexports.com/south-koreas-top-10-exports/
The strengths of the
Korean economy include its competitive factors. GDP spending on research and
development (R&D) has been growing as well as the manufacturing of hi-tech
products, which are the main export goods. Globally recognised Korean companies
include Samsung, Hyundai, LG and Kia Motors.
3. SOUTH
KOREAN SEA TRANSPORT
Sea transport plays an
important role in South Korean trade, especially as it has a land border with
North Korea only. Across its territorial waters, South Korea borders Japan in the east and south and China in the west. Since
the country is separated from the Asian mainland, Korean ports are
tremendously important in export and import[10].
South Korea has a large
number of various shipping companies. At the same time, the prolonged
stagnation on the container transport market and heavy competition translated
into a crisis for South Korean shipping companies. In 2017, Hanjin Shipping,
the seventh largest container transport company in the world, went bankrupt.
Therefore, the Korea Shipping Partnership, a coalition of 14 South Korean
container transport companies, was formed to strengthen the domestic sea
shipping sector and regain trust among previous foreign trade partners. The
alliance was aimed at enhancing the competitiveness of the domestic
container-shipping sector, among others, by opening new shipping lines,
cooperation in developing the fleet, provision of joint services at
international terminals and consultations on the reduction of operating costs.
In the 1970s and 1980s, South Korea had become the
leading global manufacturer of ships, including supertankers and oil rigs. The
main shipbuilding company in Korea is Hyundai, which in the middle of 1970s
built the Ulsan Shipyard. Today, the
shipyard operates ten dry docks with nine Goliath cranes. This enables the
production of virtually any type and size of ship. Until 2018, the
shipyard built over 2119 ships for 324 ship owners from 52 countries[11]. In
2017, Daewoo Shipbuilding secured a contract worth 4.8 bn USD for 15 ice class
arctic tankers to transport LNG from the Russian Jamal LNG Terminal. The
government of South Korea developed a program worth 1.9 bn USD to support shipbuilding
companies in winning more projects, in particular for LNG carriers[12].
The 2018 order by Hyundai
Merchant Marine provides for 20
mega-container vessels (twelve of 23 thou. TEU and eight of 14 thou. TEU) to be
built by Daewoo Shipbuilding & Marine Engineering, Hyundai Heavy Industries
and Samsung Heavy Industries. Moreover, Korean shipyards stand much
chance to win one of the largest contracts ever for about 60 LNG carriers for
Qatar[13].
The said bankruptcy of
Hanjin Shipping, which dramatically reduced sales figures in the Korean
shipping sector, forced the government to focus on strengthening the
shipbuilding industry. Specific steps include a three-year plan of building 200
ships by Hyundai Merchant Marine,
included 140 bulk carriers and 60 container carriers[14]. Moreover, the government undertook to adjust ships to stringent environmental regulations
adopted by the International Maritime Organization (IMO) pertaining to the reduction of sulfur oxides (SOx)
emission from ships. Begining from 2020, the global sulfur cap is going
to be 0.5% m/m.
In
2017, the Republic of Korea had 1907 ships, including 89 container carriers,
394 general cargo vessels, 201 tankers and 1123 other ships[15].
In 2017, the total cargo handling capacity of Korean ports was 1164 m tons, which accounted for 1.6 times increase from 737 m tons in 2007 and 2.4 times compared to 2002. When compared with 2016, cargo handling increased by 23.653 m tons (2.1%). The total capacity of vessels under the national flag was 45.729 m. Compared with the previous year, the capacity increase by 1134 m tons (2.5%) as regards tonnage, by 965 thou. tons (1.9%) in DWT and nearly 106 thou. TEU (44.9%)[16]. Tab. 3 Cargo handling by ports and ships registered under the Korean flag
Year |
Cargo handling capacity, in thou. tons |
Ships under the national flag |
||
Tonnage (tons) |
DWT (tons) |
Containers (TEU) |
||
2002 |
486 889 |
15 295 015 |
- |
- |
2007 |
737 456 |
24 139 666 |
- |
- |
2010 |
928 524 |
31 285 948 |
- |
- |
2012 |
1 017 190 |
40 128 889 |
- |
- |
2013 |
1 024 977 |
43 709 221 |
- |
- |
2014 |
1 109 669 |
46 196 572 |
50 378 310 |
471 976 |
2015 |
1 139 693 |
46 498 120 |
50 962 232 |
516 606 |
2016 (A) |
1 140 799 |
44 595 009 |
50 482 148 |
235 003 |
2017 (B) |
1 164 452 |
45 728 557 |
51 446 672 |
340 514 |
Change |
23 653 |
1 133 548 |
964 524 |
105 511 |
Rate (%) |
2,1 |
2,5 |
1,9 |
44,9 |
Source: Explore Korea through Statistics 2018, p. 72.
Six Korean major ports
are located on the coast, including the largest port of Busan. Other large
ports include Gunsan (Kunsan), Gwangyang,
Incheon, Masan, Mokpo and Ulsan.
In total, in 2017, South Korean ports handled 1.57 bn
tons of cargo. Compared to the previous year, it counted for an increase of
4.1%. The largest increase was noted in the transport of vehicles (14.4%),
lignite (11.6%) and machinery (8.3%), whereas in the handling of sand and steel,
the sector noted a decrease of 35.9 and 12.8%, respectively. At the same time,
container handling increased by 1.7% to 1.09 bn tons, whereas the container
transport increased by 5.4% to 27.42 bn TEU.
In 2017, ports of Busan, Gwangyang and Incheon noted an increase in
cargo handling by 10.5, 3.1 and 2.4%, respectively, chiefly due to the growing
export of vehicles and import of coal and machinery. The contribution of those
ports to the total container traffic in Korean ports is shown in Fig. 1. In
2017, the Port of Busan handled 400.5 m tons of cargo, Gwangyang 291.83 m tons,
and the port of Ulsan 202.36 m tons. Increased demand for microchips and
petrochemical products translated into the increase in export to China by 9%,
and to the United States by 6.7%[17].
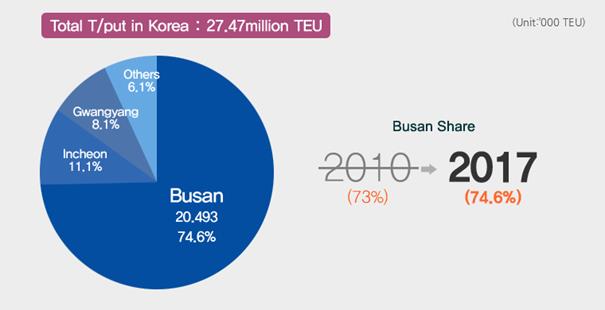
Fig.
1. Container handling in ports of Busan, Gwangyang and Incheon in 2017
Source: http://www.busanpa.com/eng/Contents.do?mCode=MN0042
Fig. 2. Container traffic in the ports of the Republic of Korea in 2002–2017 (million TEU)
Source:
https://data.worldbank.org/indicator/IS.SHP.GOOD.TU?end=2017&locations=KR&name_desc=true&start=2000&view=chart
4.
PORT AND LOGISTICS ACTIVITY IN THE PORT OF BUSAN
The largest Korean
port of Busan is situated at the estuary of the
Naktong River. In 2016, it was the largest cargo port in South-East Asia and the fifth busiest container port in the world[18],
and in 2017, it was the sixth largest port regarding container handling (Tab.
4). The length of the coastline of the port is 26.8 km. Thus, enabling the
mooring of 169 ships at the same time, including passenger and oil terminals,
and handles 91 m tons annually[19].
Tab. 4
Containers handled in ten
busiest ports in the world in 2016
|
Position |
Port |
2016 |
2017 |
Increase, in % |
|
1 |
Shanghai |
37 133 |
40 300 |
8,5 |
|
2 |
Singapore |
30 904 |
33 666 |
8,9 |
|
3 |
Shenzhen |
23 997 |
26 000 |
7,3 |
|
4 |
Ningbo |
21 560 |
25 970 |
20,4 |
|
6/5 |
Hong Kong |
19 579 |
20 750 |
4,8 |
|
5/6 |
Busan |
19 456 |
20 473 |
5,2 |
Source:
https://english.busan.go.kr/bsport
The
port of Busan consists of four modern sections: North Port, South Port, Gamcheon Port and Dadaepo Port. It also includes
five container terminals and three passenger terminals. The port infrastructure
is complemented by well-equipped logistics centres.
The North Port handles both
passengers and cargo, and its capacity is extended by the Gamcheon Port (ship
technology). In the South Port is located the Busan Cooperative Fish Market,
the largest fish processing hub in Korea, dealing with 30% of the total sea
catch. It operates processing plants and cold storage facilities necessary to
support fish product retail. Located
in the west is the Dadaepo Port, which
previously handled ships scheduled for maintenance and passenger vessels, and
supports coastal fishing. Although the port
meets all requirements of an environmentally friendly port, it will be
transformed into an ecological port in the future.
The
Jaseongdae container terminal occupies an area of 624 km2. It is
operated by Hutchison Korea Terminals Co. The terminal berth of 1447 m can
receive four ships of up DWT 50 thou. at once. The annual cargo handling
capacity of the terminal is 1.7 m TEU.
UAM,
another container terminal, occupies 182 km2 and the length of its
berth is 500 m. It can handle one ship of DWT 20 thou. and two ships of 5 thou.
tons. The annual cargo handling capacity of the terminal is 300 thou. TEU.
Yet
another container terminal Gamman of 727 km² is operated by four companies, namely, Global Enterprises, Hanjin Shipping,
Korea Express and Hutchison Korea Terminal Ltd. The terminal is furnished with
modern container handling equipment. The length of the berth is 1400 m and it
is sufficient for mooring four vessels of up to DWT 50 thou. The annual cargo
handling capacity of the terminal is 1.56 m TEU.
Opened
in June 1991, the Sinseondae container terminal of 1170 km² is equipped
with advanced loading and unloading systems, including large speed container
cranes capable of handling Post-Panamax container carriers. The operator for
the terminal is CJ Korea Express Busan Container Terminal Co. Ltd. Some of the
facilities include a berth of 1500 m capable of receiving five ships of up to
DWT 50 thou. The annual cargo handling capacity of the terminal is 2 m TEU.
Singamman,
a container terminal established in April 2002, is operated by Dongbu Busan
Container Terminal Co. Ltd. Its berth of 826 m enables handling of two vessels
of DWT 50 thou. and one of DWT 5 thou. It occupies an area of 294 km² and
has an annual cargo handling capacity of 780 thou. TEU.
Since August 2012, the Busan Port International Ship
Chandling Center has been operating in the port
of Busan. A complex of five-level buildings of over 33 thou. m2
house, most modern warehouses and offices. The centre supports airports,
seaports and rail hubs providing comprehensive administration, logistics and
port services necessary to promote efficient shipments.
In
1997, to improve the attractiveness of port services and guarantee speedy and
efficient cargo handling, the decision to develop a new technologically
advanced mega-port of Busan New Port (BPA)
was made. The first stage of the port development was implemented by 2006, and
its completion is scheduled for 2020.
The deep-sea Busan
New Port (draft in excess of 17 m) is situated west of the old port on the Island of Gaduk. It is furnished
with modern technological equipment and infrastructure, including innovative
automated systems (for example, latest berth-side cranes, UAVs, automated
gantry cranes, real-time monitoring systems) capable of handling vessels of 19
thou. TEU. The current 23 berthing facilities for container carriers (target is
45) are suitable for handling 10 m TEU annually[20].
1 5 4 3 2![]()
![]()
![]()
![]()
![]()
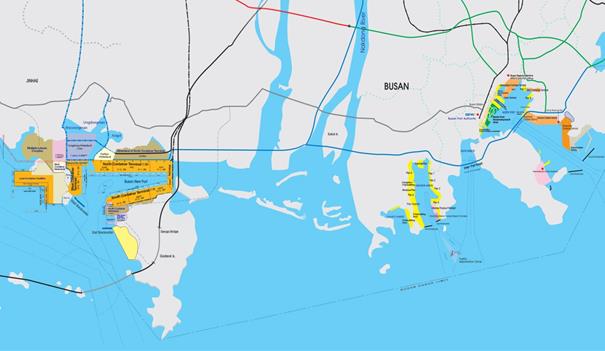
Fig. 3. Ports of Busan (left: 1 – Busan New
Port, 2 – Dadaepo Port, 3 – Gamcheon Port, 4 – South Port, 5
– North Port)
Source:
http://www.busanpa.com/eng/Contents.do?mCode=MN0031
Tab. 5
Current status and particulars of container terminals in the port of
Busan
|
|
Jaseongdae |
Shinseondae |
Gamman |
Shingamman |
Uam |
|||
|
Total area (thou. ㎡) |
624 |
1170 |
727 |
294 |
182 |
|||
|
CY area (1000㎡) |
335 |
804 |
384 |
153 |
156 |
|||
|
Berth length (m) |
1447 |
1500 |
1400 |
826 |
500 |
|||
|
Capacity (DWT) |
50,000 × 4 |
50,000 × 5 |
50,000 × 4 |
50,000 × 25,000
× 1 |
20,000 × 1 5,000
× 2 |
|||
|
Capacity (1000 TEU) |
1722 |
2236 |
1600 |
819 |
300 |
|||
|
Draft (m) |
15 |
15 ~ 16 |
15 |
15 |
11 |
|||
|
In operation since |
1978/9 |
1991/6 |
1998/4 |
2002/4 |
1996/9 |
|||
|
Operator |
Korea Huchson Terminal
Co., Ltd. |
KBCT |
BICT, BGCT |
Dongbu Busan Co., Ltd. |
- |
|||
|
Busan New Port |
||||||||
|
|
Jetty 1 |
Jetty 2 |
Jetty 3 |
Jetty 4 |
Jetty 5 |
|||
|
Total area (thou. ㎡) |
840 |
1210 |
688 |
553 |
785 |
|||
|
CY area (1000㎡) |
282 |
525 |
346 |
213 |
154 |
|||
|
Berth (m) |
1200 |
2000 |
1100 |
1150 |
1400 |
|||
|
Ship handling in DWT |
50,000 × 3 |
50,000 × 6 |
50,000 × 6 |
50,000 × 2 |
50,000 × 4 |
|||
|
Capacity |
2091 |
3677 |
2310 |
1936 |
2440 |
|||
|
Draft (m) |
16 |
16 ~ 17 |
18 |
16 ~ 17 |
17 |
|||
|
In operation since |
2010/3 |
2006/1 |
2009/2 |
2010/2 |
2012/1 |
|||
|
Operator |
PNIT |
PNC |
Hanjin New Port
Company Terminal (HJNC) |
Hyundai Pusan New-Port
Terminal, Ltd. |
BNCT Inc. |
|||
Source:
https://english.busan.go.kr/bsport
In the Busan New Port – Distripark
(Fig. 4), an integrated logistics complex still under construction, companies
will be able to provide logistics, distribution and shipping services to international
businesses, as well as companies based in the Free Economic Zone of Busan-Jinhae.
Distripark has been designated as a free
trade zone where foreign logistics businesses can enjoy affordable rent and tax
exemptions. The total logistics operation area of 8.5 km2 is
expected to support processing, storage, sorting, labelling, testing, packaging
and warehousing of goods shortly before their delivery to customers, as well as
disassembly/assembly services for automotive components and door-to-door
service. Distripark has access to all modes of
transport, including seaports, airports, rail and road. The completion
of the project is scheduled for 2030[21].
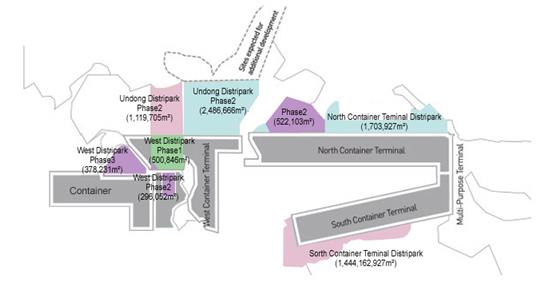
Fig. 4.
Distripark Plan
Source: http://www.busanpa.com/eng/Contents.do?mCode=MN0068
The Busan New Port uses the latest technologies and facilities. For
example, at
jetty 5, due to the vertical automation project and latest operating equipment,
stevedoring equipment in each section can operate independently which
translates into high productivity. The number of trucks entering the port is
limited to reduce congestion and risk of accidents, as well as the CO2
emission. The jetty 5 operation system is shown in Fig. 5. The figure includes 1) loading/unloading of containers
to/from a ship using a container crane, 2) transfer of cargo to the berth – a frame bridge vehicle transports
containers from the ship side (inner wall) to the container yard at the
waterfront, 3) port services – container yard operation is fully
automated, including an automatic gantry crane and transport of containers from
the container bay to the seaside (automatic loading section) or the ground side
(external truck operation), 4) crossing
the gate – when a truck approaches the gate, the
RFID system checks its ID data. At the same time, the monitoring system at the
gate identifies the container. When the container passes the gate, the system
designates a working area and directs the driver to the relevant section.
BPA also plans to
facilitate the flow of cargo between the old and new ports (a distance of 25
km) and it is now implementing an inter-terminal transfer (ITT) platform to
optimise truck operation between the two facilities, as well as to reduce
overall cost[22].
Since the measures are a part of a long-term strategy, BPA is going to consider
subsidising certain costs incurred by shipping companies.
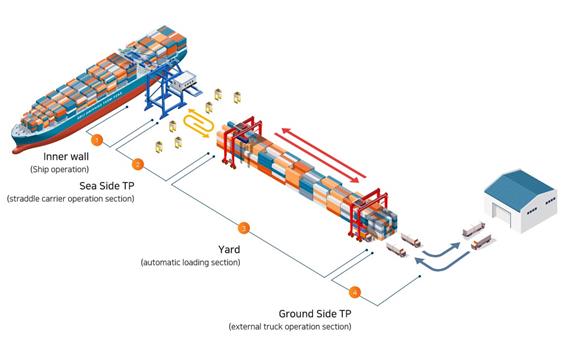
Fig.
5. Cargo handling at jetty 5 in Busan New
Port
Source: https://www.intergis.co.kr/eng/CMS/Contents/Contents.do?mCode=MN061
5. CAPACITY OF BUSAN
SEAPORT
The
port of Busan handles nearly 40% of the total cargo volume transported by sea,
80% containers and 42% domestic fish catch and fish products. The port handles
130 ships per day. The number of containers handled in the port has been
gradually growing. In 2017, the port handled 20.5 m TEU, which accounted for
42% increase compared with 2005 and 5% compared with 2016.
In
2017, the port of Busan handled 5,022,321 TEU in import, 5,143,952 TEU in
export and 10,225,417 TEU in transhipment (T/S). The total 2017 container
handling in the port was 20,493,475 TEU (Table 6).
Tab. 6
Containers throughput in the port of Busan in import, export and T/S in
2004-2017 (in TEU)
|
Year |
Total traffic |
Inbound |
Outbound |
T/S |
Coastal |
|
2017 |
20 493 475 |
5,022,321 |
5,143,952 |
10.225.417 |
81 785 |
|
2016 |
19 456 291 |
4,801,127 |
4,819,339 |
9,835,826 |
0 |
|
2015 |
19,486,725 |
4,713,229 |
4,650,168 |
10,105,318 |
10 |
|
2014 |
18 683 283 |
4,596,287 |
4,657,639 |
9,429,355 |
3 |
|
2013 |
17,686,099 |
4,424,105 |
4,509,339 |
8,748,453 |
4,202 |
|
2012 |
17,040,567 |
4,381,636 |
4,426,418 |
8,142,052 |
90 461 |
|
2011 |
16,184,706 |
4,402,736 |
4,305,315 |
7,352,539 |
124,116 |
|
2010 |
14,194,334 |
3,913,611 |
3,922,723 |
6,276,458 |
81,542 |
|
2009 |
11 980 325 |
3 266 708 |
3 302 018 |
5,372,485 |
39.114 |
|
2008 |
13 452 786 |
3,853,127 |
3,784,946 |
5,807,848 |
6 865 |
|
2007 |
13 261 484 |
3,752,747 |
3,691,003 |
5,811,167 |
6567 |
|
2006 |
12 038 786 |
3,429,141 |
3,374,042 |
5,207,731 |
27 772 |
|
2005 |
11 843 151 |
3,309,202 |
3,270,036 |
5,178,798 |
85115 |
|
2004 |
11 491 968 |
3,286,361 |
3,308,609 |
4,791,942 |
105 056 |
Source: http://www.busanpa.com/eng/Contents.do?mCode=MN0042
6. INNOVATION AND ENVIRONMENTAL APPROACH IN PORT OF BUSAN
The
ever increasing sizes of vessels and growing volumes of cargo in ports
necessitated innovation. In order to preserve competitiveness, new technologies
are introduced globally, such as combined data exchange platforms, cloud
services and mobile devices[23].
Furthermore, the port of Busan is modernising its infrastructure in line with
the latest trends to catch up with global leaders, in particular, Chinese ports
that dominate in the region.
In
2019, the port plans to introduce the IoT platform together with KL-NET[24].
KL-Net supports electronic data exchange (EDI) in logistics, integration of
systems, IT advisory and logistics solutions for the maritime industry in South
Korea[25].
The system supports, among others, electronic exchange of the entry/leave declaration,
cargo declaration, as well as reservation, bill of lading, transport and
shipment. After the introduction of the system, IoT sensors in containers will
enable real-time information exchange, including location, ambient temperature
and humidity of cargo.
The port of Busan uses
the Tandem-40' system that enables the simultaneous handling of two 40' or four
20’ containers. Modern quayside cranes can load up to 8 levels of
containers on a ship (11 pcs) and 10 levels (1 pcs) in the case of standard containers.
It is also possible to stack 24 rows (width of container stacking). The tandem
system can handle from 35 to 40 containers, whereas regular cranes handle from
25 to 30 containers[26].
Cargo handling is supported by 38 unmanned
automatic electric cranes (ATC) in the Hyundai
Busan Newport Terminal.
The Port of Busan is interested in using the blockchain technology[27] that helps to reduce cost related to paper freight documentation and customs payments. Such a decentralised and distributed database of transactions is accessible over the internet and can be used for recording individual transactions, payments and accounting records. The blockchain technology does not require the operation of central computers and does not have a centralised data storage. At the same time, the coding based on encryption algorithms makes it resistant to cyberattacks. The blockchain technology is already used to protect data of containers, tracing and tracking of cargo in Antwerp and Rotterdam[28].
In line with the Framework Act on Low Carbon, Green Growth, adopted by the Korean government in 2010, the port of Busan promotes “green management of port operations”[29]. Diesel engines in a number of machines and equipment have been replaced with electric ones which significantly reduced the emission of greenhouse gases. With the aim of improving energy efficiency, roofs of warehouses and gates are furnished with PV panels, and office facilities in the New Port of Busan also use geothermal and solar energy. Moreover, ships of higher Environmental Ship Index[30] may enjoy exemptions or reduced rates of port fees.
In 2018, the Port of Busan
entered into a cooperation contract with Korea Gas Corporation (KOGAS) to
develop a bunkering system in the port. Both companies undertook to develop a
feasibility study for the LNG bunkering method to
supply LNG to ships entering the port of Busan. Under the project, the parties
are going to examine LNG bunkering systems and various business issues, and in
2019, a floating LNG bunkering terminal would be built. A gradual shift to LNG
propulsion in the national fleet is expected to significantly reduce the emission of
solid particles from ships. According to the
governmental agency, the emission from ships of total sulfur oxides and solid
particles account for 73 and 51%[31], respectively, in
the city of Busan
7. SUMMARY The multiple-year government intervention and investment in modern technologies made South Korea one of the most developed economies in the region. The government focuses on the development of the industry and speedy implementation of new technologies in existing and new facilities to expedite economic growth, boost production of goods, especially those to be exported to foreign markets, and develop competitive advantages. Not without significance was the financial aid for the South Korean economy granted by the United States (in 1946–1978, the United States offered about 60 bn USD in grants and loans). Yet another important factor was the financial crisis of 1997, triggered by the bankruptcy of six out of the thirty largest industrial conglomerates (chaebol). Then, the Korean government received a loan of 58 bn USD from the International Monetary Fund. The loan was granted with conditions that Korea tightens its fiscal and monetary policy and engage in far-reaching market reforms in sectors of finance and corporations, as well as the labour market policy. Additionally, South Korea agreed to open its economy to foreign goods and investors[32].
The South Korean maritime policy has been shaped by three major factors, namely, the geopolitical situation, shortage of natural resources and the socio-economic program. The latter led to the creation of new jobs in the 1980s, the establishment of the pension system and improvement of the living standard. Therefore, the role of Korean ports in the national economy is particularly important, since they account for 99% of inbound and outbound goods[33].
The concentrated activity enhanced the position of the port of Busan and turned it to one of the most important logistics centres in South-East Asia. One of its advantages is the strategic location on the crossroads from North-East China, Japan and Russia, within the main transport corridor to Europe and America. The port of Busan enjoys excellent natural conditions, such as sheltering by nearby mountains and islands, considerably limited ebbs and three main sea routes in the vicinity.
According to the mid-term and long-term strategic plans of the Port of Busan, the quality of port services should improve to reach 30 m TEU by 2025. The modernisation and extension of the port, implementation of modern cargo handling technologies and the building of a broad logistics network to establish a mega-hub is to attract global companies and enhance the creation of new jobs. Activities planned are accompanied by incentives to establish one’s business in the port, such as tax and customs exemptions and business consulting[34].
Korea
is at the forefront of green growth initiatives. The 2009-2050 National
Strategy for Green Growth and the five-year plan (2009-2013) established a
comprehensive state policy framework in Korea, promoting environmentally
friendly growth both short and long-term. In the longer-term perspective, the
National Strategy for Green Growth is designed to promote new
initiatives to improve the status of the natural environment and living
standards for citizens, as well as active participation in international
climate change programs.
References
1.
BCG. To Get Smart, Ports Go Digital. Available at: https://bcg.com/publications/2018/to-get-smart-ports-go-digital.aspx.
2.
Bloomberg. Available at:
https://www.bloomberg.com/research/stocks/private/snapshot.asp?privcapId=9637232.
3.
Buková Bibiána, Eva
Brumerčíková, Pavlína Kolářová.
2015. “A study of a logistics transport chain in the transport of
selected commodity from eastern Europe to China”. Naše More 62(4): 256-263.
4.
Busan Port. Available at: https://www.busanpa.com/eng/Contents.do?mCode=MN0031.
5.
Busan
Port Logistics. Available at: https://english.busan.go.kr/bsport.
6.
Busan Port Authority. Available at: http://www.busanpa.com/eng/.
7.
Busan Regional Office of Oceans and
Fisheries. Available at: http://portbusan.go.kr/eng/contents/intr010101.jsp.
8.
Dynamic BUSAN. Available at: https://www.investkorea.org/busan_en/project/project.do?mode=view&articleNo=202208.
9.
EveryCRSRReport.com, South Korea-U.S.
Economic Relations. Available at: https://www.everycrsreport.com/reports/RL30566.html#_Toc228343868.
10. Explore
Korea through Statistics 2018.
11. GreenPort, Environmental
Stewardship at Busan. Available at: https://www.greenport.com/news101/asia/environmental-stewardship-at-busan.
12. GreenPort, Port
of Busan Bunkering Agreement. Available at: https://www.greenport.com/news101/lng/port-of-busan-bunkering-agreement.
13.
Indexmundi. Available at: http://www.indexmundi.com/south_korea/merchant_marine.html.
14.
INTERGIS.
Available at: https://www.intergis.co.kr/eng/CMS/Contents/Contents.do?mCode=MN061.
15. Knoema. Available at: https://knoema.com/atlas/Republic-of-Korea/Current-account-balance-as-a-share-of-GDP.
16. Lee K. South Korea’s Infrastructure
Vision, Reconnecting Asia. 2018. Available at: https://reconnectingasia.csis.org/analysis/entries/south-koreas-infrastructure-vision/.
17. List of ports in South Korea. Available
at: https://www.searoutes.com/country-ports/South-Korea.
18.
Medium. South Korean Blockchain Week in
Busan -Lucid Crypto and Module Token. Available at: https://medium.com/@nakanishi.g1106/south-korean-blockchain-week-in-busan-lucid-crypto-and-module-token-f605f2d5de8c.
19. Mindur
L. (Ed.). 2014. Technologie transportowe.
[In Polish: Transport technologies]. Radom: ITE-PIB.
20. Mindur M. (Ed.). 2017. Logistyka. Nauka-badania-rozwój
[In Polish: Logistics.
Science-research-development]. Radom: ITE-PIB.
21. Mindur M. 2010. Transport w erze globalizacji. [In Polish:
Transport in the age of globalization]. Radom: ITE-PIB.
22.
Obed Ndikom, Nwokedi Theophilus C., Sodiq
Olusegun Buhari. 2017. “An appraisal of demurrage policies and charges of
maritime operators in nigerian seaport terminals: the shipping industry and
economic implications”. Naše
More 64(3): 90-99.
23.
OECD Better Policies for Better Lives.
Available at: http://www.oecd.org/economy/korea-economic-snapshot/.
24.
Port Technology. Available at: https://www.porttechnology.org/news/busan_in_massive_10bn_expansion_plan.
25.
PortalMorski.pl: South Korea orders 200
ships. Available at: https://www.portalmorski.pl/stocznie-statki/38944-korea-poludniowa-zamawia-200-statkow.
26.
PSA HPNT. Available at:
https://www.hpnt.co.kr/homepage/eng/webpage/ter_equ.jsp.
27.
Safety 4Sea. Available at: https://safety4sea.com/south-korean-ports-see-4-1-volume-increase-in-2017/.
28. Ship Technology.
Available at: https://www.ship-technology.com/projects/hyundai-heavy-industries-ulsan-korea/.
29.
Ship Technology. Available at: https://www.ship-technology.com/projects/portofbusan/.
30. The World Bank.
Container port traffic. Available at:
https://data.worldbank.org/indicator/IS.SHP.GOOD.TU?end=2017&locations=KR&name_desc=true&start=2000&view=chart.
31.
The Korea Bizwire. Available at:
http://koreabizwire.com/busan-port-incorporates-iot-to-boost-competitiveness/77548.
32.
The Wall Street Journal, Korea’s
Mega-Merger of Shipyards Set to Dominate Global Shipbuilding. Available at: https://www.wsj.com/articles/koreas-mega-merger-of-shipyards-set-to-dominate-global-shipbuilding-11549475888.
33.
The World Bank. Available at: https://data.worldbank.org/indicator/NY.GDP.MKTP.KD.ZG?locations=KR.
34.
The World
Factbook. Available at: https://www.cia.gov/library/publications/the-world-factbook/geos/ks.html.
35.
World Shipping Council. Available at: http://www.worldshipping.org/about-the-industry/global-trade/top-50-world-container-ports.
36.
World's Top Exports. Available at: http://www.worldstopexports.com/south-koreas-top-10-exports/.
Received 14.09.2019; accepted in revised form 09.11.2019
![]()
Scientific
Journal of Silesian University of Technology. Series Transport is licensed
under a Creative Commons Attribution 4.0 International License