Article
citation information:
Klos, M.J., Sobota, A. Performance evaluation
of roundabouts using a microscopic simulation model. Scientific Journal of Silesian University of Technology. Series
Transport. 2019, 104, 57-67.
ISSN: 0209-3324. DOI: https://doi.org/10.20858/sjsutst.2019.104.6.
Marcin Jacek KLOS[1],
Aleksander SOBOTA[2]
PERFORMANCE EVALUATION OF ROUNDABOUTS USING
A MICROSCOPIC SIMULATION MODEL
Summary. Contemporary
planning of the road network in cities assumes the use of transport models. The
microscopic model allows provision of information and decision-making
regarding, for example, emissions, traffic organisation, geometrics of the
intersection and traffic control system. This article describes the development
of comprehensive methodology applied for carrying out the research related to
the design of geometrical parameters of the roundabout. The methodology
involves developing instructions for preparing solutions for performance
evaluations of roundabouts using a microscopic simulation model with the VISSIM
software. The application of the developed methodology was prepared on the case
study of the roundabout in Gdańsk. The results of the prepared case study
were discussed.
Keywords: microscopic
traffic simulation model, traffic parameters, project of intersection geometry.
1. INTRODUCTION
An intensive process of development of the new intelligent
transportation systems (ITS) was observed. ITS connects many types of services
and technologies with the goal of improving the effectiveness of transport
systems [1,2,3,4]. Contemporary planning of the road network in cities assumes
the use of transport models. Three types of transport model can be
distinguished [5]:
- macroscopic model – highest level of
aggregation, lowest level of detail
- mesoscopic model – high level of
aggregation, low level of detail
- microscopic model – low level of
aggregation, highest level of detail
In this article, the authors examined the microscopic
model, which describes the impact between individual vehicles in traffic [6].
The microscopic model allows provision of information and decision making
regarding: emissions, traffic organisation, geometrics of the intersection,
traffic control system and others [7]. Many simulation tools exist for
developing traffic microscopic simulation models, for example, VISSIM,
SimTraffic, AIMSUN, CUBE Dynasim, SUMO and others [8]. In this study, the
VISSIM software was used for the case study problem investigated.
The microscopic simulation traffic model is a useful tool
for analysis of the impact of planning new infrastructure. The author in [9]
analysed the estimation of effects caused by the implementation of the
Park&Ride system into a transport hub with the CUBE Dynasim model.
A simulation software was used to test a special type of
traffic control. The dynamic management of traffic lights at pedestrian
crossings with fuzzy logic controllers was tested with an external interface
module in the VISSIM software for extensive simulative assessments [10].
Air quality is an extremely important factor in urban
centres. The authors in [11] used a life cycle assessment model and prepared a
microscopic simulation model with the VISSIM software for a comparative study
of emissions by road maintenance works.
This article has two main aims. First, the authors
described the development of methodology applied for carrying out the research
related to the design of geometrical parameters of the roundabout. The
methodology involves developing instructions for preparing solutions for
performance evaluations of roundabouts using a microscopic simulation model
with the VISSIM software. The second aim of the paper was connected with the
application of the methodology to the case study of a roundabout in
Gdańsk.
The article is organised as follows; section 2 provides
information about the research problem and a description of the case study. The
next section presents the development of the methodology applied to carry out
the defined research problem. Section 4 contains the results of using a
microscopic simulation model prepared through the developed methodology for the
case study. Section 5 of the paper contains conclusions and propositions for
future work.
2. CHARACTERISTICS OF THE RESEARCH PROBLEM
The research problem is related to the proposition for
geometrical changes in the roundabout at Gdańsk. The changes are
associated with intensive cargo traffic from the road inlet from the port of
Gdańsk. Prognostic analysis of road traffic indicates an increase in
traffic flow in subsequent years in the analysed inlet. The aim of solving the
problem is to compare traffic conditions depending on values of the traffic
flow in the proposed variants of the design of the roundabout inlet for all
prognostic years. The cargo traffic flow growth related to the development in
the port was calculated in all prognostic years.
The need to carry out the analysis of such a problem in the
above-mentioned scope is related to the transport service of the port in
Gdańsk. Figure 1 presents the existing state of the analysed roundabout in
Gdansk with the inlets descriptions. Solving the problem requires the
development and validation of the following variants:
- the existing state (mapping the process of
handling traffic by crossing in the current traffic situation) and in all
traffic flow prognostic years
- proposals to change the geometry of the
intersection on one of its inlets (E2) in all traffic flow prognostic
years (variant 1)
- proposals to change the geometry of an
intersection on one of it’s inlets (E2), while eliminating traffic
on one of the relations that uses this intake (relation from inlet E2 to
outlet S), because instead of a roundabout, this relation will be served
by an overpass (variant 2) in all traffic flow prognostic years
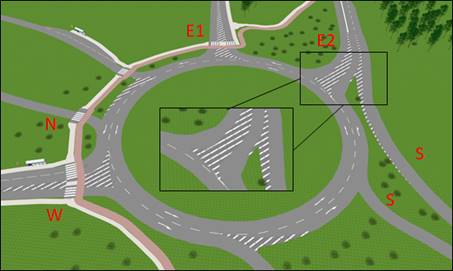
Fig. 1. Existing state of the analysed
roundabout in Gdansk
Source: author’s own collaboration
The variant 1 of the changes of the geometry is presented
in Fig. 2. In the inlet E2 proposed the addition of a new road lane.
Figures 1 and 2 showed microscopic simulation models
prepared in the PTV VISSIM software. The roundabout studied was in the area of
the “Ku Ujściu” traffic node in Gdańsk. The roundabout is
an intersection of Ku Ujściu Street with national road number 89 with
additional interchanges with Majora Sucharskiego Street. Developed methodology
in this article shows the way to solve such a problem.
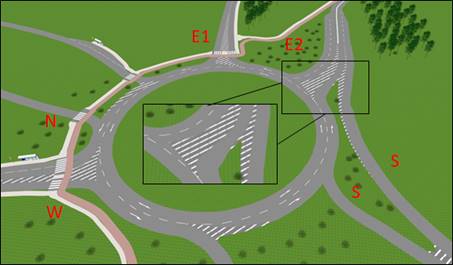
Fig. 2. Proposal to change the geometry of an
intersection on inlet E2 with the addition of a new road lane
Source: author’s own collaboration
3. METHODOLOGY OF THE RESEARCH PROBLEM
A comprehensive methodology for solving the indicated
research problem was developed. The developed methodology allows for the
assessment and provision of solution for performance evaluations of roundabouts
using a microscopic simulation model with the VISSIM software. The selected
traffic simulation software was developed by the PTV Group in Germany [12]. The
VISSIM software is a comprehensive tool used in developing the microscopic
simulation model, which also has the capability of rendering a 3D visualization
[13].
The methodology described can be used to solve other
research problems other than the described case study in the article. The
implementation of the research based on the developed methodology attends to
all the relevant aspects related to the development of the microscopic traffic
simulation model. The developed method was divided into four stages:
- defining and characterising the research
problem
- development and analysis of the research and
measurements
- microscopic simulation model development
- analysis and evaluation of the simulation
results
Each stage is connected with the other. Solving the
research problem with prepared methodology requires the usage of all stages.
All of the stages were described using schemes as presented in Figures 3 to 6.
The first step of the methodology deals with defining and
characterising the research problem. Figure 3 shows the scheme of the first
step of the methodology. The five main categories related to the scope of the
research problem were identified. The scheme considers all the important
factors for solving the research problem. Defining the factors presented in
Fig. 3 is extremely important because it directly influences the subsequent
stages of the methodology. The methodology in that step showed the necessary
measurements to be done.
Fig. 3. Scheme of first step of the
methodology: defining and characterising the research problem
Source: author’s own collaboration
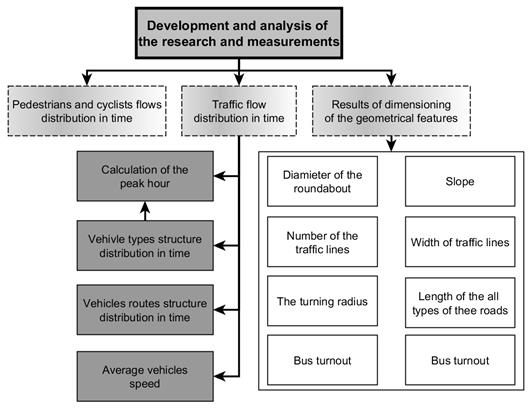
Fig. 4. Scheme ofe second step of the
methodology: development and analysis of the research and measurements
Source: author’s own collaboration
Figure 4 shows the scheme of the second step of the
methodology: development and analysis of the research and measurements. The
second step describes the necessary analysis of the obtained data from the
first step. The traffic and geometric data analyses are necessary to build a
microscopic traffic model. The geometrical measurements are often conducted
using geo-information software or with devices for non-contact measurement of
geometric values. The traffic data were collected using different approaches,
for example, video detection, manual counting. Performed analyses of the
acquired traffic data require the use of standards described in the literature
depending on the country, for example, HCM [14], HBS [15], Poland [16].
The methodology of the microscopic simulation model
development was presented in Fig. 5. The diagram includes all components
related to the development of the roundabout microscopic simulation model. The
development of the model is possible only after the implementation of the
previous steps. The development of the model is related to the geometrical
structure of the intersection represented by, for example, the VISSIM software
components, such as links, nodes, connectors, vehicle routes. The components
are parametrised and define using analysed traffic data from the previous step.
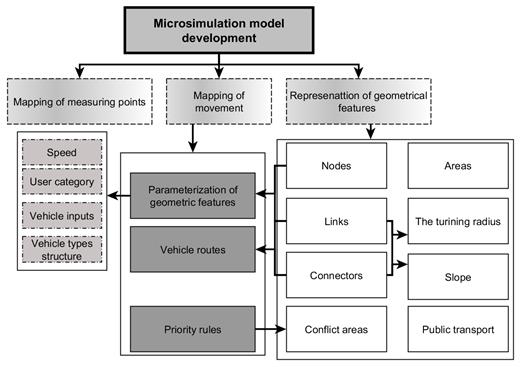
Fig. 5. Scheme of third step of the
methodology: microscopic simulation model development.
Source: author’s own collaboration
Analysis and evaluation of the simulation results scheme
were presented in Fig. 6. The scheme was presented using a block diagram. The
basis of the evaluation algorithm is to define the evaluation criteria and the
selection of assessment measures. Defined in detail, the criteria grants
understanding of the results in different technical variants and analyses the
changes in the prognostic years. In order to check the correctness of the
developed microscopic simulation model of the existing state, validation was
performed. Calibration was performed, for example, by comparing the obtained
values of an average wait time or travel time from the model and measured by
video techniques [17]. Only the calibrated microscopic simulation model can be
used to obtain and compare results in the technical variants and analyses the
changes in the prognostic years.
Fig. 6. Scheme of fourth step of the
methodology: analysis and evaluation of the simulation results.
Source: author’s own collaboration
Presented in a comprehensive manner, the methodology shows
the preparation of the complex microscopic simulation model. The developed
methodology for solving the indicated research problem was used for the case
study presented in section 2.
4. CASE STUDY RESULTS
The microscopic traffic simulation models were developed
using data from road traffic measurements. Based on the obtained traffic flow
data, the percentage shares of peak hours - morning and afternoon in the daily
traffic flow, as shown in Tab. 1 were determined.
For further analysis, the morning peak hour was chosen,
because the intensity of traffic in this period is greater, which enables
mapping of the worst traffic conditions.
Data from traffic prognostic years including daily traffic
volume were calculated for hourly traffic based on traffic percentage share
from the morning peak hour in the daily traffic (8.06%). For each prognostic
years horizon, traffic intensity and percentage shares of the routes and
vehicle types structure for all relations at the round-about were determined.
Tab. 1
Percentage
share of traffic from peak hours in daily traffic
|
Peak hours |
Time of the
peak hour |
Traffic flow
[veh./h] |
Percentage
share of traffic flow from peak hour in daily traffic [%] |
|
Morning |
06:00 - 07:00 |
892 |
8,06 |
|
Afternoon |
15:00 - 16:00 |
838 |
7,57 |
Source: author’s own collaboration
All elements in the microscopic simulation model were
placed according to the method of developing models using the PTV VISSIM
software.
On the basis of average loss of time at the roundabout and
individual at the inlets for particular horizon in prognostic years, levels of
service were determined on the basis of the "Method for calculating
capacity of the roundabouts" published by the General Directorate of
National Roads and Highways in 2004 [18]. This is the current valid method of
assessing traffic conditions at roundabouts in Poland.
Table 2 presents the criteria for defining levels of
service based on average values of time losses d [s / P] according to the
current method in Poland.
Tab. 2
Levels
of service for a given average values of time losses
|
Level of
service (LOS) |
Assessment of
traffic conditions |
Average values
of time losses d [s/veh.] |
|
I |
Very good |
<15,0 |
|
II |
Good |
15,1 - 30 |
|
III |
Average |
30,1 - 50 |
|
IV |
Bad |
>50 |
Source: author’s own collaboration
Table 3 presents the average values of time losses d
[s/veh.] for the roundabout along with the levels of service indication for
existing state model and models in two variants. These values were compiled in
all prognostic years.
The results presented in Tab. 3 indicate that the
roundabout will reach IV level of service in 2034, for the current state and
for the first variant. The results of the simulation indicate that the addition
of a second lane (variant 1) at the inlet E2 will reduce the average values of time
losses at the intersection. For 2030, the level of service of the roundabout
from level III to II was improved. In the prognostic horizon for 2040, the
average values of time losses in variant 1 were observed rather than in a
situation where the facility would not be reconstructed. For the year 2050, the
average values of time losses from the model taking into account the change of
the inlet geometry E2 are greater than for the existing state.
Tab. 3
Levels
of service for a given average values of time losses
|
Technical
variants |
Prognostic
years |
Average values
of time losses d [s/veh.] |
Level of
service (LOS) |
|
The existing state |
2018 |
5,23 |
I |
|
2030 |
30,19 |
III |
|
|
2034 |
108,69 |
IV |
|
|
2035 |
110,43 |
IV |
|
|
2040 |
154,27 |
IV |
|
|
2050 |
155,26 |
IV |
|
|
Variant 1 - proposals to change the geometry of the
intersection on one of it’s inlets (E2) |
2018 |
4,70 |
I |
|
2030 |
18,24 |
II |
|
|
2034 |
89,36 |
IV |
|
|
2035 |
101,54 |
IV |
|
|
2040 |
143,29 |
IV |
|
|
2050 |
175,22 |
IV |
|
|
Variant 2 - proposals to change the geometry of an
intersection on one of it’s inlets (E2), while eliminating traffic on
one of the relations that uses this intake (relation from inlet E2 to outlet
S) |
2018 |
3,58 |
I |
|
2030 |
5,29 |
I |
|
|
2034 |
6,87 |
I |
|
|
2035 |
6,89 |
I |
|
|
2040 |
8,39 |
I |
|
|
2050 |
11,85 |
I |
Source: author’s own collaboration
It is related to the methodology of determining average
values of time losses by the VISSIM software. For the existing state, the
program did not generate traffic flow, which was set by users. This resulted
from the limitation of the E2 inlet capacity and the formulating queues of
vehicles that were not served at the simulation time.
The elimination of E2 - S relation at the roundabout in the
second variant caused a radical improvement of traffic conditions. Undoubtedly,
this direction should be explored in further analysis and design work. However,
this solution involves incurring significant financial outlays.
5. CONCLUSIONS
The developed methodology adequately tackled the research
problem presented in the article and may be applied to similar research
problems. The development of the model using the VISSIM software, due to its
wide possibilities, effectively determine the impact of changes made to the
roundabout on traffic conditions.
The following conclusions were distinguished for the
analysed case:
- Changing the geometry of the E2 inlet at the
roundabout has a positive effect on the traffic conditions at this inlet
because in individual prognostic horizons average values of time losses
are less by about 40 [s/veh.]. However, this does not solve all
communication problems occurring at this intersection, because in 2034,
this facility will be working on IV level of service. This was observed in
both the analysis of the existing state model and the models taking into
account the change of the inlet geometry E2.
- The improvement of traffic conditions after the
addition of the lane at the E2 inlet will increase the average values of
time losses for relations on other inlets. This phenomenon was caused by
the increase in the traffic volume on the roundabout envelope, which
reduces the average time interval between vehicles. The increase in
traffic is the result of both the prognostic change in traffic potentials
in the immediate vicinity of the intersection as well as the general
pattern of socio-economic changes manifesting, inter alia, an increase in
the motorisation index and an increase in the population's mobility.
- Elimination of E2 - S relation at the
roundabout resulted in a radical improvement of traffic conditions.
Undoubtedly, this direction has potentials for future analytical and design
work.
References
1.
Wolshon Brian, Anurag Pande. 2016. Traffic engineering handbook. John Wiley & Sons. ISBN:
978-1118762301.
2.
Skrúcaný Tomáš, Martin Kendra,
Tomáš Kalina, Martin Jurkovič, Martin Vojtek, František
Synák. 2018. “Environmental comparison of different transport
modes”. Nase More 65(4): 192-196.
3.
Jacyna-Gołda Ilona, Mariusz Izdebski, Emilian
Szczepanski. 2016. „Assessment of the method effectiveness for choosing
the location of warehouses in the supply network”. Challenge of Transport Telematics, TST 2016. Communications in Computer
and Information Science 640: 84-97.
4.
Schmidt
Marie, Stefan Voss. 2017. „Advanced systems in public transport”. Public Transport 9(1-2) Special Issue:
3-6.
5.
Li Li, Xiqun Michael Chen. 2017. “Vehicle
headway modeling and its inferences in macroscopic/microscopic traffic flow
theory: a survey”. Transport
Research Part C: Emerging Technologies 76: 170-188. ISSN: 1896-0596.
6.
Żochowska Renata. 2014. “Traffic
flow modeling in urban network for the analysis of disruptions”. Logistyka 4: 2619-2632. ISSN: 1231-5478.
7.
Meyer Michael. 2016. Transport
planning handbook. John Wiley & Sons. ISBN: 978-1118762356.
8.
Shaaban Khaled, Inhi Kim. 2015. “Comparison
of SimTraffic and VISSIM microscopic traffic simulation tools in modeling
roundabouts”. Procedia Computer
Science 52: 43-50. ISSN: 1877-0509.
9.
Klos Marcin Jacek. 2016. “Estimation of effects caused by
the implementation of Park&Ride system in the transport hub”. Transport Problems 11(3): 5-13. ISSN:
1896-0596.
10. Pau
Giovanni, et al. 2018. “Smart Pedestrian crossing management at traffic
light junctions through a fuzzy-based approach”. Future Internet 10(2): 15. ISSN: 1999-5903.
11. Huang
Yue, Roger Bird, Margaret Bell. 2009. “A comparative study of the
emissions by road maintenance works and the disrupted traffic using life cycle
assessment and micro-simulation”. Transportation
Research Part D: Transport and Environment 14.3: 197-204. ISSN: 1361-9209.
12. PTV.
"PTV Vissim 10 user manual". 2017. Available at:
https://www.et.byu.edu/~msaito/CE662MS/Labs/VISSIM_530_e.pdf.
13. Yang
Lu, Weiyao Lan. 2018. "On secondary development of PTV-VISSIM for traffic
optimization". 13th International
Conference on Computer Science & Education. IEEE.
14. Manual,
Highway Capacity. A guide for multimodal
mobility analysis. Transportation Research Board, Washington, DC. 2016.
15. Werner
Brilon. 2005. “Roundabouts: a state of the art in Germany”. National Roundabout Conference, Vail,
Colorado. Vol. 16.
16. Gaca Stanisław,
Wojciech Suchorzewski, Marian Tracz. 2008. Inżynieria
ruchu drogowego. Teoria i praktyka. [In Polish: Traffic Engineering. Theory and practice]. Warsaw: WKiŁ. ISBN:
978-83-206-1707-8.
17. Salgado
David, et al. 2016. "Traffic microsimulation models assessment – a
case study of international land port of entry". Procedia Computer Science 83: 441-448.
18. Tracz
Marian, Janusz Chodur, Stanisław Gaca. 2004. Metoda obliczania przepustowości rond: instrukcja obliczania.
[In Polish: Roundabout capacity calculation
method: calculation instruction]. Cracow: PiT. ISBN: 83-86219-99-8.
Received 08.06.2019; accepted in revised form 29.08.2019
![]()
Scientific
Journal of Silesian University of Technology. Series Transport is licensed
under a Creative Commons Attribution 4.0 International License