Article
citation information:
Szczucka-Lasota, B., Kamińska,
J., Krzyżewska, I. Influence of tire pressure on fuel consumption in trucks with installed
tire pressure monitoring system (TPMS). Scientific
Journal of Silesian University of Technology. Series Transport. 2019, 103, 167-181. ISSN: 0209-3324. DOI: https://doi.org/10.20858/sjsutst.2019.103.13.
Bożena
SZCZUCKA-LASOTA[1],
Joanna KAMIŃSKA[2],
Iwona KRZYŻEWSKA[3]
INFLUENCE
OF TIRE PRESSURE ON FUEL CONSUMPTION IN TRUCKS WITH INSTALLED TIRE PRESSURE
MONITORING SYSTEM (TPMS)
Summary. In recent years, the development of IT systems for fleet
monitoring was observed. Tire pressure monitoring systems are constantly
improved. Decreased values in tire pressure can cause deformation of tires.
Monitoring of tire pressure is an important function in oversized transport
trucks. Tire pressure and rolling resistant influence fuel consumption. The
purpose of this paper was to determine the impact of tire pressure on fuel
consumption in a fleet of trucks with tire pressure monitoring system installed
and to determine the impact of other factors that may affect fuel consumption,
such as the vehicle weight, brake usage and cruise control usage. The results
of the research were developed using a multiple regression model describing the
above dependence.
Keywords: tire, pressure, monitoring, TPMS, fuel consumption
1. INTRODUCTION
The development of technology, especially technology
for measuring vehicle exploiting parameters, moving at the direction of
increasing efficiency, reliability and reducing exploiting costs related to
fuel consumption, thus reducing the emission of harmful pollutants. The basic
parameter enabling the increase of usage properties in a tire is the selection
of the proper tire pressure depending on the vehicle weight, ambient conditions
(temperature, external pressure), and the mode of exploitation. The development
of civil engineering and transport allows the use of increasingly better
consumables, fuel mixtures and measurement systems of selected parameters to
ensure higher reliability and efficiency [1-3].
Based
on the literature review so far, it should be stated that tire pressure is an
important factor affecting the passive safety of vehicles. First, it was
noticed that depending on the tire pressure level, the tire is subject to
greater or lesser deformations. Such deformations affect the stability
exploiting of tires causing, for example, irregular tread wear [4-5]. Figure 1
presents tires with different pressure values.
Fig. 1. Tire deformations in a) low pressure, b) high
pressure, c) proper pressure [5]
Low tire pressure causes tire deformations from the
inside in such a way that contact with the ground occurs only on the outer
surface. Then there is a danger of the tire warming up quickly (increase of
temperature) and damage its structure, which may lead to shorter tire life. Too
high tire pressure values cause it to contact the ground only in the middle
part.
In the third case, the tire pressure is correct. The
tread consumption is regular, which affects the driving comfort and increases
the tire life and shorter braking distances [5]. According to Mathai, correct
tire pressure and temperature values allow for lengthening the life of the tire
by 30%. The authors of the study [6] even indicate the value of 50%. In turn,
Reiter et al. calculated that the exploiting of vehicles with lower tire
pressure has the impact of shortening the tire life by up to 5% [7-8].
In recent years, the impact of tire pressure values on
fuel consumption and rolling resistance has been analysed. The results of
scientific and research work [12-21, 23] clearly indicate the relationship
between these parameters. Tests carried out by Varghese and Schmeitz, indicate
that as tire pressure increases, rolling resistance decreases with the same
value of vehicle speed and weight [10-11]. In his scientific works, Jansen
noted that the decrease in pressure in passenger car tires by 0.03 MPa caused
an increase of 6% in rolling resistance while fuel consumption increased by 1%
[11]. Similar relationships have been shown in publications [7-8, 22] where,
with a drop in pressure in truck tires by 0.02 MPa, fuel consumption increased
by 1.5%.
In turn, the work of Jasarevic and Reiter stated that
the pressure drop of 0.05 MPa in the tires increased the rolling resistance by
15%, which determines an increase of fuel consumption in the range of 2-5% in
vehicles [7-9]. Based on the analysis of the literature data, it can be stated
that tire pressure is the basic factor affecting the efficiency of the use of
vehicles, rolling resistance and the amount of fuel consumption. In addition,
as demonstrated in a number of scientific and research works in Poland and
around the world, the exploitation of vehicles at tire pressure other than
recommended by manufacturers affects the condition of tires, causing premature
wear.
The relationship between the decrease of tire pressure
in passenger cars and the tire life has been investigated, among others by
Wagner et al. [7-8].In these publications, the authors showed that the
exploitation of vehicles with reduced tire pressure by about 7 kPa causes the
tire life to be shortened by almost 2%. The published data of the research
projects carried out confirmed this relationship. The results of scientific and
research work indicate a reduction of tire life by 30% in the exploitation of
vehicles with reduced tire pressure by 20% of the pressure recommended by
manufacturers [7-8].
The purpose of this paper is to determine the impact of
tire pressure on fuel consumption in a fleet of trucks with tire pressure
monitoring system installed and to determine the impact of other factors that
may affect fuel consumption, such as the vehicle weight, brake usage and the
cruise control usage. The results of the research were developed using a
multiple regression model describing the above dependence.
1.
MATERIALS
AND METHODS
In the considered transport company realising the
transport of oversized cargo, the truck fleet consists of 50 vehicles including
tractors and trailers. Among the vehicles, there are three types of tractors
and six types of trailers. From among all available vehicles in the truck
fleet, 10 vehicles consisting of three-axle tractors with 6x2 motor and Mega
Tele type trailers were selected for basic tests, as it was found that for
these vehicles, the exploiting conditions will be the closest in terms of route
length, weight of transported loads, etc. In addition, these vehicles are the
most used in the considered company.
Vehicles (tractor + trailer) are marked in sequence
with letters A to E. The test material is truck tires. For the needs of the
work, new tires were purchased (Michelin companies) and installed in all tested
vehicles. Truck tires used for transport in the fleet of the considered company
differ in size:
• 22.5 inches for tractors,
• 17.5 inches for trailers.
During the tests, the tires were not damaged, changed
or transferred to another arrangement in the axles of the vehicle.
Remote tire pressure measurements were made using a
tire pressure monitoring system. In the selected vehicles, a tire pressure
monitoring system was installed while the vehicle was working, which made it
possible to track the measured exploiting parameters continuously on the online
platform, and every 30 days the data was transferred to the files for further
analysis. On the basis of the obtained data, statistical calculations and
graphs of fuel consumptions versus tire pressure were made.
The results of average fuel consumption measurements
have been recorded on the Nawi24 website, which is used to monitor vehicles
using GPS. The fuel quantities were controlled by CAN sensors, additionally, on
the basis of the received data from the system, sections of the route were
calculated, which allowed for relatively precise determination of the average
of fuel consumption by the system. As part of the work, the average fuel
consumption values were taken from the system in the form of files and then
compiled and analysed.
Data collected from the Scania online platform
concerned, for example, average fuel consumption in monthly summaries, and
eco-driving, which is a modern and eco-friendly driver's style. All drivers
have been trained on the impact of eco-driving on fuel consumption during
vehicle exploiting. The factors controlled by the Scania Driving Service system
include: using the cruise control [%], using the brake [number], the weight of
the vehicle [Mg] and average speed [km/h]. Data collected from the Scania
platform was compiled and then analysed in terms of their significance on the
fuel consumption of tested vehicles.
2.
RESULTS
3.1. Influence of tire pressure on fuel
consumption
The influence of tire pressure on the average fuel
consumption in vehicles with tire pressure monitoring system was examined. The
measurements of average fuel consumption on the test day and the average
pressure in all tires in the vehicle were compiled. Measurements of average
fuel consumption were registered automatically in the system Nawi24, a platform
for monitoring the truck fleet. Average fuel consumption values were taken into
account in only those that concerned a route longer than 50 km. The obtained
values were related to the main line. The CAN system uses a fuel probe to
provide data from the amount of fuel consumed. The pressure values were
recorded on the remote online platform of the tire pressure monitoring system,
then averaged from each axis on each day of vehicle exploiting and averaged
from all axles on a given day. The research was conducted from November 2017 to
August 2018. The data from each month were compiled on a chart, the regression
curve, the R2 coefficient and the equation of this curve were
derived. Linear regression was used in the studied relationship.
Analysis of the obtained data shows that the results
of calculations of the average amount of fuel consumption in vehicles A-E and
average tire pressure in a given day are arranged in diagrams linearly (Fig.
2-6), and the observed dependence is inversely proportional.
This means that as the tire pressure increases, the
average fuel consumption in the tested vehicles decreases. For the linear
regression model used, the determined R2 coefficient is 0.67 for
vehicle B, indicating a moderate correlation (Fig. 3). The R2
coefficient was the lowest for the analysed vehicle. For vehicle A, the
determined R2 coefficient was 0.75, which also indicated a moderate
correlation (Fig. 2). The R2 coefficient determined (Figures 4-6) in
the other analysed cases was about 0.80, which indicates a strong positive
correlation between the analysed variables.
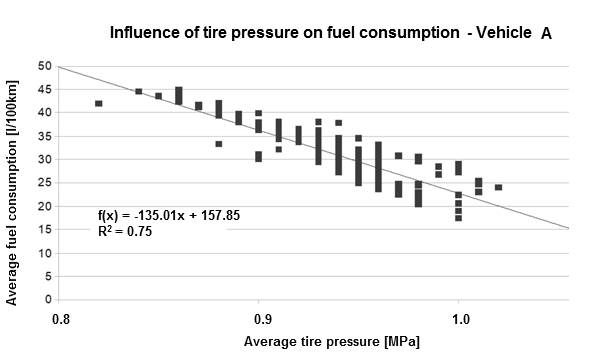
Fig. 2. Influence of tire pressure on fuel consumption
– vehicle A
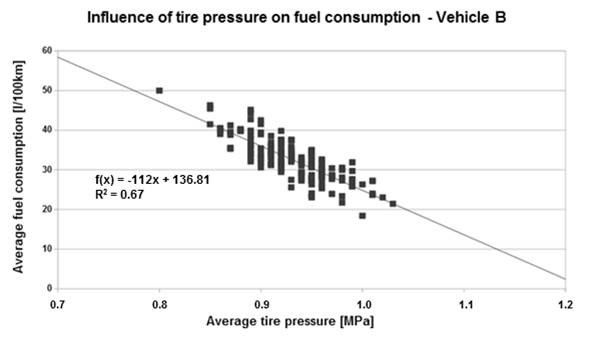
Fig. 3. Influence of tire
pressure on fuel consumption – vehicle B
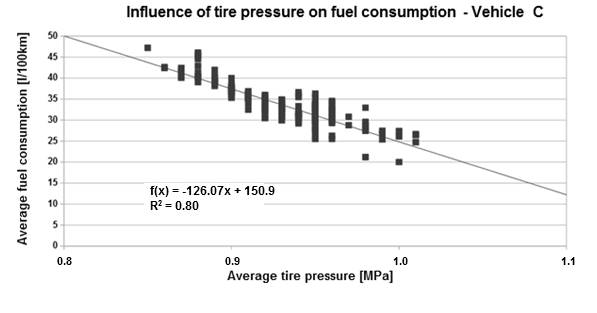
Fig. 4. Influence of tire
pressure on fuel consumption – vehicle C
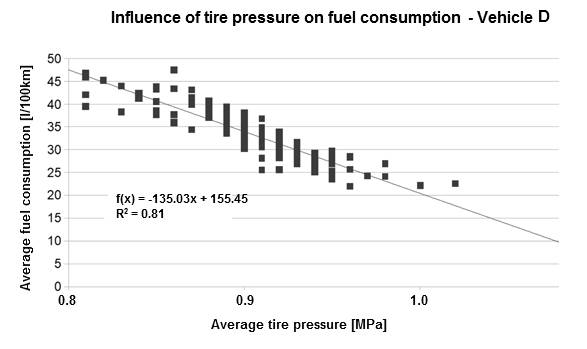
Fig. 5. Influence of tire pressure
on fuel consumption – vehicle D
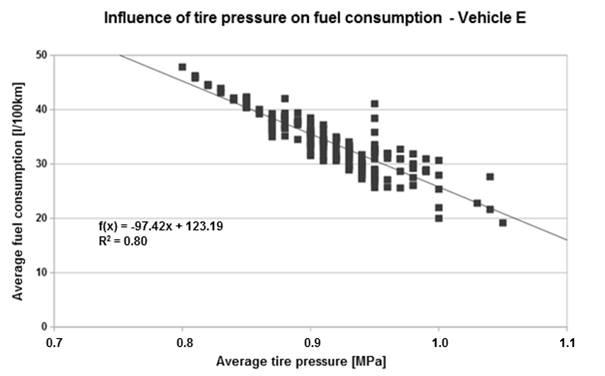
Fig. 6. Influence of tire
pressure on fuel consumption – vehicle E
3.2. Influence of other parameters on fuel
consumption
In order to identify other factors that may impact
fuel consumption, the following measurements were compiled:
• weight of the
vehicle (average weight of the truck; the vehicle together with the transported
load) [Mg],
• brake usage (the
number of brakes use over the distance of 100 km of the route)
[number / 100 km],
• use of cruise
control (percentage of cruise control) [%],
• average speed
[km/h].
All measurements were registered by a special platform
to manage the Scania Fleet Management truck fleet, where all monitored vehicle
data were sent in an automated manner. The data of vehicles were downloaded
from the platform in a file, ready for further analysis and comparisons.
The measurements and calculations were aimed at
checking the impact of other exploiting parameters on fuel consumption in
monitored vehicles and determining which of the parameters significantly affect
the amount of fuel consumed. The analysis of the test results shows that the
strongest correlation was demonstrated between these parameters: the weight of
vehicle and fuel consumption (Fig. 7).
Along with the increase in the weight of vehicle, the
fuel consumption in vehicles also increased (according to the linear law),
which is consistent with the literature data. Determined R2
coefficients in the analysed cases were from 0.60 to 0.73.
Slightly lower correlation was observed between such
parameters as the registered number of braking and its effect on fuel
consumption (Fig. 8) during vehicle exploiting and in the case of observation
of the impact of the use of cruise control on fuel consumption.
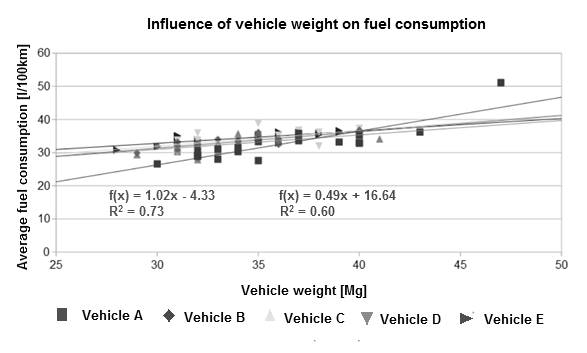
Fig. 7. Influence of vehicle
weight on fuel consumption
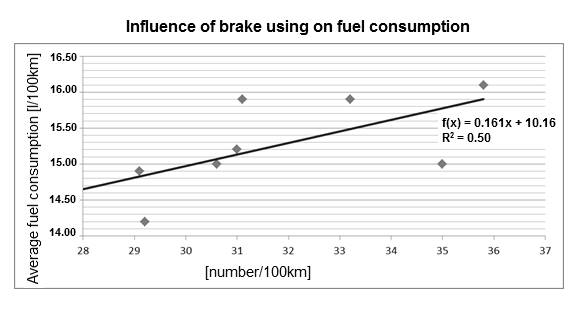
Fig. 8.
Influence of brake usage on fuel consumption
In both cases, the low linear
correlation coefficient of the independent variable with the dependent variable
(the amount of fuel consumption) was recorded. However, these results do not
determine the removal of these variables from the set of predictors. In order
to make an unambiguous assessment of the impact of each of the explanatory
variables on the variability of the explained variable (fuel consumption),
statistical analyses should be carried out, determining partial and
semi-partial correlation coefficients. Observed results indicate that the
percentage use of cruise control in vehicles was high, in the range of 57 to
91%.
Considering the data
analysis, it could be concluded that in addition to the tire pressure, the most
significant impact on the amount of fuel consumption during the exploration of
the trucks is affected by the following: the vehicle weight, brake usage and
use of cruise control. For these variables, linear regression was assumed. The
correlation was considered to be strong for the dependence between the
parameters: vehicle weight and average amount of fuel consumption, while the
average or weak correlation was recorded in the case of the analysis of the
dependence of the registered number of brake and cruise control usage on the
average amount of fuel consumption.
In the first step,
linear relationships between variables were examined to determine whether: fuel
consumption depends linearly on other variables (explanatory) given that
explanatory variables do not depend strongly on each other.
Table 1 summarises the
values of basic statistics and Pearson's linear correlation coefficients for
the considered variables.
The presented values of
the correlation coefficient (Table 1) indicate a strong, statistically
significant, negative relationship between fuel consumption and tire
pressure(-0.73) and also a statistically significant positive relationship
between fuel consumption and vehicle weight.
Among the explanatory
variables, there were also several statistically significant linear
relationships (marked in red in the table). The strongest is the negative
relationship between brake usage and use of cruise control, which has a causal
effect. This means with increase use of cruise control on the route, the number
of brake usage decreases.
It should be noted that
the low linear correlation coefficient of the independent variable with the
dependent variable does not determine the deletion of the variable from the
predictor set. In order to make an unambiguous assessment of the impact of each
of the explanatory variables on the variability of the explained variable (fuel
consumption), the coefficients of partial and semi-partial correlation should
be determined. Partial correlation expresses correlation between a given
independent variable, taking into account its correlation with all other
variables (dependent and independent). This is the correlation between the rest
after considering all independent variables. The partial correlation represents
the unique contribution of a given independent variable when predicting the
value of the dependent variable. On the other hand, semi-partial correlation
determines the correlation of a given independent variable, given its
correlating with all other variables and the dependent variable (without
considering its correlation with other variables).
Statistically
significant at the level of α = 0.05 Pearson's linear
correlation coefficients were marked in red.
Thus, partial
semi-correlation is the correlation of the residuals of a given independent
variable after considering the influence on other variables with the dependent
variable without taking into account the influence of other variables.
In the analysed case,
the semi-partial correlation coefficient is a better indicator of the
"actual impact" of the predictor than the partial correlation because
it scaled (referred to) the total variability of the dependent variable (fuel
consumption). Values of partial correlation coefficients and semi-partial
correlation coefficients are presented in Tab. 2.
The values of partial
semi-correlation coefficients indicate the greatest impact of the pressure and
vehicle weight on the variability of fuel consumption. The effect of brake and
cruise control is similar. The value of Pearson's correlation coefficient (high
positive relationship between these variables) indicates their redundancy
(tolerance coefficient equal to 0.19 and 0.21, respectively – Tab. 3).
Tab. 1
Basic descriptive
statistics and Pearson's linear correlation coefficients
|
Variable |
Variable |
|||||
|
Average speed [km/h] |
Use of Cruise control [%] |
Brake usage [number/100km] |
Vehicle weight [Mg] |
Pressure [MPa] |
Fuel consumption [l/100km] |
|
|
Average |
59.20 |
71.80 |
23.0 |
34.20 |
0.93 |
32.93 |
|
Standard deviation |
4.87 |
16.90 |
11.1 |
3.18 |
0.03 |
2.40 |
|
Fuel consumption [l/100km] |
0.01 |
-0.09 |
0.11 |
0.57 |
-0.73 |
1.00 |
|
Pressure [MPa] |
-0.14 |
0.10 |
-0.01 |
-0.41 |
1.00 |
|
|
Vehicle weight [Mg] |
0.16 |
0.07 |
-0.09 |
1.00 |
|
|
|
Brake usage [number/100km] |
-0.35 |
-0.88 |
1.00 |
|
|
|
|
Use of cruise control [%] |
0.25 |
1.00 |
|
|
|
|
|
Average speed [km/h] |
1.00 |
|
|
|
|
|
Tab.
2
Partial
and semi-partial correlation coefficients of variables considered in the model
|
Variable |
Partial correlation coefficients |
Semipartial correlation coefficients |
|
Pressure [MPa] |
-0.69 |
-0.55 |
|
Vehicleweight [Mg] |
0.44 |
0.28 |
|
Brake usage [number/100km] |
0.24 |
0.14 |
|
Use of cruise control [%] |
0.21 |
0.13 |
|
Average speed [km/h] |
-0.13 |
-0.08 |
Tab. 3
The
values of the Pearson correlation coefficient for a variables set
|
Variable |
Actual variable in
equation; DV: Fuel consumption [l/100 km] |
|||
|
Partial
correlation |
Semi-partial
correlation |
Tolerance |
R2 |
|
|
Pressure [MPa] |
-0.69 |
-0.55 |
0.79 |
0.21 |
|
Vehicle weight [Mg] |
0.44 |
0.28 |
0.73 |
0.27 |
|
Brake usage [number/100km] |
0.24 |
0.14 |
0.19 |
0.81 |
|
Use of cruise control using [%] |
0.21 |
0.13 |
0.21 |
0.79 |
|
Average speed [km/h] |
-0.13 |
-0.08 |
0.82 |
0.18 |
Therefore, only one of
them can be included in the model as an explanatory variable. Due to the
higher Pearson's correlation coefficient between brake usage and fuel
consumption, it was decided to introduce this variable into the model. The
average speed and use of cruise control were considered to have a slight impact
on the variability of fuel consumption and were not included in the model. For
a set of variables in the model, the semi-correlation and tolerance values were
again determined to verify the correctness of the selection. The results are
summarised in Tab. 4.
Semi-correlation values after
been removed from the set of redundant variables
|
Variable |
Partial correlation |
Semi-partial correlation |
Tolerance |
|
Pressure [MPa] |
-0.67 |
-0.54 |
0.83 |
|
Vehicle weight [Mg] |
0.46 |
0.31 |
0.82 |
|
Brake usage [number/100km] |
0.21 |
0.13 |
0.99 |
The tolerance
coefficients indicate that none of the variables is redundant, so the set of
explanatory variables is correctly specified.
The linear model equation was
determined by the multiple regression method with the minimisation of the error
functions using the least squares method:

![]()
![]()
The standard error of
the estimation of this model is 1.479 l / 100 km. The R2 coefficient
is 0.64. The correctness of the model was assessed on the basis of the
distribution of residuals, that is, the differences between the actual
(empirical) and model values. For a well-constructed model, the rest should
have a normal distribution. The correctness of the model presented in the work
confirms the distribution of residuals shown in Fig. 9.
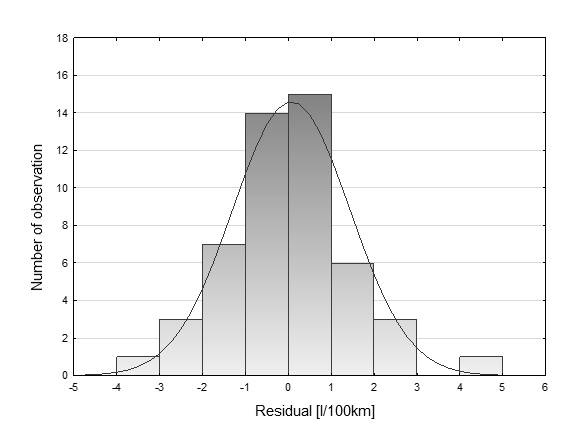
Fig. 9. Residual histogram for the model
(pattern number)
According to figure
(Fig. 9), all residue values are arranged according to the frequency of normal
distribution. For a more accurate assessment of the compatibility of the
distribution of residues with the normal distribution, a normality diagram of
the residuals is shown (Fig. 10). It can be seen that all points
representing the rest of subsequent cases are arranged on a line representing
the normal distribution.
In Fig. 10, one point is
visible, for which the rest is significantly higher than expected. This is the
last measurement of the last vehicle. This value may result from measurement
error but we cannot verify this hypothesis, therefore we left the result of
this measurement in the data set. The presented results confirmed a strong
relationship between these parameters.
However, the limitations
of inference based on the proposed and presented model should be considered.
The tire pressure value is limited in advance by the maximum value specified by
the manufacturer. According to the literature data, if the tire pressure is too
high, the tire wear pattern also changes. Too high tire pressure causes the
contact of tires with the ground only in the middle part. Such deformations may
lead to irregular use of the tread, which may also lead to a shorter time of
safe tire use [5].
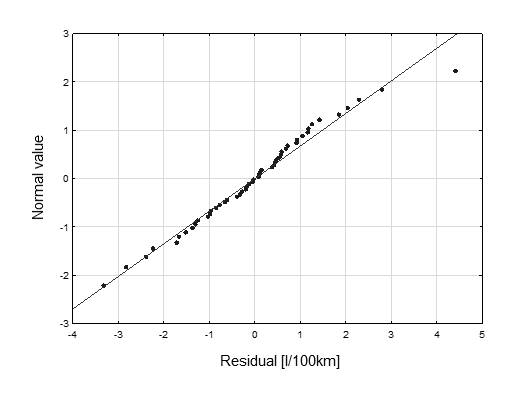
Fig. 10. Normality diagram of residuals
3.
CONCLUSION
In recent years, scientific research clearly indicated
a strong relationship between rolling resistance, tire pressure and fuel
consumption. Moreover, low and high values of tire pressure can create the
deformation of the tire. In this paper, the influence of tire pressure on fuel
consumption was investigated. Model regression was used in data analysis of
other parameters which can affect fuel consumption. Analysis of the results
obtained for other vehicles confirms that the adopted linear regression model
was correct. It can, therefore, be noted that:
• the influence of tire pressure on fuel consumption was
observed,
• dependence of fuel consumption on tire pressure was
inversely proportional; with the increase of tire pressure in the tested range
(0.7-1.1 MPa), fuel consumption decreased.
It can, therefore, be asserted that maintaining tire
pressures at appropriate values has an impact on lower fuel consumption.
It should be noted that in all examined vehicles,
inversely proportional dependence of fuel consumption on tire pressure was
performed. Thus, already at this stage of the research, it is justified that
with the increase of tire pressure, the value of average fuel consumption
decreases. Values of R2 correlation coefficients indicated in some
cases a moderate relationship between the parameters examined, while in the
majority of cases a strong correlation was observed.
In conclusion, the tire
pressure [MPa] has the greatest impact on the reduction of fuel consumption.
With the pressure increase by 0.1 MPa, fuel consumption decreases by an average
of 5.15 l / 100 km. Presence of a tire pressure monitoring system can help in
initiating a rapid response when values of tire pressure decrease.
References
1.
Chomka Grzegorz, Jerzy Chudy, Maciej Kasperowicz. 2012.
„Techniczne aspekty regeneracji opon samochodowych”. [In Polish:
„Technical aspects of car tire regeneration”]. Autobusy. Technika. Eksploatacja. Systemy transportowe 5: 110-115.
2.
ZSSPLUS. „Wheels and tires”. Available at:
https://www.zssplus.pl/transport/pin/Ogumienie.pdf.
3.
Rzeczoznawcy TOMIR. „The tire and shield vademecum”.
Available at: http://rzeczoznawcy-tomir.pl/portal/wademecum-opon-oraz-tarczy-k%C3%B3%C5%82.pdf.
4.
Oduro Seth Daniel, Timothy Alhassan, Prince Owusu-Ansah, Prince Andoh.
2013. “A mathematical model for predicting
the effects of tyre pressure on fuel consumption”. Research
Journal of Applied Sciences, Engineering and Technology 6(1): 123-129. ISSN:
2040-7459. DOI: 10.19026/rjaset.6.4046.
5.
Caban Jacek, Paweł Droździel, Dalibor Barta, Stefan Liscak.
2014. “Vehicle Tire Pressure Monitoring System”. Diagnostyka 15(3): 11-14. ISSN:1641-6414.
6.
Mathai Asha, Vanaja
Ranjan. 2015. “A new approach to
tyre pressure monitoring system”. International
Journal of Advanced Research in Electrical, Electronics and Instrumentation
Engineering 4(2): 866-872. DOI: 10.15662/ijareeie.2015.0402067.
7.
Reiter Marc, John Wagner. 2010. “Automated automotive tire inflation
system – effect of tire pressure on vehicle handling”. IFAC Proceeding
Volumes 43(7): 638-643. DOI:
https://doi.org/10.3182/20100712-3-DE-2013.00013.
8.
Toma Marius, Cristian
Andreescu, Cornelia Stan. 2018. “Influence of tire inflation pressure on
the results of diagnosing brakes and suspension”. Procedia Manufacturing 22: 121-128. DOI:
https://doi.org/10.1016/j.promfg.2018.03.019.
9.
Jasarevic Sabahudin, Ibrahim Mustafic, Fuad Klisura. 2014.
“Introduction and application of tire pressure monitoring system”. 3rd Conference “Maintenance
2014“ Zenica, B&H, June 11-13, 2014.
10. Varghese Alexander. 2013. “Influence of tyre inflation pressure on fuel
consumption, vehicle handling and ride quality modelling and simulation”.
Master's thesis. Chalmers University of Technology, Göteborg, Sweden.
11. Jansen Sven, Antoine Schmeitz. 2014. “Study on some safety-related aspects of tyre
use”. Stakeholder information and
discussion document MOVE/C4/2013-270-1. Directorate-general
for Mobility and Transport. May 27th 2014 Brussels.
12.
Torretta Vincenzo, Elena
Cristina Rada, Marco Ragazzi, Ettore Trulli, Irina Aura Istrate, Lucian Ionel
Cioca. 2015. “Treatment and disposal of tyres: Two EU approaches. A review”. Waste
Management 45: 152-160. DOI: http://dx.doi.org/10.1016/j.wasman.2015.04.018.
13.
Skarbek-Żabkin
Anna, Ewa Kamińska. 2015. „Kierunki zagospodarowania zużytych
opon samochodowych”. [In Polish: „Directions for the management of
used car tires”]. Transport
Samochodowy 1: 79-87.
14.
Jacyna Marianna (Eds.). 2014. Kształtowanie
systemów w wybranych obszarach transportu i logistyki. [In Polish: Shaping systems in selected areas of
transport and logistics]. Warcow: Warsaw University of Technology
Publishing House. ISBN: 978-83-7814-300-0.
15.
Jacyna Marianna. 2009. Modelowanie
i ocena systemów transportowych. [In Polish: Modeling and evaluation of transport systems]. Warcow: Warsaw
University of Technology Publishing House. ISBN: 978-83-7207-808-7
16.
Jacyna M., M. Wasiak, K.
Lewczuk, G. Karoń. 2017. “Noise and environmental pollution from transport: decisive problems in
developing ecologically efficient transport systems”. Journal of Vibroengineering 19:
5639-5655. DOI: doi.org/10.21595/jve.2017.19371.
17.
Januszewicz
K., M. Melaniuk, M. Ryms, E. Klugmann-Radziemska. 2010. „Możliwości wykorzystania całych używanych opon”. [In Polish: „Opportunities to use
all used tires”]. Archiwum
Gospodarki Odpadami i Ochrony Środowiska 12(4): 53-60.
18.
Holka
Henryk, Tomasz Jarzyna. 2010. „Aspekty
energetyczne dekompozycji opon samochodowych metodą Water-Jet”. [In Polish: „Energy aspects of car tire decomposition
using the Water-Jet method”]. Inżynieria
i aparatura chemiczna 5: 43-44.
19.
Sobota
Aleksander, Renata Żochowska, Emilian Szczepański, Paweł
Gołda. 2018. „The influence of tram tracks on car vehicle speed and
noise emission at four-approach intersections located on multilane arteries in
cities”. Journal of
Vibroengineering 20(6): 2453-2468.
20.
Jacyna-Gołda
Ilona, Mariusz Wasiak, Mariusz Izdebski, Konrad Lewczuk, Roland Jachimowski,
Dariusz Pyza. 2016. „The evaluation of the efficiency of supply chain
configuration”. Proceedings of the
20th International Scientific Conference Transport Means 2016. Transport Means
- Proceedings of the International Conference: 953-957.
21.
Naish
Daniel A., Matthew Fleet, Devaraj Arumugam. 2017. „Feasibility assessment
of various TL-5 safety noise barrier (SNB) designs“. Road & Transport Research: A Journal of Australian and New Zealand
Research and Practice 26(2): 5-21.
22.
Naish
Daniel A. 2016. „Dynamic simulation of a truck impact with a side entry
arrester bed system“. Road &
Transport Research: A Journal of Australian and New Zealand Research and
Practice 25(1): 3-17.
23.
Nishiuchi
H., Y. Kobayashi, T. Todoroki. 2018. Public
Transport 10: 291. DOI: https://doi.org/10.1007/s12469-018-0185-3.
Received 06.01.2019; accepted in revised form 29.05.2019
![]()
Scientific
Journal of Silesian University of Technology. Series Transport is licensed
under a Creative Commons Attribution 4.0 International License