Article citation information:
Wala, M., Nowakowski, P. A method and application to identify reasons for decreasing vehicles� driving speed in cities. Scientific Journal of Silesian University of Technology. Series Transport. 2018, 98, 181-190. ISSN: 0209-3324. DOI: https://doi.org/10.20858/sjsutst.2018.98.17.
Mariusz WALA[1],
Piotr NOWAKOWSKI[2]
A
METHOD AND APPLICATION TO IDENTIFY REASONS FOR DECREASING VEHICLES� DRIVING
SPEED IN CITIES
Summary. Vehicle onboard travel planning systems have been developed in recent years. Since the development of GPS-based devices equipped with digital mapping applications for many vehicles, route planning has become easier and more convenient for drivers. Although such systems are used by drivers, for delivery or courier companies, it is especially important to provide a high-quality service, which involves the timely delivery of goods. Traffic management authorities are also interested in acquiring data on road and traffic conditions to verify the effectiveness and smoothness of the flow of vehicles. This paper proposes a method for traffic data collection and an application for recording data of variable factors having impact on a vehicle speed in cities and agglomerations. Data acquisition and identification of factors having impact on reduction of vehicle speed in the cities has been presented for a case study of Gliwice. The results can be useful for traffic management authorities, municipal traffic, road planning departments and mobile apps designers.
Keywords: vehicle driving speed, mobile application, traffic factors
1. INTRODUCTION
The recent development of information
technologies and mobile applications has provided drivers with the ability to
plan a route and receive updated traffic data while travelling. Major software
development companies enable such systems to view current traffic conditions,
give notice of congestion and estimate the origin-destination time [1,2], as
well as update traffic conditions in real time. A driver also has the option to
choose an alternative route when any traffic congestion occurs. Among the most
popular systems are Google Maps, ViaMichelin, TomTom, MapaMap, Targeo and
Yanosik. Some of these systems are equipped with the option to register certain
events or accidents that are disrupting traffic. However, the range of events
that can be notified is limited. Furthermore, the estimation of travel time is
a very important issue for goods delivery companies. At the same time,
municipal traffic planning authorities need to be able to clear view traffic
flow in their respective municipalities.
Traffic flow is determined by many factors, the
most important of which depends on vehicle flow and types of roads [3,4]. In
city centres, route planning is a demanding task. In many cases, drivers encounter
congestion or very slow traffic [5]. Therefore, any deliveries of goods or
transport of people may be disrupted or take a long time. There is also the
issue of increasing vehicles exhaust emissions, which are dangerous to human
health and the environment [6,7]. In peak hours in many cities, agglomerations
and conurbations, when congestion phenomena occur, the driving speed decreases
and the arrival at destination points is delayed [8]. Although some predictions
concerning travel time delays can be estimated, it is difficult to identify
precisely the reasons why vehicle speed decreases in a city. In many cases,
except for increased vehicles flow, there are additional factors that impact on
decreasing the origin-destination time. The most important are traffic lights,
entering a main road from a subordinated road, slowly moving vehicles,
roadworks, pedestrian crossings and bus stops [9,10,11].
In this paper we propose a method and
application for registering all events occurring when driving a vehicle. The
application may be installed on any tablet or smartphone equipped with a GPS
receiver. All events occurring during travel can be recorded and subsequently
compared with other data sources (e.g., traffic cameras or sensors).
2. IDENTIFICATION OF THE FACTORS DETERMINING
VEHICLE
TRAVEL TIME
Although the data collected from
different types of traffic sensors contain much information, it is not possible
to evaluate some of the important parameters that fully depict the transport
system in cities or traffic flow [12]. In many cases, an individual driver has
to estimate the driving time between the nodes of the origin-destination points
in an agglomeration [13,14]. This concerns participants in supply chains,
emergency vehicles and other commercial driving.� It is important to minimize travel time for a
selected route.�
Many factors determine travel time
and traffic flow, including the type of road, the number of lanes and
congestion level, but some important parameters can occur randomly: traffic
lights, slow moving vehicles, buses, trams, pedestrian crossings, types of
buildings close to the road (e.g., shops, hospitals, schools). Congestion
mainly occurs in cities and usually has two peak periods: in the morning and in
the afternoon/evening.
Many of these factors cannot be
easily evaluated by loops, video detectors and other sensors [15]. Vehicle flow
depends on the number of vehicles passing the cross-section of a road as a unit
of time. The unit of measurement for vehicle flow is the number of vehicles per
hour (vehicles/h), vehicles per quarter hour or per day (vehicles/day). Traffic
flow is the simultaneous movement of a set of vehicles in a certain sequence [16].
To describe traffic flows, some basic parameters of traffic flow must be
determined or calculated. The average speed of motor vehicles in free traffic
and good weather conditions can be calculated from Formula (1) [17,18]:
![]() ����������� [km/h]����������������������������������������������� (1)
����������� [km/h]����������������������������������������������� (1)
where DV is the increase or decrease in the
average speed of the vehicle, depending on the fixed speed limit (2):
�
![]() �������� [km/h]����������������������������������������������� (2)
�������� [km/h]����������������������������������������������� (2)
The coefficient f depends on the type and neighbourhood of the road in terms of
average speed and is calculated by Formula (3). Vc is the calculated
speed and Vl depends on the assigned speed limit.
![]() ����������������������������������������������������������� (3)
����������������������������������������������������������� (3)
Tab. 1 presents a detailed
description of the coefficients.
Tab. 1
Coefficients having influence on a vehicle�s
average speed
|
Coefficient |
Type of influence on Vavg |
|
f1 |
Road�s cross section and width of
lanes |
|
f2 |
Neighbourhood of the road |
|
f3 |
Type and condition of road surface |
|
f4 |
Side obstacles and parked vehicles
along the road |
|
f5 |
Location of the road in the city |
|
f6 |
Curvature of the road |
|
f7 |
Inclining of the road |
|
f8 |
Junctions with other roads |
|
f9 |
Visibility of the roads surface |
We propose an additional coefficient
fe (4) as a product of the
coefficient determined by various (including random) events occurring in road
traffic in cities.
![]() ���������������������������������������������������������� (4)
���������������������������������������������������������� (4)
This can include any delays as a
result of slowly moving vehicles, pedestrian crossings, bus/tram stops,
roadworks etc., as well as variable weather conditions or illumination and
visibility on the road [19]. A number of additional coefficients can be
adjusted to the purpose of research and tests related to traffic in a city.
3. METHODOLOGY OF TESTS � DESCRIPTION OF THE
DATA COLLECTION
The proposed method for identifying
events that can decrease vehicle speed in cities is based on registering thee
reason why a vehicle is decreasing its speed or even stopping. The principle of
the method and data collection is shown in Figure 1.
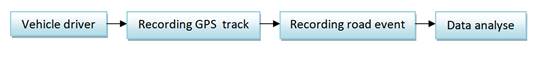
Fig. 1. Principle of
data acquisition about events in the traffic
A device with an application must be
equipped with a GPS receiver. A user/driver on a trip, while recording a GPS
track, selects an appropriate icon when a road event occurs. A set of icons is
configurable for characteristic conditions in a city. The set of icons can
include signs for traffic lights, pedestrian crossings, bus stops, slow moving
vehicles, bad weather conditions (ice, snow etc.) and many other phenomena to
be defined by a user. Each encounter with an event in which a driver had to
slow down or stop their vehicle should be recorded. The resulting data file
includes the GPS track and events recorded by a driver or application user. An
illustration of such a record is shown in Figure 2.
�
Fig. 2. Example of the
speed profile of a route in a city including events that can impact on vehicle
speed
It is therefore possible to
determine the position and speed of the vehicle with satisfactory precision [20,21].
This kind of record accurately highlights the travel time delays for each
section of a route. The results can be also sent dynamically to a traffic
management centre [22,23].
The proposed method of data
recording requires the application installed on a touchscreen that is equipped
with a mobile device. Using this application should be simple and involve a
selection of icons to describe an event occurring in traffic (traffic lights,
pedestrian crossings, slow moving vehicles, bus stops etc.). Each event is
represented by an appropriate icon.
Another method of recording is based
on voice recognition with commands representing the various types of occurring
event. In this case, during the concurrent recording of the GPS track of the
vehicle, the commands describing traffic conditions are recognized and
recorded. The principle of data recording is similar to the first method, but
an application user does not need to press any icons on the touchscreen. This
means that data input is safer, as the application can recognize several basic
commands describing current traffic conditions.
The testing system allows for
recording and evaluating all conditions that can occur during travel, as well
as identifying different factors that can decrease speed and extend travel
time, such as weather conditions, traffic and congestion levels, traffic
lights, roadworks and slow moving vehicles. The results are especially useful
for municipal traffic management authorities. In this way, the current settings
of road signs and traffic lights, and the influence of the other events, can be
examined and verified.
The types of data obtained by the
system require additional information from existing traffic management systems,
especially the current number of vehicles on the roads. All these aggregated
data constitute the basis on which traffic modelling systems obtain optimal
parameters.
To obtain highly accurate results,
records should be made by several vehicles operating in a selected area of a city.
Figure 3 shows the possible data sources for the purpose of further analysis.
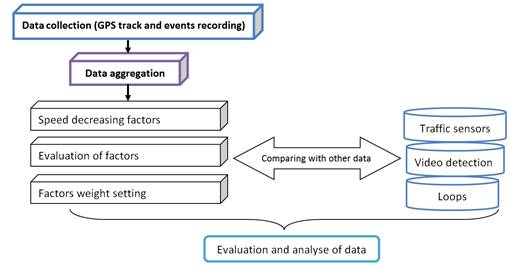
Fig. 3. Event
recording and traffic data analysis
Selecting the weight of the factors
allows us to evaluate their impact on each section of the road [22,23,24]. In
turn, traffic management authorities can modify certain components of the road
infrastructure or change the traffic rules. This could be carried out after
statistical analysis of the collected data for a selected period of time. Data
collected dynamically can be used in real time to update digital map-based
systems.
4. PRELIMINARY RESULTS FOR TESTING THE
APPLICATION IN GLIWICE
Figure 5 shows a map of Gliwice with
the areas of the tests indicated. The city is bordered by two motorways, A4 and
A1. Another dual carriageway, No. 902, links the city with other cities in the
Silesian conurbation. In the city centre, the old town area has limited
traffic, but other roads are often congested during peak hours.�
Fig. 4. Test areas in Gliwice
A prototype of an application was
used for the tests in Gliwice. The testing vehicle was routed in the loops of
the city centre of Gliwice. Recording was provided by a passenger in the
vehicle to ensure the safe registration of events. The GPS track was
concurrently recorded. The tests were conducted in three different months
(March, May and December) during the typical working day (08:00-20:00). The
vehicle was routed in a loop along the streets highlighted in Figure 5.
Data recording was conducted in a
repeated sequence to minimize errors in changeable traffic flow in continuous
loops. After data recording was completed, each section of the track was
investigated.
Table 2 shows the distribution of reasons why
the test vehicle stopped during the entire study.
Tab. 2
Distribution of reasons why the vehicle stopped
in Gliwice�s central loop
|
Vehicle stop reason |
Occurrence in % |
|
Traffic
lights |
66% |
|
�Give
way� road sign |
11% |
|
Pedestrian crossing with traffic lights |
9% |
|
�Stop�
road sign |
6% |
|
Pedestrian
crossing |
6% |
|
Bus stop |
2% |
����������� 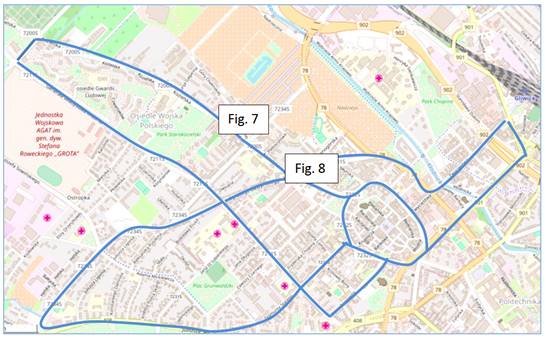
Fig. 5. View of Gliwice city centre
with streets used in the routing tests
(driving speed results are shown in Figures 7 and 8)
For the estimation of traffic flow
volume, the data from video detectors were analysed. Some of the data collected
from traffic cameras on Daszy�skiego Street are shown in
Figure 6. These data were used together with the results of the tests to
analyse individual sections of each road in Gliwice.
Fig. 6. Total number of vehicles (in
both directions) on Daszy�skiego Street
Data collection allowed us to record
each event and the consecutive decrease or increase in the vehicle�s speed and
the total travel time along individual sections of a route. Figures 7 and 8
show examples of the preliminary results for average speed in selected areas
(see Figure 5). The results show differences between the March, May and
December tests. The main reason was the modernization of the parallel road,
Andersa Street, which meant that the average speed for a specific time was
lower in May as indicated in Figure 7.
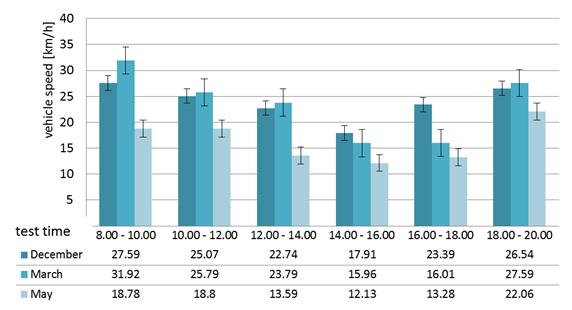
Fig. 7. Decrease in communication
speed due to a closed parallel road in the city
Other results relate to a different
section of the tested area. The average speed for December was higher than for
the other test months (March, May) in time range 08:00-16:00 (Figure 8). In
this case, the findings were connected to the closure of several firms at this
section of the road during the December holidays (Figure 9). The situation
changed after 18:00 when the speed decreased. This was connected with shopping
activity at the end of December resulting in increased traffic flow at that
time.
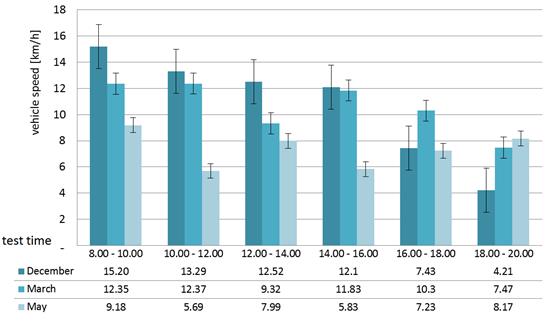
Fig. 8. Increased value in
communication speed for daytime hours in December due to holidays
5. CONCLUSIONS
A method of traffic data collection,
which focuses on why a vehicle decreases its speed or stops offers the
opportunity to identify and classify many traffic factors. Such a method is
important for the evaluation the current road infrastructure, including road
signs and potential hazards for drivers or pedestrians. The results of this
study show the potential value of the presented method for the identification
of factors can decrease vehicle speed. These data can be supplementary to those
provided by traffic data sensors placed in the city. The recorded speeds for
routing in the city centre indicate that reaching an average driving speed
above 30 km/h is very difficult. In many cases, the driving speed is below 20
km/h or, in some cases, below 10 km/h. Each transportation company delivering
goods should be aware of it when planning routes. The proposed application can
be equipped with voice commands for recording traffic conditions and vehicle
stop reasons. The cost of the proposed data collection is low and the described
method has offers traffic management authorities the potential to evaluate
traffic conditions in their cities.�
References
1.������ Savrasovs
M., Pticina I. 2017. �Methodology of OD matrix estimation based on video
recordings and traffic counts�. Procedia Engineering 178: 289-297. DOI:
10.1016/j.proeng.2017.01.116.
2.������ Yang
H., T. Sasaki, Y. Iida, Y. Asakura. 1992. �Estimation of origin-destination
matrices from link traffic counts on congested networks�. Transportation
Research Part B: Methodological 26:
417-434. DOI: 10.1016/0191-2615(92)90008-K.
4.������ Gartner
N.H., C.J. Messer, A.K. Rathi. 1997. Monograph on Traffic Flow Theory.
Washington, DC: Federal Highway Administration.
3.������ Duduta
N., C. Adriazola, D. Hidalgo, L.A. Lindau, R. Jaffe. 2015. �Traffic safety in
surface public transport systems: a synthesis of research�. Public Transport 7(2): 121-137.
4.������ Weisbrod
G., D. Vary, G. Treyz. 2003. �Measuring economic costs of urban traffic
congestion to business�. Transportation Research Record: Journal of the
Transportation Research Board 1839:
98-106.
5.������ Banister
D. 1996. �Energy, quality of life and the environment: the role of transport�. Transport
Reviews 16: 23-35.
6.������ Pandian
S., S. Gokhale, A.K. Ghoshal. 2009. �Evaluating effects of traffic and vehicle
characteristics on vehicular emissions near traffic intersections�. Transportation
Research Part D: Transport and Environment 14: 180-196.
7.������ Ando
Y., Y. Fukazawa, O. Masutani, H. Iwasaki, S. Honiden. 2006. �Performance of
pheromone model for predicting traffic congestion�. In Proceedings of the Fifth International Joint Conference on Autonomous
Agents and Multiagent Systems (AAMAS
2006): 73-80.
8.������ Lee
Y.M., S.Y. Chong, K. Goonting, E. Sheppard. 2017. �The effect of speed limit
credibility on drivers� speed choice�. Transportation Research Part F:
Traffic Psychology and Behaviour 45:
43-53. DOI: 10.1016/j.trf.2016.11.011.
9.������ Gargoum
S.A., K. El-Basyouny, A. Kim. 2016. �Towards setting credible speed limits:
Identifying factors that affect driver compliance on urban roads�. Accident
Analysis & Prevention 95:
138-148. DOI: 10.1016/j.aap.2016.07.001.
10.���� Topol�ek D., T. Cvahte Ojster�ek. 2017. �Do
drivers behave differently when driving a car or riding a motorcycle?�. Transport\Transporti Europei 66(4):
1-16. ISSN: 1825-3997.
11.���� Viti
F., S. Hoogendoorn, L. Immers, C. Tampère, S. Lanser. 2008. �National
data warehouse: how the Netherlands is creating a reliable, widespread,
accessible data bank for traffic information, monitoring, and road network
control�. Transportation Research Record: Journal of the Transportation
Research Board 2049:
176-185.
12.���� M�nguez
R., S. S�nchez-Cambronero, E. Castillo, P. Jim�nez. 2010. �Optimal traffic
plate scanning location for OD trip matrix and route estimation in road
networks�. Transportation Research Part B: Methodological 44: 282-298.
13.���� Dion
F., H. Rakha H. 2006. �Estimating dynamic roadway travel times using automatic
vehicle identification data for low sampling rates�. Transportation Research
Part B: Methodological 40:
745-766.
14.���� Lu
J., L. Cao. 2003. �Congestion evaluation from traffic flow information based on
fuzzy logic�. In Proceedings: IEEE Intelligent Transportation Systems Vol. 1: 50-53.
15.���� Ashton
W.D. 1996. The Theory of Road Traffic
Flow. London: Methuen & Co.
16.���� Szczuraszek
T. 2008. Pr�dko�� pojazd�w w warunkach drogowego ruchu swobodnego.
Warsaw: Studia z Zakresu In�ynierii; Komitet In�ynierii L�dowej i Wodnej PAN,
2008; ISBN 978-83-89687-39-5.
17.���� Szczuraszek,
T. 2008. Bezpiecze�stwo ruchu miejskiego. Wydaw: Komunikacji i ��czno�ci.
18.���� J�gerbrand
A.K., J. Sj�bergh. 2016. �Effects of weather conditions, light conditions, and
road lighting on vehicle speed�. SpringerPlus 5: 505. DOI: 10.1186/s40064-016-2124-6.
19.���� Fleischmann
B., S. Gnutzmann, E. Sandvo�. 2004. �Dynamic vehicle routing based on online
traffic information�. Transportation Science 38: 420-433.
20.���� Henclewood
D., M. Hunter, R. Fujimoto. 2008. �Proposed methodology for a data-driven
simulation for estimating performance measures along signalized arterials in
real-time�.� In Winter Simulation Conference: 2761-2768.
21.���� Florian
M., M. Mahut, N. Tremblay. 2008. �Application of a simulation-based dynamic
traffic assignment model�. European Journal of Operational Research 189: 1381-1392.
22.���� Schneider
W. �Mobile phones as a basis for traffic state information�. In Proceedings: 2005 IEEE Intelligent
Transportation Systems, 2005: 782-784.
23.���� Dimitriou
L., T. Tsekeris, A. Stathopoulos. 2008. �Adaptive hybrid fuzzy rule-based
system approach for modeling and predicting urban traffic flow�. Transportation
Research Part C: Emerging Technologies 16, 554-573.
24.���� Castro-Neto
M., Y.-S. Jeong, M.-K. Jeong, L.D. Han. 2009. �Online-SVR for short-term
traffic flow prediction under typical and atypical traffic conditions�. Expert
Systems with Applications 36:
6164-6173.
Received 11.10.2017; accepted in revised form 12.01.2018
![]()
Scientific Journal of
Silesian University of Technology. Series Transport is licensed under
a Creative Commons Attribution 4.0 International License