Article
citation information:
Gibała, Ł., Konieczny, J.
Application
of artificial neural networks to predict railway switch durability. Scientific Journal of Silesian University of
Technology. Series Transport. 2018, 101,
67-77. ISSN: 0209-3324. DOI:
https://doi.org/10.20858/sjsutst.2018.101.7.
Łukasz
GIBAŁA[1], Jarosław KONIECZNY[2]
APPLICATION OF
ARTIFICIAL NEURAL NETWORKS TO PREDICT RAILWAY SWITCH DURABILITY
Summary. The article presents the possibility of applying artificial
intelligence to forecast necessary repairs on ordinary railway switches.
Railway switch data from Katowice and Katowice Szopienice Północne
Stations were used to model neural structures. Using the prepared data set
(changes in values of nominal dimensions in characteristic sections of 15
railway switches), we created three variants of railway switch classifications.
Then, with the results, we determined the values of classifiers and the low
mean absolute error, as well as compared charts of effectivity. It was
calculated that the best solution by which to evaluate necessary repairs in
railway switches was, in part, to repair the crossing nose. It was assessed
that a structure with single output data was more effective for the accepted
data.
Keywords: artificial neural networks; railway
switch; maintenance; prediction
1. INTRODUCTION
In 2015, the Polish railway system
used 39,988 railway switches including 17,894 built on main tracks and running
lines and 22,094 built on tracks at stations [1]. The requirements for railway
switches grow all the time. The operation of railway switches affects the
availability of railway lines, so actions should be taken to improve
reliability. The complexity of the railway switch system requires preferential
improvements. The continuous
improvement of manufacturing techniques, as well as the processing technology
of steel and assembly construction, results in a useful life. Progress has been
seen in the field of environmental protection with the substitution of wooden
sleepers by concrete sleepers and in the scientific area, for example, in the
implementation of bainitic steel, polymeric sleepers and new diagnostic
techniques [6].
Conducting technical examinations is
necessary to confirm correct work in
“wheel-rail” junctions and reduce undesired processes, for example:
jamming wheelsets between wing rails and steering rails, hitting wheel flanges
at crossing noses or hitting wing rails before clear spaces. The greater the
tolerance field, the greater the difference between the permitted differences,
and the better adjustment of the tolerance field to measured values, such that
the railway switch can be used for a longer period without the necessity of
repair [9]. These undesired processes can be avoided by controlling and
reacting to crossed permitted differences in characteristic sections of railway
switches. Insignificant crossed permitted differences are not reasons for the
classification process or reasons for derailment. Differences should be
designed to ensuring the security of rail traffic and the stability of train
gears.
Therefore, development diagnostic
computer tools are intentional. Their operation affects infrastructure
management. By using them, it is possible to plan necessary maintenance work in
an easy way and reduce the implementation of speed limits, which impacts on
financial loss. For example, in 1999, the speed limits on the UK railway system
caused faults and damage to railway switches, which increased the travelling
time by 900,000 min, or by about 10%, costing GBP 18 million [2].
In the article, we present
possibility to use the program Statistica Neural Network PL 4.0 F, developed by
StatSoft, to evaluate necessary repair railway switches. Work measures are also
proposed to encourage infrastructure management, in order to deepen cooperation
with research units.
2. CURRENT DIAGNOSTICS OF RAILWAY SWITCHES ON THE PKP POLSKIE LINIE
KOLEJOWE (POLISH RAILWAY INFRASTRUCTURE MANAGEMENT)
Continuous monitoring of the
technical state and reacting to faults in railway switches are some of the
duties of track section employees, while the state carries out visual
inspection. In this type of research, artificial intelligence methods can also
be used. In the literature it is possible to find many examples of image
analysis using modern computer methods [14-17]. Diagnosis provides information
about actual states of elements: supporting, conjunctional, steel and sliding
in railway switches. Evaluating the usability of railway switches is necessary
for the smooth running of train routes. Moreover, work on switches should be
checked in commutating process. These activities are the duties of employees
involved in the technical regulation of operation points, where railway
switches are built. The results of visual inspection are noted in special registers.
Other kinds of diagnosis include the technical examination of railway switches.
This activity is also employees’ responsibility. Additionally, technical
examination should be carried out by commissions formed by employees and
supervisors.
The range of technical examinations
contains a process of visual inspection, which encompasses geometrical measures
in the characteristic section of the respective object. The results of activity
are noted in the same register for each object on technical examination sheets.
The frequency of measuring railway switches depends on the maximum speed and
load of the railway. The frequency of technical examinations in relation to
local parameters is presented in Table 1 [8].
Table
1
Frequency of technical measurement in PKP
Polskie Linie Kolejowe
|
No. |
Parameter |
Frequency of technical measurements as
defined by parameters |
||||
|
1 |
2 |
3 |
4 |
5 |
6 |
7 |
|
1 |
Speed [km/h] |
|
|
|
|
|
|
2 |
Load [Tg/year] |
- |
|
|
- |
- |
|
3 |
Basic frequency [months] |
6 |
6 |
3 |
3 |
2 |
|
4 |
Protracted frequency [months] |
Max. 12 |
Max. 9 |
Max. 6 |
Max. 6 |
Max. 3 |
Source: [8]
The parameter “load”
refers to the cumulative transport load in all directions on railway switches
expressed in the unit “teragram” in the period of one year (365
days).
The diagnosis of all kinds of
railway switches requires the presence of a person in a dangerous area where
rail traffic is conducted. It obligates an employee to show special care and an
adequate reaction when a train is approaching. The endangering of an
employee’s life is sufficient reason to develop new methods of diagnosis
without human reliability. Moreover, methods should not impede the conducting
of rail traffic.
3. PRESENTATION OF PREPARING BACKGROUND
ANALYSIS
3.1. Specification of used program
The program was developed through
knowledge of the biological nervous system, which is realized by complicated
chemo-electro processes. It uses two elementary building blocks, neurons and
synapses, in order to solve complicated arithmetical and technical problems.
Through learning and adapting to the evolving environment and creating a
universal system of approximation, a data set is reflected, while the
generalized collection of knowledge, via artificial neural networks, is able to
solve practical problems [11,20,21]. These networks solve issues related to
forecasting repairs of the track surface, diagnosing the track surface or
researching the reasons for derailment, as described in [5]. Another example of
using this tool is the improvement in materials in railway transport [7,18,19].
The functioning of the network is
based on transmitting input signal xi,
via synapses or “conjunctions”, to a neuron or “unit”.
Each input signal is multiplied by weight wi.
It can take positive values to work as stimulants, while negative values act as
brakes of the neuron output signal y.
The neuron executes two functions. After receiving all input signals xjwij, a
totalization block calculates the integer boost net. This is a sum of the values of input signals and weights. The
next-step activation block calculates the output function f, which is the output signal y.
The construction of the neuron block is presented in Figure 1.
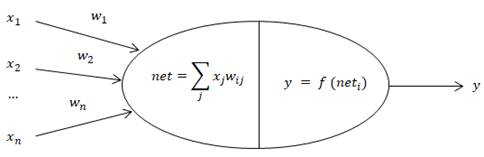
Fig. 1. Scheme of the McCulloch-Pitts neuron
Source: [10]
The learning process is based on the
choice of recurring weights. The learning of the network is automatic, while
the length of time depends on the size of the structure and can be interrupted
at any time by the user. The choice of the time depends on user experience, with
learning that is too low resulting in a big error. Lengthening learning means
that the structure will generate a big error too, but the input data set must
be changed [4].
The preparation of the neural
network starts when the data set that is input and the output data are
collected. This is the learning string. Data can be coded as:
a)
Alternative trait: 0 - the trait does not exist; 1 - the trait exists
(for example, a respective site is a railway switch with a diverging track
radius R = 500 - 1) and -1 is when the trait does not concern an
object.
b)
Numerical trait.
c)
The trait describes an increase or difference in the nominal dimension.
d)
Factors - elements of the final
formula [5].
Choosing the structure is not conditional on strict
rules but depends on the experience of the user. A common structure is the multilayer
perceptron (MLP), which is described as an easy training process. As mentioned
before, the neural structure is created by neural units and conjunctions. The
number of neural units in the input layer equals the amount of input data,
while the number of neural units in the output layer equals the amount of
output data.
3.2. Description of real objects
Technical examination sheets of railway switches were
used for the analysis of data. There are nominal dimensions in characteristic
sections: real values of these dimensions and the kinds of repairs made to
reduce or remove exceeded permitted differences.
Technical examination sheets were shared by PKP
Polskie Linie Kolejowe. In order to present the possibility of using the
mentioned program, nine ordinary railway switches were chosen with a radius of
900 m and one with a radius of 190 m, located at the end of Katowice Station.
The data set was enlarged four objects with a radius of 190 m and two with a
radius of 500 m from Katowice Szopienice Północne Station. The
railway switches work in train and manoeuvre routes.
The number of chosen objects is
insufficient to perform an unequivocal analysis, nor does it make a valuable
data set. The examination of diagnosis railway switches proved that even a
group of 200 objects is insufficient to obtain encouraging results [3].
The task of diagnostics with
longline artificial intelligence seems to be a duty of an infrastructure
manager’s engineering personnel, who have detailed knowledge about
objects.
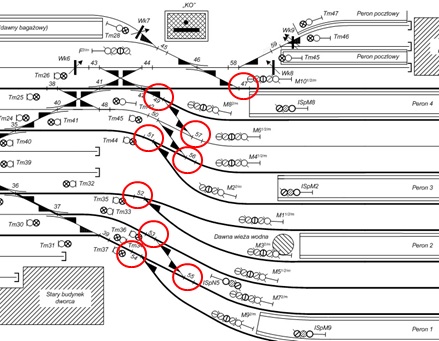
Fig. 2. Localization railway
switches at Katowice Station
Source: [12]
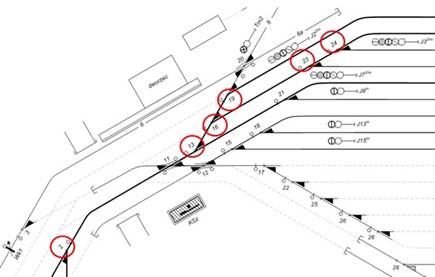
Fig. 3. Localization railway
switches at Katowice Szopienice Północne Station
Source: [13]
The objective of analysis was the
creation of a program, which would be able to evaluate the necessity to repair
railway switches, as follows:
·
A - exchanging half-switches and connecting railways lines, due to
chipping needles or excessive side wear.
·
B - tightening screws along railway switches due to excessive dynamic
effects from trains and degradation of sleepers.
·
C - automatic thickening of crushed stone
·
D - regulating the width of basic trails by local tightening of screws,
refilling fixation components or controlling the side wear of rails.
·
E - regulating the width of turning trails by local tightening of
screws, refilling fixation components or controlling the side wear of rails.
·
F - exchanging sleepers due to excessive degradation levels.
·
G - performing repairs at crossing noses by exchanging crossing noses,
flame-plating or exchanging steering rails due to wear.
3.3. Preparation of
the input and output data set
Input and output data sets, as
learning strings, were collected in an MS Excel spreadsheet. The input data
defined:
·
service speed in
basic trail ![]() [km/h]
[km/h]
·
service speed in
turning trail ![]() [km/h]
[km/h]
·
a kind of fixation
·
time from the first measure of dimensions to the last
[days]
·
bend of railway switch
·
radius of turning trail ![]() [m]
[m]
For every
measure calculated, evaluation indicators were determined according to [2] as follows:
·
indicator of synthesis maintains the accuracy of the railway switch ![]()
·
indicator of maximum relative over-dimension permitted differences ![]()
·
indicator of expanse differences ![]()
·
indicator of repeatability differences ![]()
Additionally,
there is a considered trend concerning the appearance of differences in each
group of characteristic dimensions. The numerical amount of characteristic
dimensions is added to the radius of the turning trail. Groups were created by
divisional dimensions, as presented in Table 2. The location of the
aforementioned dimensions for exemplary railway switches is presented in Figure
4.
Table
2
Apportionment of dimensions in characteristic places
|
Radius of turning trail |
Basic trail |
Turning trail |
Joints |
Width in part of the crossing nose |
|
|
|
|
|
|
|
|
|
|
|
|
|
|
|
|
|
|
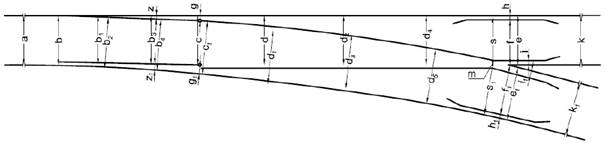
Fig. 4. Location characteristic dimensions in
railway switches with
a turning trail radius of 500 m
Source: [8]
The next
step was to add an output data set. In the spreadsheet, necessary repairs were
coded as “1”, while the absence of need was coded as
“0”. A fragment of the spreadsheet is presented in Figure 5.
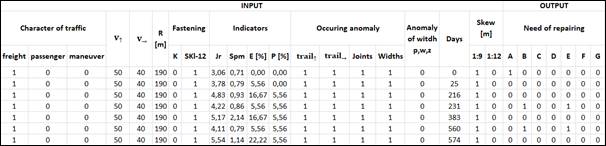
Fig. 5. Fragment
of spreadsheet program with a learning string
3.4. Triple variant
analysis of the neural structure
On the grounds of a prepared
learning string, three attempts were made to model optimal neural networks,
which would point out necessary repairs to the railway switches.
Every time, from Set 424 and for the
third variant of 426, the proposed structures program saved 10 with the best
parameters. From the 10 structures, one was chosen as being guided by value
classifiers, a low mean absolute error and the possibility of comparing the
charts’ receiver
operating characteristics (ROC) in terms of
calculation efficacy. All structures were MLP-learned
using the backpropagation method. The received structures are presented in
Figure. 6.
Prepared sensitivity
analyses suggest that the indicators of evaluation are kinds of traffic
(F-freight, P-passenger, M-manoeuvre) and time influences on results. The range
of input data, which were prioritized, depended on neural structures. A common
feature for all variants, in terms of importance, was the indicator of expanse differences ![]() . Meanwhile, the lowest influential rate
was an indicator of synthesis, which maintains the accuracy of the railway
switch
. Meanwhile, the lowest influential rate
was an indicator of synthesis, which maintains the accuracy of the railway
switch ![]() , as presented in Table 3.
, as presented in Table 3.
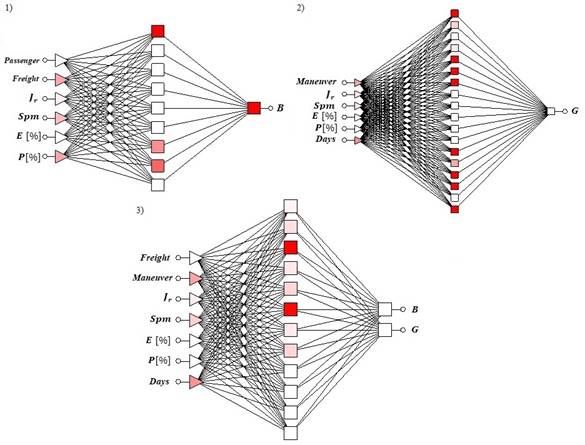
Fig. 6. Achieved neural networks: 1) MLP 6-9-1,
2) MLP 6-18-1, 3) MLP 7-12-2
Table
3
Presentation of input degrees according to
variants
|
Degree |
No. of variant |
Character of traffic |
Indicator |
Days |
|||||
|
F. |
P. |
M. |
|
|
|
|
|||
|
I |
6 |
3 |
- |
5 |
4 |
2 |
1 |
- |
|
|
II |
- |
- |
4 |
6 |
1 |
3 |
5 |
2 |
|
|
III |
2 |
1 |
7 |
6 |
5 |
3 |
- |
4 |
|
The structure MLP 6-9-1 for Variant
1 describes a highly correct coefficient equal to 0.96 and a value area under
the ROC curve equal to 0.69. This provides information about classification
near to random classification. Sensitivity analysis highlights that there are
braking input data comprising freight traffic. The mean absolute error equals
0.38, which is evaluated as a very good rate.
In Variant 2, we chose the structure
MLP 6-18-1, which is evaluated with a great rate. The structure is described by
the following:
·
right classification of the current coefficient equals 1.00
·
area under the ROC curve equals 0.99
These values determined the choice structure by which
to evaluate the necessity to repair railway switches. The mean absolute error
equals 0.24, while the value quotients of differences are positive about the
correctness result.
The last proposed result is the
structure MLP 7-12-2, as described by the correlation coefficient, which equals
-0.04, and the regression coefficient, which equals 1.74. These values
undermine MLP 7-12-2. Contrary to previous variants, Variant 3 has two output
data. A negative assessment can be connected with reference to these two
results.
The summary of results from three
variants informs us that the non-zero classification error for Variant 3 equals
0.22. This means that it functions as risk classification data.
4. SUMMATION
As a result of scientific work, we have the neural network
MLP 6-18-1 structure. The type of details and numerical amounts in this
structure allow for an evaluation of the necessary repair element of railway
switches - crossing the nose points of the neural network. The architecture of
structures and solutions depends on a learning string.
The article was prepared on the basis of a limited amount
of information about objects. It points to the possibility of creating a simple
structure without taking into account complicated variables. The solution proposed
is aimed at encouraging the creation of a universal network. It should be
helpful for management work.
The presented works offer the possibility of utilizing
artificial intelligence to diagnose and maintenance railway infrastructures.
The results seem to be advantageous and allow for identifying the need to
repair any component of infrastructure.
Research on neural networks requires ongoing work, in
order to encourage anyone in the field to study the problem at the core of this
paper. That said, progress will not be possible without cooperation from an
infrastructure manager.
References
1.
PKP
Polskie Linie Kolejowe. Raporty roczne
2010-2015. [In Polish: Annual Reports 2010-2015.] Available at:
https://www.plk-sa.pl/biuro-prasowe/raport-roczny/.
2.
Bałuch
Henryk, Maria Bałuch. 2010. Determinanty
prędkości pociągów-układ geometryczny i wady toru.
[In Polish: Determinants of Train
Speed-track Geometry and Faults.] Warsaw: Instytut Kolejnictwa. ISBN
978-83-930070-0-5.
3.
Bałuch
Henryk, Maria Bałuch. 2009. Eksploatacyjne
metody zwiększenia trwałości rozjazdów kolejowych.
[In Polish: Exploitative Methods of
Increased Railway Switch Durability.] Warsaw: Centrum Naukowo-Techniczne
Kolejnictwa. ISBN 798-83-930070-0-4.
4.
Bałuch Maria.
2005. Interpretacja pomiarów i
obserwacji nawierzchni kolejowej. [In Polish: Interpretation of Measurements and Observations of Track Structure.]
Radom: Zakład Poligraficzny Politechniki Radomskiej. ISSN 1642-5278.
5.
Bałuch
Henryk, Maria Bałuch.
1997. “Sieci neuronowe jako narzędzie rozwiązywania
problemów z zakresu dróg kolejowych”. [In Polish: “Neural Networks as Tools to Solve
Problems on Railway Lines”.] Problemy
Kolejnictwa 124: 35-62. ISSN 0552-2145.
6.
Buława
Mariusz, Krzysztof Semrau.
2013. “Niezawodność systemu rozjazdowego-wybrane zagadnienia”.
[In Polish: “Reliability of Railway Switch
System-selected Problems”.] Nowoczesne
technologie i systemy zarządzania w transporcie szynowym. Zeszyty
Naukowo-Techniczne Stowarzyszenia Inżynierów i Techników
Komunikacji Rzeczpospolitej Polskiej Oddział w Krakowie 3(102): 49-59.
ISSN 1231-9155.
7.
Garbarski
Jacek, Mariusz Fabijański. 2012. “Application of Artificial Neural
Networks to Shape Properties of Polymers Destined for Use in Railway
Transport”. Problemy Kolejnictwa 154:
47-59. ISSN 0552-2145.
8.
PKP Polskie Linie Kolejowe. Instrukcja o
oględzinach, badaniach technicznych i utrzymaniu rozjazdów. [In Polish: Instruction on Visual
Inspections, Technical Examinations and Maintenance of Railway Switches.]
Available at: https://www.plk-sa.pl/dla-klientow-i-kontrahentow/akty-prawne-i-przepisy/instrukcje-pkp-polskie-linie-kolejowe-sa/instrukcje-z-mozliwoscia-podgladu/.
9.
Kędra Zbigniew. 2017. Technologia robót torowych. [In Polish: Technology of Track Works.] Gdańsk: Wydawnictwo Politechniki
Gdańskiej. ISBN 978-83-7348-691-1.
10.
Markowska-Kaczmar Urszula, Halina Kwaśnicka. 2005. Sieci neuronowe w zastosowaniach: praca
zbiorowa. [In Polish: Neural Networks
in Applications: Joint Publications.] Wrocław: Oficyna Wydawnicza
Politechniki Wrocławskiej. ISBN 978-83-7085-906-0.
11.
Osowski Stanisław. 2006. Sieci
neuronowe do przetwarzania informacji. [In Polish: Neural Networks to Process Information.] Warsaw: Oficyna Wydawnicza Politechniki
Warszawskiej. ISBN
978-83-7207-615-1.
12.
Semaforek. Schemat stacji Katowice. [In Polish: Track Scheme of Katowice
Station.] Available at:
http://semaforek.kolej.org.pl/wiki/htmlets/Katowice.png.
13.
Semaforek. Schemat stacji Katowice
Szopienice Północne. [In Polish: Track Scheme of Katowice Szopienice Północne
Station.] Available at:
https://semaforek.kolej.org.pl/wiki/images/a/a0/Katowice_szopienice_polnocne.png.
14.
Ogiela L., R. Tadeusiewicz, M. Ogiela. 2006.
“Cognitive analysis in diagnostic DSStype IT systems”. In Eighth International Conference on
Artificial Intelligence and Soft Computing (ICAISC 2006). 25-29 June 2006.
Zakopane, Poland. Book Series: Lecture Notes in Computer Science Vol. 4029:
962-971.
15.
Ogiela L., R. Tadeusiewicz, M. Ogiela. 2006.
“Cognitive computing in intelligent medical pattern recognition
systems”. In D.S. Huang, K. Li, G.W. Irwin, eds., International Conference on Intelligent Computing (ICIC). 16 August
2006. Kunming, China. Book Series: Lecture
Notes in Control and Information Sciences Vol. 344: 851-856.
16.
Ogiela M., R. Tadeusiewicz, L. Ogiela. 2005.
“Intelligent semantic information retrieval in medical pattern cognitive
analysis”. In O. Gervasi, M.L. Gavrilova, V. Kumar et al., eds., International Conference on Computational
Science and Its Applications (ICCSA 2005) Vol. 4. 9-12 May 2005. Singapore.
Book Series: Lecture Notes in Computer Science Vol. 3483: 852-857.
17.
Tadeusiewicz R., L. Ogiela, M. Ogiela. 2008.
“The automatic understanding approach to systems analysis and
design”. International Journal of
Information Management 28(1): 38-48.
18.
Michalski R., S. Wierzbicki. 2008. “An analysis
of degradation of vehicles in operation”. Eksploatacja i Niezawodnosc - Maintenance and Reliability 1: 30-32.
19.
van Oort N., R. van Nes. 2009. “Regularity
analysis for optimizing urban transit network design”. Public Transport 1(2): 155-168. DOI: https://doi.org/10.1007/s12469-009-0012-y.
20.
Mohammad Rasouli, Hamid Nikraz. 2014. “Application
of generalised regression neural networks in trip distribution modelling”.
Road & Transport Research 23(3):
13-25.
21.
Ittmann H.W. 2017. “Private-public partnerships:
A mechanism for freight transport infrastructure delivery?” Journal of Transport and Supply Chain
Management 11 (a262): 1-13. DOI: https://doi.org/10.4102/jtscm.v11i0.262
Received 02.08.2018; accepted in revised form 08.11.2018
![]()
Scientific
Journal of Silesian University of Technology. Series Transport is licensed
under a Creative Commons Attribution 4.0 International License