Article
citation information:
Keyvanfar, A., Shafaghat, A., Lamit,
H. A decision support tool for a walkable integrated neighbourhood design using
a multicriteria decision-making method. Scientific
Journal of Silesian University of Technology. Series Transport. 2018, 100, 45-68. ISSN: 0209-3324. DOI: https://doi.org/10.20858/sjsutst.2018.100.5.
Ali KEYVANFAR[1],
Arezou SHAFAGHAT[2], Hasanuddin LAMIT[3]
A DECISION SUPPORT TOOL FOR A WALKABLE INTEGRATED NEIGHBOURHOOD DESIGN
USING A MULTICRITERIA DECISION-MAKING METHOD
Summary. Growing concern about
transportation emissions and energy security has persuaded urban professionals
and practitioners to pursue non-motorized urban development. They need an
assessment tool to measure the association between the built environment and
pedestrians’ walking behaviour more accurately. This research has
developed a new assessment tool called the Walkable Integrated Neighbourhood
Design (WIND) support tool, which interprets the built environment’s
qualitative variables and pedestrians’ perceptual qualities in relation
to quantifiable variables. The WIND tool captures and forecasts
pedestrians’ mind mapping, as well as sequential decision-making during
walking, and then analyses the path walkability through a decision-tree-making
(DTM) algorithm on both the segment scale and the neighbourhood scale. The WIND
tool measures walkability by variables clustered into five features, 11 criteria
and 92 subcriteria. The mind-mapping analysis is presented in the form of a
‘Walkability_DTM-Mind-mapping sheet’ for each destination and the
overall neighbourhood. The WIND tool is applicable to any neighbourhood cases,
although it was applied to the Taman Universiti neighbourhood in Malaysia. The tool’s
outputs aid urban designers to imply adaptability between the neighbourhood
environment and residents’ perceptions, preferences and needs.
Keywords: walkability; walkable
city; assessment model; pedestrian behaviour; decision-tree-making; decision
support tool.
1. INTRODUCTION
Growing concern about transportation emissions and energy security has
led to green urban development policies, strategies and techniques (Mikalsen et
al., 2009). Urban and transportation professionals are trying to change
conventional urban design and planning strategies in order to reduce the travel
demand as much as possible. For instance, the compact city strategy supports
the use of non-motorized modes of travel, which can considerably reduce CO2
and other hazardous transportation emissions. Indeed, walkable urban design and
planning can absolutely contribute to this goal. The professionals and
practitioners of green urban development can persuade people to select walking
rather than other available modes. Since the last decade, there is a number of
studies enabling us to better understand and measure more accurately the
association between the built environment and individuals’ walking
behaviour, with the goal of CO2 reduction and fuel savings. Croucher
et al. (2007) and Zhang et al. (2014) state that, although many studies find
that walking behaviour is influenced by neighbourhood environment
characteristics and form, the terminologies ‘walkable’ and
‘walkability’ are still being investigated (Tiwari, 2015; Forsyth,
2015). Saelens et al. (2003) find that residents who live in a high-walkable
neighbourhood take almost 200% more walking trips than residents in
low-walkable neighbourhoods. According to a report by Parsons Brinckerhoff
Quade and Douglas Inc. (1993), the pedestrian-oriented environment of Oregon in
the US state of Portland could achieve a 10% reduction in vehicle-miles
travelled (Leslie et al., 2007).
2. RESEARCH BACKGROUND
Urban and transportation
researchers have developed several urban walkability assessment models and
decision support tools. The investigation into urban walkability assessment
studies shows inconsistencies in the built environment’s
‘qualitative variables measurements’ and ‘perceptual
qualities’. These studies highlight that the interpretation of qualitative
and quantifiable variables is very difficult work. The research conducted by
Ewing et al. (2006) and Saelans et al. (2003) indicates a tight relationship
between ‘perceptual qualities’ and ‘personal reactions’
in walking behaviour studies. Meanwhile, the association between
‘perceptual qualities’ and ‘personal reactions’ in
walkable neighbourhood design has not been studied in depth. Ewing et al.
(2007) has proposed a measurement protocol for perceptual qualities and
personal reactions as walkable urban design attributes; however, it has not yet
been practically applied in empirical studies. Urban walkability is measured
across diverse attributes and principles. For example, Bradshaw (1993) has
developed a neighbourhood walkability rating system, which evaluates proximity
and connectivity as the measures of walkability. His model involves a set of
indicators including density, persons per acre, off-road parking spaces per
household, the number of sitting spots per household, the chance of meeting
someone while walking, the ranking of safety, the responsiveness of transit
services, the number of neighbourhood places of significance, acres of parkland
and pavements. Cervero and Radisch (1996) have measured the urban walkability
based on mixed land use, grid-like street patterns, and integrated networks of
pavements and pedestrian paths. Offering support, Leyden (2003) and Shafray and
Kim (2017) state that a walkable neighbourhood, as a traditional or complete
neighbourhood, can be found mostly in older cities, which have mixed land uses
within walking distances. Ewing et al. (2007) have studied walkability based on
the association between urban sprawl and traffic, air pollution, central city
poverty and the degradation of scenic areas to highlight walkability aspects.
The measures of their study included residential density, neighbourhood mixed
land use, the strengths of centres and the accessibility of street networks.
Leslie et al. (2007) have also measured walkability with regard to the ease of
street crossing, pavement continuity, street connectivity and topography.
Although the researchers have considered numerous attributes for walkability
measurement, an integrated package of environmental and social quantities
remains certain.
Existing urban
walkability rating systems/tools have employed diverse methods to subjectively
and/or objectively measure the association between built environment
walkability and pedestrians’ walking behaviour. The methods are:
geographic information systems (GIS), audit tools, recall questionnaires, self-report
tools and sensor motion. For instance, Lesli et al. (2007) and Bejleri et al.
(2011) have applied GIS to measure built environment features (through
connectivity, land use attributes, dwelling density and net retail area, which
may influence adults’ physical activity). Moudon et al. (2006) have
developed an audit tool to measure environmental variables of neighbourhood
walkability based on residential density, street block lengths around homes,
distance from home to daily retail facilities and to different destinations.
Reviewing the urban walkability assessment models shows that the auditing
method is a the most selected and trustable method (Pikora et al., 2003;
Clifton et al., 2007; Reid, 2008; Millington et al., 2009, Forsyth et al.,
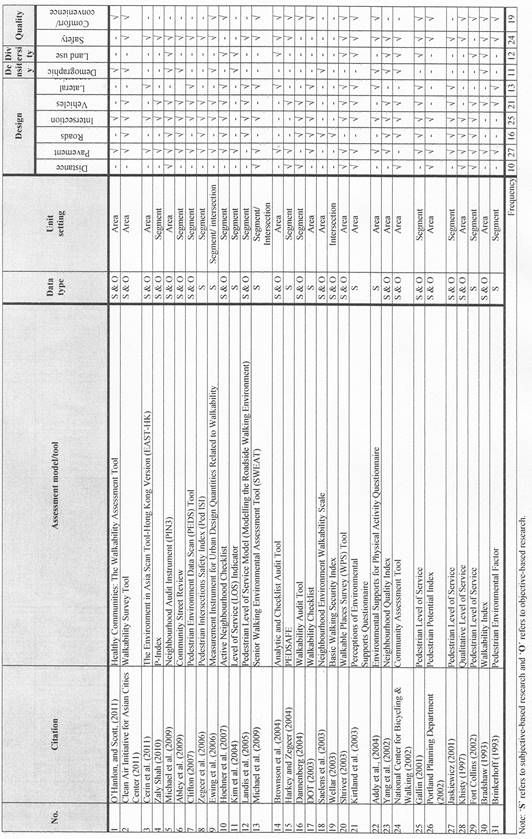
2010; Cerin et al., 2011). The current research has reviewed the existing
auditing-based walkability assessment tools. Table 1 presents the content
analysis of the reviewed models/tools, which are synthesized based on the type
of data (i.e., subjective: ‘S’, objective: ‘O’), unit
setting (area, segment or intersection), 3Ds (design, density, diversity) and
environmental quality aspects. According to Table 1, design and quality are the
most important factors in urban walkability rating systems/tools.
Table 1
Content
analysis on auditing-based urban walkability assessment models/tools
3. PROBLEM
STATEMENT
A few urban walkability
rating systems/tools have used multicriteria decision-making (MCDM) methods,
namely: 1) Pedestrian Infrastructure Prioritization (PIP) Decision System
(Moudon et al., 2006) from the University of Washington, US; 2) PEDSAFE (Harkey
and Zegeer, 2004) from the University of North Carolina, US; and 3) Pedestrian
Performance Measure System (Dixon et al., 2007) from the University of
Delaware, US. These assessment tools have been developed for transportation
planning and urban planning purposes. Meanwhile, there is no walkability
assessment model for urban designers to evaluate pedestrians’
decision-making in route selection. On the other hand, policymakers, urban
planners and designers are seeking to develop an assessment tool for measuring
neighbourhood walkability coupled with the inclusive users’ (i.e.,
pedestrians’) cognitive behaviour, which is applicable globally. In this
regard, Badland and Schofield (2005) state that there is a crucial need to
systematically enhance existing assessment tools regarding the end user
approach (i.e., pedestrian approach). In particular, pedestrians’
sequential decision-making about route selection has not been applied in the
existing urban walkability assessment tools, while sequential decision-making
(as DTM) has the potential to be applied in pedestrian behaviour analysis.
Pedestrians’ sequential decision-making can cover two descriptive
focuses: how pedestrians actually make decisions and how a normative vision
should be made, based on their decisions (Svenson, 1998).
Therefore, capturing and
forecasting pedestrians’ sequential decision-making during walking
require advanced walkability assessment modelling integrated with the DTM
method. Such modelling can evaluate how a neighbourhood’s physical and
environmental qualities influences residents‘ (i.e., pedestrians’)
walking behaviour, in turn warranting their DTM approach. In this regard, the
current research has developed a new walkability assessment tool called the
WIND support tool. Juxtaposing the outputs of this tool helps urban designers
to make future decisions about path development through implying much more
adaptability between neighbourhood environment characteristics and
residents’ needs, preferences and perceptions.
While there are diverse
walking typologies depending on destination type and activity schedule
(including walking for shopping, walking to school, walking to work, walking
for recreation, walking for shopping, walking to religious places), the scope
of the current study is walking for
shopping. This type of walking is a non-scheduled walking; thus, a broad range
of sampling size is offered, including older people, young people, children and
parents, in the form of individuals or groups with a wide range of preferences,
satisfaction levels and attitudes.
4.
MATERIALS AND METHODS
4.1.
Variables
The WIND support tool
has been developed based on two philosophical approaches to defining walkability.
This model indicates that walkability can be been defined as a
‘well-designed’ walkable urban environment or a
‘most-in-use’ walkable urban environment. The current study
presents the ‘most-in-use’ concept of urban walkability, as the
other concept has been presented in other work. Urban designers and planners
claim that walkable paths have a pedestrian-oriented design. But, in reality,
such paths may not be used by pedestrians. In this regard, the
‘most-in-use’ urban walkability assessment model aims to
investigate and quantify the paths that reflect pedestrians’ needs and
preferences, which are neither well-designed nor facilitated; pedestrians are
mostly looking for a short path to their destination. Most-in-use walkability
is a measure of the urban form and the quality and availability of pedestrian
infrastructure availability, including facilities and amenities, as well as the
promotion of efficiency and safety of pavements, walkways and pedestrian
bridges.
According to Kockelman
(1997) and Clifton et al. (2007), it is essential to indicate a comprehensive
list of walkability variables for use in walking assessment modelling. To date,
a few walkability variables have been empirically analysed and measured for
their influence on walking behaviour. The current research has identified a
comprehensive list of walkability variables clustered into three layers (Layer
1: features, Layer 2: criteria, Layers 3: subcriteria) in association with
pedestrians’ decision-making and route selection behaviours. The list of
walkability variables has been extracted through an in-depth critical review of
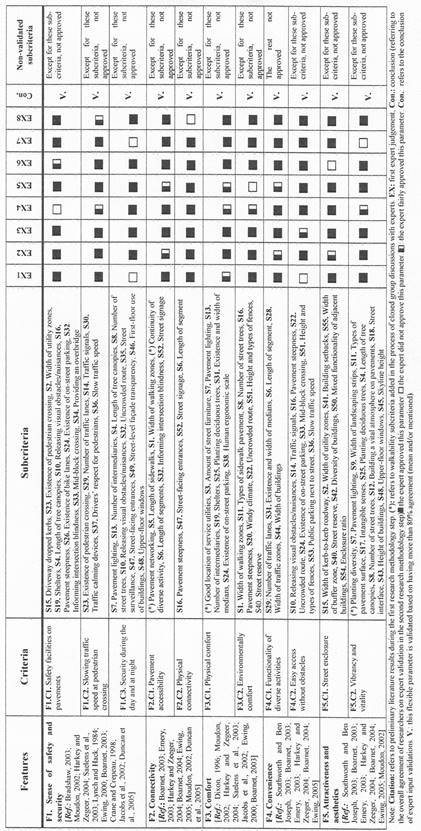
walkability assessment studies. An expert input study was conducted to validate
the list of walkability variables. Eight experts with knowledge and experience
of green urban development, decision-making science, cognitive behavioural
science and assessment tool development have validated them as presented in
Table 2. In this table, the ‘most-in-use’ urban walkability
assessment model involves 108 walkability variables, clustered into five
walkability features, 11 walkability criteria and 92 walkability subcriteria.
4.2
Mind-mapping method
Behavioural mind mapping
is a method related to various aspects of behaviour in physical spaces where
people are observed (Ittelson, 1986). Ittelson (1986) expresses that
behavioural mapping is a specific technique for studying environmental
influences on behaviour. For him, mind mapping or map building is a
mental-mapping approach to investigate why and how people reach a place. Mind
mapping captures and indicates the spatial knowledge of people (i.e.,
respondents) of their living area, as well as the spatial relation of a place
to adjacent structures including paths and routes. In this regard, the WIND
support tool has employed the mind-mapping method as a trustable measure for
capturing pedestrians’ individual rationale for their preferred route
from the origin (i.e., home) to three destinations (i.e., shopping centres).
Mind mapping was included in the first part of a questionnaire survey form,
which is presented in the following section.
Table 2
Summary of literature
review and expert study for
identifying path walkability assessment variables
4.3
Decision-tree-making method
The WIND support tool
uses the DTM method for collecting and analysing pedestrians’
decision-tree patterns in route selection from the origin (i.e., their home) to
three destinations (i.e., shopping centres). The DTM method has four potential
advantages to be exploited when developing the WIND support tool. The following
briefly explains these advantages:
§
First, most of the previous walkability studies have focused on urban
and neighbourhood scales, while they are lacking with data at the individual
(i.e., pedestrian) level (Boarnet, 2005). These walkability studies have also
assigned the same environmental score to all residents in a neighbourhood
without involving the route’s quality data and information (Park, 2008).
Subsequently, the environmental characteristics of the selected route were
inaccurately generalized to characteristics of the overall neighbourhood
(Krizek, 2006). Nevertheless, the individual’s personal walking
experience and preferences may vary (Park, 2008). Therefore, the urban scale
has shortcomings in terms of the individual’s walking behaviour analysis
in the route selection study.
§
Second, walkability studies on the urban scale erroneously treat all
streets in a neighbourhood equally (Schlossberg, 2004), while route-level
walkability based on DTM enables us to assign a score to each street and
segment.
§
Third, self-selection is one of the drawbacks of neighbourhoods’
comparative studies (Cervero and Duancan, 2003). According to Handy et al.
(2006), the deficit obtained from such studies might be confounded with
individuals’ preferences and attitudes, such that researchers are not
able to identify whether an environmental factor or human attitude affects
their walking behaviour. Indeed, pedestrians’ DTM analysis may not be
completely free from self-selection, but could be a trustable alternative to
find out the main causes of self-selection. Accordingly, the current plans to
analyse pedestrians’ DTM in terms of route selection seek to clarify
further the relation between environmental factors or pedestrian attitude.
The WIND support tool
determines the walkability weight of the facilitated paths within the
neighbourhood area by pedestrians’ DTM. The analysis of path walkability
variables (including Layer 1, Layer 2 and Layer 3) will follow by using
Equations 1 to 3. It will indicate the priority of path walkability needs in
this under-surveyed neighbourhood area. Equations 1 and 1a are used to evaluate the response to walkability variables,
including Layer 1 (walkability features (![]() )), Layer 2 (walkability criteria (
)), Layer 2 (walkability criteria (![]() )) and Layer 3 (walkability subcriteria (
)) and Layer 3 (walkability subcriteria (![]() )). The ‘average rate value’ of each
variable (
)). The ‘average rate value’ of each
variable (![]() ) is
calculated by the following equation;
) is
calculated by the following equation;
![]() =
= ![]() (1)
(1)
where ‘![]() ’ is the abbreviation for rate value of each variable
’ is the abbreviation for rate value of each variable
(![]() ) by rth respondent (Rr). It will be
calculated using Formula 1a.
) by rth respondent (Rr). It will be
calculated using Formula 1a.
![]() is the ‘minimum possible rate of the variable by respondent’
(rate of the variable by rth respondent - 1).
(1-a)
is the ‘minimum possible rate of the variable by respondent’
(rate of the variable by rth respondent - 1).
(1-a)
Equation 2 is used for
variables involved in Layer 1 (i.e., walkability features).
The
‘actual rate value’ of each walkability feature (![]() ) =
) =
(![]() )
) ![]()
![]() (
(![]()
![]() Max (
Max (![]()
![]()
![]() )
(2)
)
(2)
where:
§ ![]() is the feature number
‘i’, in which ‘i’ can be 1, 2, 3, 4 or 5
is the feature number
‘i’, in which ‘i’ can be 1, 2, 3, 4 or 5
§ ![]() is the criteria
number ‘j’, in which ‘j’ can be 0, 1, 2 or 3
is the criteria
number ‘j’, in which ‘j’ can be 0, 1, 2 or 3
§ ![]() is the subcriteria
number ‘k’ which ‘k’ can be 0, 1, 2, 3, 4, 5, 6, 7 or 8
is the subcriteria
number ‘k’ which ‘k’ can be 0, 1, 2, 3, 4, 5, 6, 7 or 8
The WIND tool shows the grounded
capacity of each path segment to be benchmarked in the area of study. Based on the score of each variable
in Layer 3 (![]()
![]() ,
it is possible to propose the final priority of the destination walkability
(meco-scale). The model results can be used as the benchmark for urban managers
in pursuit of future neighbourhood development/redevelopment and corrective
actions. This process will provide a walkability index for two applications:
firstly, a walkability index for each destination (meso-scale); second, a
walkability index for the overall neighbourhood area (macro-scale).
,
it is possible to propose the final priority of the destination walkability
(meco-scale). The model results can be used as the benchmark for urban managers
in pursuit of future neighbourhood development/redevelopment and corrective
actions. This process will provide a walkability index for two applications:
firstly, a walkability index for each destination (meso-scale); second, a
walkability index for the overall neighbourhood area (macro-scale).
The WIND support tool has
formulated the following model to measure a ‘path segment walkability
index score’ (as the micro-scale) (Equation 3):
Path segment
walkability index score ![]() =
= ![]() =
=![]()
![]() (3)
(3)

5. ANALYSIS
5.1. Mind-mapping
analysis
The research has applied
the WIND support tool to the Taman Universiti neighbourhood in the city of
Skudai, Malaysia. The Taman Universiti neighbourhood has various land uses
(including residential, commercial, school, mosque, shopping centre and public
facilities) located within standard pedestrian walking distances. As the
research has focused on walking for shopping, the Taman Universiti
neighbourhood was selected due to its accessibility to three large-scale
centres. In addition, in the Taman Universiti neighbourhood, the distance
between each pair of shopping canters is a standard distance (400-500 m = 5
min).
Part I of the
questionnaire illustrated three identical images from Google Maps of the Taman
Universiti neighbourhood, on which each shopping centre was marked separately
(see Figure 1). This part asked each participant to, first, mark their home
location on the map and, second, draw their preferred path from home to each of
shopping centres, one by one. A total of 120 residents participated in the
survey, representing the 2,500 householders in the Taman Universiti
neighbourhood. The WIND support tool identifies the most-in-use path by
overlapping all paths drawn by respondents on a single map. Then, it measures
the walkability weight of each walkability variable. The weights show the
impact degree of each walkability variable in the respondent’s
decision-making.
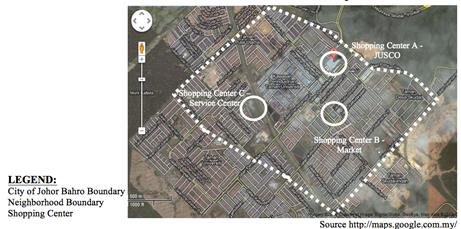
Fig. 1. Taman Universiti neighbourhood boundary
in the city of Skudai, Malaysia (the location of the three shopping
centres is marked)
The mind-mapping data
were collected via the survey and then analysed, showing that the three maps
corresponded to each destination (i.e., a shopping centre). The walkability of
the path segments was identified through different indexing grades shown with
different colour codes from Grade 1 (i.e., superior) to Grade 6 (i.e., not
certified) (see Table 3). The grades have been identified, based on the
frequency of the selection of the segment by respondents.
|
Table 3 Indexing
grades of the path walkability assessment model |
|||
|
Grade |
Colour code |
Frequency in selection |
Description and recommendations |
|
Superior |
|
>110 |
§ Well-designed and pedestrian-friendly
constructed pavement, which satisfies users; minor improvements, if any,
needed |
|
Good |
|
90-110 |
§ Constructed pavement accommodates users;
minor improvements may lead to a superior rating |
|
Fair |
|
50-90 |
§ Usable pavement on which some users do
not feel a high level of walkability; improvements, such as better facilities
and amenities, may be needed |
|
Poor |
|
20-50 |
§ Usable pavement on which many users do
not feel a high level of walkability; significant improvement, such as a lack
of facilities and amenities, probably needed |
|
Very Poor |
|
5-20 |
§ Non-usable pavement on which users do
not even feel a medium level of walkability, with low standard conditions,
should be improved |
|
Not certified |
|
0-5 |
§ No pavement or walkway |
Figure 2 illustrates the
result of the mind-mapping data analysis of path segment walkability to the
shopping centre A. As can be seen, the main path to Shopping Centre A has been
determined as the well-designed route, which has an acceptable level of safety,
security and comfort. There are some path segments that have been identified as
less well-designed path segments, while there are a few path segments that have
not even been recognized as well-designed paths.
Fig. 2. Result of the mind-mapping analysis of the path segment walkability
index for Shopping Centre A
Figure 3 shows the
result of the mind-mapping data analysis of path segment walkability in
Shopping Centre B, while Figure 4 illustrates the result of the mind-mapping
data analysis for Shopping Centre C. Similar to the data analysis result for
Shopping Centre A, the main streets have been determined as well-designed paths
towards the respective destinations.
Fig. 3.
Result of the mind-mapping analysis for the path segment walkability index for
Shopping Centre B
Fig. 4. Result of the
mind-mapping analysis for the path segment walkability index for Shopping
Centre C
5.2.
Decision-tree-making analysis
Part II of the
questionnaire was designed to capture residents’ DTM towards each of the
shopping centres. The data were collected using the combined scaling method
(CSM), as it can indicate the participants’ responses through scoring and
ranking the items (Stangor, 2007). The CSM is also able to either rank or sort
the items (Stangor, 2007) and assigns a unique number to the index components
in a ‘minimum to maximum’ range. The participants were asked to
separately sort the layers of walkability variables.
Example - F3. Comfort
for Shopping Centre A:
As an example, the DTM
data collection and analysis for the model for the feature
‘comfort’ (F3) for Shopping Centre A is presented as follows. The
feature layer (Layer 1) involves five items, where 1 is the ‘most
important’ item and 5 is the ‘least important’. The
participants were asked to separately conduct the sorting for each of the three
destinations (i.e., shopping centres). Table 4 shows the responses collected
and analysed by applying the WIND support tool’s equations. Referring to
Table 4, the first row shows the sorting range of the layer (here, Layer 1
features), which is from 1 to 5.
The second row indicates the number of times that each sorting scale was
selected. For instance, the feature was selected as the ‘most
important’ item on seven occasions, while it was selected as the
‘least important’ item on two occasions. The third row indicates
the weight value of each sorting. The ‘most important’ item has the
highest weight value (equal to 5), while the ‘least important’ item
has a value equal to 1. The fourth row multiplies the second row with the third
row, and the total sums up the values of the fourth row. The total number
should be subtracted from the minimum of the range to find out the
‘actual weight value’ of the feature within the ‘minimum to
maximum’ range. To find out the ‘actual satisfactory
percentage’, the ‘actual weight value’ should be divided by
the ‘limitation range’.
For example, when an ‘actual weight value’ of 56 is divided
by a ‘limitation range’ of 96, this equals 0.5833; therefore, the
‘actual satisfactory percentage’ is 58.33%. This DTM calculation
process has been repeated for all walkability variables.
Table 4
DTM analysis of F1:
comfort for Shopping Centre A
|
Ranking score |
|
1 |
2 |
3 |
4 |
5 |
|
Quantity |
|
7 |
2 |
9 |
4 |
2 |
|
Value |
|
5 |
4 |
3 |
2 |
1 |
|
Quantity |
|
35 |
8 |
27 |
8 |
2 |
|
Total |
|
80 |
||||
|
Actual weight value |
|
80-24=56/96=58.33 |
||||
|
Total (sum): Maximum: 24 Minimum: 24 Range (maximum-minimum): 120-24=96 Actual weight value of
‘comfort’ in the ‘range’ (total-minimum): 80-24=56 ‘Actual satisfactory percentage’ of ‘comfort’: |
||||||
Table 5 presents the walkability
weights of the subcriteria for three destinations (i.e., Shopping Centres
A, B, and C). The walkability survey shows that the subcriterion
‘driveway dropped kerbs’ was the most important variable (WINDF1.C1.S1.=25.43%)
influencing pedestrians in their route selection for Shopping Centre A.
Meanwhile, ‘street-facing entrances’ and the ‘amount of street
furniture’ were the most important variables for Shopping Centres B and
C, i.e., WINDF2.C2.S2.=24.19% and WINDF3.C1.S2.=29.74%,
respectively.
Table 5 also presents
the overall neighbourhood walkability, which is the average of walkability
weights for the three shopping centres. The WIND survey analysis determines
that walkability in the Taman Universiti neighbourhood is mainly influenced by
the existence of a pedestrian crossing (WINDF3.C1.S2.=24.25%); in
contrast, street surveillance has the least impact on the Taman Universiti
neighbourhood’s walkability (WINDF1.C3.S7=4.82%).
Table 5
Weights
of subcriteria for three shopping centres (A, B, C) and overall neighbourhood
|
Walkability
features |
Walkability
criteria |
Walkability
subcriteria |
Shopping
Centre A (%) |
Shopping
Centre B (%) |
Shopping
Centre C (%) |
Overall
neighbourhood (%) |
|
F1. Sense
of safety and security |
F1.C1. Safety facilities on pavements |
F1.C1. S1 Driveway dropped
kerbs F1.C1. S2 Existence of
pedestrian crossing F1.C1. S3 Width of utility
zones F1.C1. S4 Shelters F1.C1. S5 Length of tree
canopies F1.C1. S6 Releasing visual
obstacles/nuisances F1.C1. S7 Pavement
steepness F1.C1. S8 Existence of
bike lanes F1.C1. S9 Existence of
on-street parking F1.C1. S10 Informing
intersection blindness F1.C1. S11 Mid-block
crossing F1.C1. S12 Providing an
overbridge |
25.43 27.54 24 24 15.53 8.1 21.67 12.59 9.54 4.76 10.05 10.81 |
19.12 19.42 16.73 12.34 10.68 3.22 11.56 8.23 6.89 6.87 18.78 8.62 |
18.64 25.8 11.25 12.82 10.28 13.82 7.57 8.77 14.37 9.04 16.94 8.92 |
21.06 24.25 17.33 16.39 12.16 8.38 13.60 9.86 10.27 6.89 15.26 9.45 |
|
F1.C2. Slowing traffic
speed at pedestrian crossing |
F1.C2. S1 Existence of
pedestrian crossing F1.C2. S2 Number of
traffic lanes F1.C2. S3 Traffic signals F1.C2. S4 Traffic calming
devices F1.C2. S5 Drivers’
respect pedestrians F1.C2. S6 Slow traffic
speed |
24.96 19.07 24.36 3.7 4.76 11.78 |
8.23 14.69 15.68 4.70 5.48 12.67 |
17.66 19.39 22.16 11.42 7.90 19.47 |
16.95 17.72 20.73 6.61 6.05 14.64 |
|
|
F1.C3. Security in the day and at night |
F1.C3. S1 Pavement
lighting F1.C3. S2 Number
of intermediaries F1.C3. S3 Length
of tree canopies F1.C3. S4 Number
of street trees F1.C3. S5 Releasing visual
obstacles/nuisances F1.C3. S6 Uncrowded
route F1.C3. S7 Street
surveillance F1.C3. S8 Street-facing
entrances F1.C3. S9 Street-level
façade transparency F1.C3. S10 First-floor
use of buildings F1.C3. S11
Upper-floor windows |
19.07 13.94 9.58 11.48 8.4 20.04 6.35 22.87 11.04 9.94 8.03 |
6.97 8.55 9.49 6.48 4.6 12.06 2.97 7.87 9.45 9.49 14.73 |
12.64 10.93 14.57 19.95 5.57 18.94 5.14 14.78 20.21 18.97 6.45 |
12.89 11.14 11.21 12.64 6.19 17.01 4.82 15.17 13.57 12.80 9.74 |
|
|
F2. Connectivity |
F2.C1. Pavement accessibility |
F2.C1. S1 Pavement networking F2.C1. S2 Length
of pavements F2.C1. S3 Width
of walking zones F2.C1. S4 Continuity
of diverse activity F2.C1. S5 Length
of segments F2.C1. S6 Informing
intersection blindness F2.C1. S7 Street
signage |
22.92 22.5 21.9 9.63 11.36 25.67 8.44 |
16.48 15.03 17.18 12.39 10.96 8.26 7.93 |
18.96 24.64 27.49 21.35 16.04 15.50 11.03 |
19.45 20.72 22.19 14.46 12.79 16.48 9.13 |
|
F2.C2. Physical connectivity |
F2.C2. S1 Pavement
steepness F2.C2. S2 Street-facing
entrances F2.C2. S3 Street signage F2.C2. S4 Length
of segment |
19.85 21.66 7.44 21.40 |
20.7 24.19 9.90 22.89 |
13.05 21.93 20.13 18.90 |
17.87 22.59 12.49 21.06 |
|
|
F3. Comfort |
F3.C1. Physical comfort |
F3.C1. S1 Good location of service utilities F3.C1. S2 Amount
of street furniture F3.C1. S3 Pavement
lighting F3.C1. S4 Number
of intermediaries F3.C1. S5 Shelters F3.C1. S6 Planting
deciduous trees F3.C1. S7 Existence and
width of medians F3.C1. S8 Existence of
on-street parking F3.C1. S9 Human ergonomic
scale design |
21.37 16.55 15.80 9.63 10.38 26.67 8.48 7.82 18.65 |
17.47 15.90 12.92 10.21 10.65 15.12 8.09 10.08 9.45 |
25.88 29.75 14.67 14.67 11.66 14.94 19.68 13.80 8.62 |
21.57 20.73 14.46 11.50 10.90 18.91 12.08 10.57 12.24 |
|
F3.C2. Environmental comfort |
F3.C2. S1 Width of walking
zones F3.C2. S2 Types of
pavement surface F3.C2. S3 Number of street
trees F3.C2. S4 Pavement
steepness F3.C2. S5 Windy climate F3.C2. S6 Uncrowded route F3.C2. S7 Height and types
of fences F3.C2. S8 Street
reserve |
24.29 21.37 9.02 4.03 10.58 19.07 24.36 5.47 |
13.52 21.27 14.06 9.03 2.43 21.35 16.04 19.04 |
16.84 13.39 10.96 8.96 4.37 13.54 11.68 9.07 |
18.22 18.68 11.35 7.34 5.79 17.99 17.36 11.19 |
|
|
F4. Convenience |
F4.C1. Functionality of diverse activities |
F4.C1. S1 Number of
traffic lanes F4.C1. S2 Existence and
width of medians F4.C1. S3 Length of
segment F4.C1. S4 Width of traffic
zones F4.C1. S5 Width
of buildings |
6.80 2.07 1.08 11.57 9.03 |
5.41 13.09 3.89 10.39 16.68 |
13.36 25.09 11.31 4.43 7.05 |
8.52 13.42 5.43 8.80 10.92 |
|
F4.C2. Easy access without obstacles |
F4.C2. S1 Releasing visual
obstacles/nuisances F4.C2. S2 Traffic signals F4.C2. S3 Pavement
steepness F4.C2. S4 Uncrowded route, F4.C2. S5 Existence of
on-street parking F4.C2. S6 Mid-block
crossing F4.C2. S7 Height and types
of fences F4.C2. S8 Public parking
next to street F4.C2. S9 Slow
traffic speed |
6.77 6.98 4.38 5.13 3.41 4.01 2.74 20.15 11.50 |
9.36 6.53 7.73 8.83 5.44 4.35 4.36 6.63 1.37 |
13.60 13.84 10.50 10.74 6.65 14.08 13.36 7.53 15.29 |
9.91 9.12 7.54 8.23 5.17 7.48 6.82 11.44 9.39 |
|
|
F5. Attractiveness
and aesthetics |
F5.C1. Street enclosure |
F5.C1. S1
Width of kerb-to-kerb roadway F5.C1. S2 Width
of utility zones F5.C1. S3 Building
setbacks F5.C1. S4 Width
of buffer zone F5.C1. S5 Street
reserve F5.C1. S6 Diversity
of buildings F5.C1. S7 Mixed
functionality of adjacent buildings F5.C1. S8 Enclosure
ratio |
21.49 20.15 11.57 9.03 6.94 4.63 15.68 22.94 |
4.29 4.13 4.30 6.63 6.63 11.37 6.35 13.84 |
3.82 4.13 3.2 7.12 7.53 15.29 14.78 11.40 |
9.87 9.47 6.36 7.59 7.03 10.43 12.27 16.06 |
|
F5.C2. Vibrancy and vitality |
F5.C2. S1 Planting diversity F5.C2. S2 Pavement
lighting F5.C2. S3 Width of
landscaping strips F5.C2. S4 Types of
pavement surface F5.C2. S5 Intangible
senses F5.C2. S6 Planting
deciduous trees F5.C2. S7 Length of tree
canopies F5.C2. S8 Number of street
trees F5.C2. S9 Building a vital
atmosphere on pavements F5.C2. S10 Street interface F5.C2. S11 Height of
buildings F5.C2. S12 Upper-floor
windows F5.C2. S13 Skyline
height |
22.10 25.26 15.79 20.8 6.55 11.48 8.4 20.04 22.87 11.99 15.79 8.02 11.76 |
12.29 13.29 9.56 8.39 6.43 12.67 16.95 15.57 8.77 18.78 12.67 22.10 20.83 |
6.65 2.72 4.03 4.43 7.05 9.57 8.77 14.85 10.94 13.98 13.30 6.83 11.03 |
13.68 13.76 9.79 11.21 6.68 11.24 11.37 16.82 14.19 14.92 13.92 12.32 14.54 |
6. RESULTS
The WIND support tool has analysed
the overall neighbourhood walkability by overlapping the mind-mapping results
of three shopping centres. This output of the model is presented in a map
called ‘Walkability_DTM_Mind-mapping sheet’. The mode has developed
six grades (from superior grade to not certified) based on path walkability
mind-mapping analysis scores (see Table 5). Referring to Figure 5, the sheet
illustrates that the path segments near to Shopping Centre A have superior
(i.e., Grade A) and good (i.e., Grade B) walkability conditions, while the path
segments near to Shopping Centres B and C are mostly in fair to very poor
conditions of walkability provision. In fact, Table 5 should help urban and
transportation professionals as a design decision support tool to promote a
neighbourhood’s development as a walkable and pedestrian-friendly
environment. Furthermore, this indexing tool can enable professionals and
practitioners to come up with effective design and planning solutions, which
encourage people to walk more and choose walking rather than other modes of
travel.
Fig. 5. The path walkability
assessment model output for the overall neighbourhood
The model has applied
Equation 3 to indicate the overall walkability score of the neighbourhood. The
overall walkability score is folded into six clusters as follows:
![]()
A) if 26.8-27.5: the neighbourhood makes a
‘superior’ contribution to its walkability
B) if 26.1-26.7: the neighbourhood makes a
‘good’ contribution to its walkability
![]() C) if 25.4-26.0: the neighbourhood makes a
‘fair’ contribution to its walkability
C) if 25.4-26.0: the neighbourhood makes a
‘fair’ contribution to its walkability
D) if 24.7-25.3: the neighbourhood makes a
‘poor’ contribution to its walkability
E) if 24.1-24.6: the neighbourhood makes a ‘very
poor’ contribution to its walkability
F) if ≤ 24.0: not certified
The WIND tool resulted in an
overall walkability score for the Taman Universiti neighbourhood of 25.22
(i.e., 1,170.6/46.4=25.22). Refereeing to the overall walkability score
clustering, the Taman Universiti neighbourhood can be placed in Cluster C,
i.e., fair, which means it has a well-designed and pedestrian-friendly
environment, but some improvement needed to satisfy it residents.
7.
DISCUSSION
There is rapidly growing interest in the study of
walkability, which integrates the expertise of several disciplines, including
urban design, urban planning, urban geography, transportation planning,
architecture and landscape architecture, and public health. But, pedestrian
behaviour is a complex and controversial issue in walkability assessment
studies. Capturing and forecasting pedestrians’ sequential
decision-making while walking needs DTM-based assessment tools. On the other
hand, a group of professionals in urban design and other related disciplines is
following general and identical series of guidelines, codes and standards in
sustainable neighbourhood development (Bereitschaft, 2017; Blecic et al.,
2017). In fact, the decision made by this group of professionals is being
similarly applied in different neighbourhoods with different environmental,
economic, demographic and cultural characteristics. However, each neighbourhood
has its own characteristics and, thus, needs its own adapted development plan.
According to Park (2008), Coa et al. (2006) and Boarnet et al., (2005), changing
urban forms cannot change people’s behaviour, but changing urban areas
based on people’s attitudes, perceptions and self-selection could
ameliorate their behaviour in both travel and walking, which is the duty of
urban designers and urban planners. Hence, this research has developed WIND,
which is a decision support tool for this purpose. This tool evaluates the
neighbourhood’s physical and environmental qualities influencing
residents’ walking behaviour in their DTM for route selection. The WIND
support tool has a comprehensive list of walkability variables. Using this
comprehensive list of 92 variables provides urban and transportation
professionals with more accurate assessments and evaluations of
neighbourhoods’ walkability. Juxtaposing the model’s outputs also
helps urban designers to make future decisions about path development through
implying much more adaptability between local neighbourhood environment
characteristics and residents’ needs, preferences and perceptions. This
is because the variables of the walkability assessment model should be
compatible with the urban context and texture in order to accommodate
environmental settings and residents’ self-selection attitudes, as well
as guarantee the legacy of existing urban infrastructure. This model is more
applicable for tropical regions while it can also be applied in other areas.
This research highlights that capturing
pedestrians’ DTM patterns when walking to three shopping centres in a
neighbourhood provides the following advantages:
§ First, the final path walkability DTM
pattern of the neighbourhood completely matches the overall preferences and
attitudes of the residents. The final pattern essentially guides urban
designers and urban planners in their future corrective actions to enhance walkability
and also upgrade walkability facilities within the surveyed neighbourhood.
Significantly, this advantage allows urban designers and urban planners to
provide a unique design that is oriented towards the pedestrian context for
that neighbourhood. This advantage also helps them to rectify the problems by
simply implementing ‘general’ pedestrian-oriented design guidelines
and standards, which do not adequately consider end users and their attitudes
and perceptions.
§ Second, the research specifically rectifies
the problems with individuals’ self-selection behaviour. The research
extracted the strengths and weaknesses for each of the three shopping centres
in terms of quality of service to customers. This strikes a balance between the
strengths and weaknesses of the shopping centres, while facilitating dipolar
shopping land use within the neighbourhood. Thus, the final result of the
research provides a balanced and equal chance for each shopping centre to be
selected as a walking destination. On a micro-scale, it can considerably solve
the self-selection problem of the neighbourhood. Moreover, this phenomenon
helps residents to more easily decide on their residential location based on a
shopping centre, which is one of the most effective factors in residents’
self-selection (Handy et al., 2002).
§ Third, the research supports urban
designers and planners in managing their resources and budget more wisely.
According to Boarnet (2005), upgrading and enhancing urban forms is costly,
while improving the urban infrastructure is considerably less costly. In this
regard, this research provides a highly reliable guide for urban designers and
planners regarding accurate investment in redevelopment, reshaping or
performing corrective actions in the surveyed neighbourhood. Urban developers
can follow the final output of this walkability framework to achieve higher
performance in enhancing walkability and walking facilities within the targeted
neighbourhood, as well as better manage their resources and budget.
§ Fourth, the research claims that focusing
on psychological and sociological factors associated with residents’
attitude and perception will lead to huge benefits by improving quality of
life, well-being and health (United Nations Development Programme, 2012).
Currently, there is a debate among
urban designers, planners and politicians about how sustainability and energy
efficiency should be integrated with urban development. According to Hayashi et
al. (1998), walking-related issues are a major concern for all countries around
the world. In this case, only a few countries in the world have come up with
green neighbourhood rating systems, including the US and Malaysia;
a) Leadership in Energy and Environmental
Design for Neighbourhood Development (LEED-ND): LEED-ND is a ranking tool
integrating urban development and building design from a sustainability
perspective (USGBC, 2008). LEED-ND assesses neighbourhoods based on the
following criteria: ‘smart linkage and location’,
‘neighbourhood pattern and design’, ‘green infrastructure and
buildings’, ‘innovation and design process’, and
‘regional priority’, ‘reducing vehicle miles travelled’
and ‘accessibility to jobs and services by foot or public transit’
(USGBC, 2008).
b) Green Neighbourhood
Index (GNI): The GNI is being developed by Malaysia federal and city planning
officials in the Housing Ministry and local government. It provides basic
instructions for programming at state and local levels in order to compile and
formulate policies and strategies and promote the development of a
neighbourhood into a ‘green neighbourhood’. The GNI is still at the
drafting stage.
8. CONCLUSION
The research has developed the WIND
support tool, which incorporates new urbanism, smart growth, and sustainability
principles and strategies. The model has a middle-out approach to enhance urban
walkability. It considers both top-down and bottom-up approaches to boost urban
walkability by encouraging the participation of both government and private
stakeholders in walkable urban growth and development. Hence, the proposed
model is seen as an urban design decision support tool, which can be useful for
urban designers and urban/transportation planners in deciding on future
development/redevelopment and corrective actions.
The model
has two outputs: i) a walkability index score for each path (including segments
and streets) (as the micro-scale); ii) a walkability score index for the
overall neighbourhood area (as the macro-scale). The output of the model is
presented on a map called the ‘Walkability_DTM-Mind-mapping sheet’.
The following sections present the output results of the most-in-use
walkability assessment model for diverse applications: ‘path walkability
index of destinations’ and ‘path walkability index of overall
neighbourhood’.
This decision support tool provides a
scored index to benchmark the walkability of urban neighbourhoods in cities,
which should help all stakeholders in prioritizing their investments for any
future development/redevelopment and corrective actions. Indeed, the proposed urban
walkability assessment model will encourage greater correspondence between the
characteristics of local neighbourhood environments and their residents’
needs, preferences and perceptions. In this context, the research will enhance
the quality of the built environment and its connectivity, safety and security.
By evaluating options for the accessibility of infrastructure in relationship
to the available modes of travel infrastructure, the study will help determine
how network connectivity and social accessibility can be achieved through
low-energy and liveable urban development implementations.
The findings of the model can be used by various
stakeholders, including policymakers, local authorities, urban design and
planning professionals, and transportation planning professionals, consultants
and practitioners. Indeed, the tool offers the potential to be applied
globally. Moreover, tourists and
tourist planners can make use of the output of this model, such as via a
smartphone app. Hence, further study could focus on:
- descriptive
study on the walkability index as smartphone app
- formulating the
walkability index as a smartphone app
-
developing a framework to assess the correlation of
neighbourhood walkability via a smartphone app
Acknowledgements
The authors would like to thank the
Malaysian Ministry of Science, Technology and Innovation (MOSTI) for Grant no. R.J130000.7922.4S123.
References
1.
Babiano
I.M. 2003. Sustainable + Mobility +
Management: Pedestrian Space Management as a Strategy in Achieving Sustainable
Mobility, Sustainability marketing Management and Consumption. University
of St Gallen Summer Academy.
2.
Badland
H., G. Schofield G. 2005. “Transport, urban design, and physical
activity: an evidence based update”. Transportation Research Part D: Transport and Environment 10(3): 177-96.
3.
Bejleri
I., R.L.Steiner, A. Fischman, J.M. Schmucker. 2011. “Using GIS to analyze
the role of barriers and facilitators to walking in children‘s travel to
school”. Urban Design International 16(1): 51-62.
4.
Bereitschaft B. 2017.
“Equity in microscale urban design and walkability: a photographic survey
of six Pittsburgh streetscapes”. Sustainability 9(7): 1233.
5.
Blecic I., D. Canu, A.
Cecchini, T. Congiu, G. Fancello. 2017. “Walkability and street
intersections in rural-urban fringes: a decision aiding evaluation
procedure”. Sustainability 9(6): 883.
6.
Boarnet M.G. 2003. The Built Environment and Physical Activity:
Empirical Methods and Data Resource. University
of California Transportation Center.
7.
Boarnet
M.G., R. Crane. 2001. “The influence of land use on travel behavior:
Specification and estimation strategies”. Transportation Research A 35.
8.
Boarnet M.G., C.L.
Anderson, K. Day, T. McMillan, M. Alfonzo. 2005. “Evaluation of the
California Safe Routes to School legislation: urban form changes and
children’s active transportation to school”. American Journal of Preventive Medicine 28(2): 134-140.
9.
Boarnet
M., C. Anderson, K. Day, T. Mcillan, M. Alfonzo. 2005. “Evaluation of the
California Safe Routes to School Legislation: urban form changes and
children’s active transportation to school”. American Journal of Preventive Medicine 28.
10.
Boarnet
M., K. Day, M. Alfonzo, A. Forsyth, M. Oakes. 2006. “The Irvine-Minnesota
inventory to measure built environments: reliability tests”. American
Journal of Preventive Medicine 30(2).
11.
Bradshaw
C. 1993. “Creating and using a rating system for neighborhood
walkability: Towards an agenda for local heroes”. In 14th International Pedestrian Conference. Boulder, CO.
12.
Brown
B.B., C.M. Werner, J.W. Amburgey, C. Szalay. 2007. “Walkable route
perceptions and physical features: converging evidence for en route walking
experiences”. Environment and
Behavior 39(1): 34-61.
13.
Calthorpe
P., S. Poticha. 1993. The Next American
Metropolis, Ecology, Communities, and the America Dream. New York, NY:
Princeton Architectural Press.
14.
Cerin
E., K. Chan, D.J. Macfarlane, J. Duncan, K. Lee, P. Lai. 2011. “Objective
assessment of walking environments in ultra-dense cities: development and
reliability of the Environment in Asia Scan Tool-Hong Kong Version (EAST-HK). Health and Place 17: 937-945.
15.
Cervero
R. 2002. “Built environments and mode choice: toward a normative
framework”. Transportation Research
Part D 7: 265-284.
16.
Clifton K., A. Livi,, D.A. Rodriguez. 2005. “Pedestrian Environment
Data Scan (PEDS) Tool”. Planning 80: 95-110.
17.
Clifton
K.J., S.L. Livi, D. Andrea, D. Rodriguez. 2007. “The development and
testing of an audit for the pedestrian environment”. Journal of Landscape and Urban Planning 80(1-2): 95-110.
18.
Crane
R., R. Crepeau. 1998. “Does neigbourhood design influence travel? Behavioral analysis of travel diary and
GIS data”. UCTC Working Paper No.
374. University of California Transportation Center.
19.
Dannenberg
A. 2004. “Assessing the walkability of the workplace: a new audit”.
In Fourth National Congress of Pedestrian
Advocates, America Walks.
20.
Dixon
L. 1996. “Bicycle and pedestrian level of service performance measures
and standards for congestion management systems”. Transportation Research Record 1538: 1-9.
21.
Duncan M.J., J.C. Spence,
W.K. Mummery. 2005. “Perceived environment and physical activity: a
meta-analysis of selected environmental characteristics”. International
Journal of Behavioral Nutrition and Physical Activity 2(11).
22.
Emery J., C. Crump, P.
Bors. 2003. “Reliability and validity of two instruments designed to
assess the walking and bicycling suitability of sidewalks and roads”. American Journal of Health Promotion 18(1): 38-46.
23.
Ewing R. 2005. “Can
the physical environment determine physical activity levels? Exercise and Sport Sciences Reviews 33(2): 69-75.
24.
Ewing
R., S. Handy, R.C. Brownson, O. Clemente, E. Winston. 2006. “Identifying
and measuring urban design qualities related to walkability”. Journal
of Physical Activity and Health 3(Suppl 1): 223-240.
25.
Ewing R., T. Schmid, R.
Killingsworth, A. Zlot, S. Raudenbush. 2008. “Relationship between urban
sprawl and physical activity, obesity, and morbidity”. Urban Ecology:
567-582. Springer.
26.
Forsyth A. 2015.
“What is a walkable place? The walkability debate in urban design”.
Urban
Design International 20(4): 274-292.
27.
Forsyth
A., K.J. Krizek, A.W. Agrawal. 2010. Measuring
Walking and Cycling Using the Pabs (Pedestrian and Bicycling Survey) Approach:
A Low-cost Survey Method for Local Communities. Mineta Transportation Institute
College of Business, MTI Report 10-03.
28.
Forsyth
A., J.M. Oakes, K.H. Schmitz. 2009. “Test-retest reliability of the Twin
Cities Walking Survey”. Journal of
Physical Activity and Health 6: 119-131.
29.
Frank
L.D., G. Pivo. 1994. “Impacts of mixed use and density on utilization of
three modes of travel: single-occupant vehicle, transit, and walking”. Transportation Research Record 1466:
44-52.
30. Frank L.D., J. Sallis, R. Saelens, L.
Leary, K. Cain, T.L. Conway, P.M. Hess. 2011. “Application
to the Neighborhood Quality of Life Study”. Journal of Sports and Medicine 44(13): 924-933.
31.
Gallin
N. 2001. “Quantifying pedestrian friendliness-guidelines for assessing
pedestrian level of service”. Journal
Road and Transport Research10 (1).
32.
Giles-Corti
B., M. Knuiman, A. Timperio, K.V. Niel, T. Pikora, F. Bull, T. Shilton,
M. Bulsara. 2008. “Evaluation of the implementation of a state
government community design policy aimed at increasing local walking: design
issues and baseline results from RESIDE, Perth Western Australia”. Preventive Medicine 46(1): 46-54.
33.
Gindroz R., K. Levine, 2002. The Urban Design Handbook: Techniques
and Working Methods. WW Norton & Company.
34.
Gota S., H.G. Fabian, A.A. Mejia, S.
Sabine Punte. 2010. Walkability in Asian
Cities: Issues and Challenges. Asian Development Bank Report. Fredkorpset,
and the Shakti Foundation.
35.
Guttenplan
M., B.W. Landis, L. Crider, D.S. McLeod. 2001. “Multi-modal level of
service Analysis at planning level”. Transportation
Research Record: Journal of the Transportation Research Board 1776: 151-158.
36.
Handy
S.L. 1996. “Urban form and pedestrian choices: study of Austin
neighborhoods”. Transportation Research Record. Transportation
Research Board: 135-144.
37. Handy L.S., M.G. Boarnet, R. Ewing, R.E.
Killingsworth. 2002. “How the built environment affects physical
activity. Views from urban planning”. American Journal of
Preventive Medicine 23(2S): 64-73.
38.
Handy S.L., K. Clifton.
2000. Evaluating Neighborhood Accessibility: Issues and Methods Using
Geographic Information Systems. No. SWUTC/00/167202-1. Southwest Region
University Transportation Center, Center for Transportation Research,
University of Texas.
39.
Handy S., X. Cao, P. Mokhtarian. 2005. “Correlation or causality
between the built environment and travel behavior? Evidence from Northern
California”. Transportation
Research Part D: Transport and Environment 10(6): 427-444.
40. Harkey D.L., Ch. Zegeer. 2004. PEDSAFE: Pedestrian Safety Guide and
Countermeasure Selection System. Report of Grant no. DTFH61-99-X-00003.
University of North Carolina, Highway Safety Research Center.
41.
Hoehner
C.M., A. Ivy, L.K. Brennan Ramirez, S.L. Handy, R.C. Brownson. 2007. “The
Active Neighborhood Checklist: A reliable and user-friendly tool for assessing
activity-friendliness”. American
Journal of Health Promotion 21(6): 534-537.
42.
Humpel
N., N. Owen, E. Leslie, A.L. Marshall, A.E. Bauman, J.F. Sallis. 2004.
“Associations of location and perceived environmental attributes with
walking in neighborhoods”. American Journal of Health Promotion
18: 239-242.
43.
International Energy Agency (IEA). 2012. A Policy Strategy for Carbon Capture and
Storage. Available at http://www.iea.org/publications/freepublications/publication/a-policy-strategy-for-carbon-capture-and-storage.html.
44.
Jacobs K. 2006.
“Discourse analysis and its utility for urban policy research”. Urban Policy and Research 24(1): 39-52.
45.
Krizek
K. 2006. “Lifestyles, residential location decisions, and pedestrian and
transit activity”. Transportation
Research Record: Journal of Transportation Research Board 1981: 171-178.
46.
Landis
B.W. et.al. 2001. “Modeling the roadside walking environment: a pedestrian
level of service”. Transportation
Research Board 01-0511.
47.
Lee
J.S., K. Kawakubo, S. Kohri, H. Tsujii, K. Mori. A. Akabayashi. 2007.
“Association between residents’ perception of the
neighborhood’s environments and walking time in objectively different
regions”. Environmental Health and Preventive Medicine 12(1):
3-10.
48.
Litman T.A. 2014. Economic Value of Walkability. Victoria Transport Policy Institute.
Available at: http://www.vtpi.org.
49.
Lynch
K., G. Gary Hack. 1984. Site Planning.
Cambridge, MA: Maple-Vail Inc.
50.
Maslow
A.H. 1954. Motivation and Personality.
New York, NY: Harper and Row.
51.
Matan A., P. Newman, R.
Trubka, C. Beattie, L.A. Selvey. 2015. “Health, transport and urban
planning: quantifying the links between urban assessment models and human
health”. Urban Policy and Research:
1-15.
52.
Max-Neef M., A. Elizalde, M. Hopenhayn. 1992. “Development and
human needs”. Real-life Economics: Understanding Wealth Creation: 197-213.
53.
Michael
Yvonne L., E.M. Keast, H. Chaudhury, K. Day, A. Mahmood, A.F.I Sarte. 2009.
“Revising the senior walking environmental assessment tool”. Preventive Medicine 48: 247-249.
55.
Millington
C., C. Ward Thompson, D. Rowe, P. Aspinall, C. Fitzsimons, N. Nelson, N. Mutrie.
2009. “Development of the Scottish Walkability Assessment Tool
(SWAT)”. Health and Place 15(2):
474-481.
56.
Mokhtarian
P.L., I. Salmon. 2002. “How derived is the demand for travel? Some
conceptual and measurement considerations”. Transportation Research Part A 33.
57.
Moudon
A.V., P. Hess, J.M. Matlick, N. Pergakes. 2002. “Pedestrian location
identification tools: identifying suburban areas with potentially high latent
demand for pedestrian travel”. Transportation Research Record
1818: 94-101.
58.
Moudon
A.V., C. Lee, A. Cheadle, C. Garvin, D. Jonson, T. Schmid, R. Weathers, L. Lin.
2006. “Operational definitions of walkable neighborhood: theoretical and
empirical insights”. Journal of Physical Activity and Health 3(1):
99-117.
59.
“National
Centre for Chronic Disease Prevention and Health Promotion (CDC)”. 2009.
Available at: http://www.cdc.gov/chronicdisease/about/foa.htm.
60.
“New
Zealand Transport Agency”. 2009. Available at: http://www.nzta.govt.nz/resources/planning-policy-manual/index.html.
61.
Painter
K. 1996. “The influence of street lighting improvements on crime, fear
and pedestrian street use after dark. Landscape
and Urban Planning 35: 193-201.
62.
Pikora
T., B. Giles-Corti, F.C. Bull, K. Jamrozik, R. Donovan. 2003. “Developing
a framework for assessment of the environmental determinants of walking and
cycling”. Social Science and
Medicine 56: 1693-1703.
63.
National
Cancer Institute. National Institutes of Health. U.S Department of Health and
Human Services.
64.
Rodriguez
D., J. Joo. 2004. “The relationship between non-motorized mode choice and
the local physical environment”. Transportation
Research Part D: Transport and Environment 9(2): 151-173.
65.
Saelens
B.E., J.F. Sallis, J.B. Black, D. Chen. 2003. “Neighborhood-based
differences in physical activity: an environment scale evaluation”. American Journal of Public Health 93(9):
1552-1558.
66.
Sallis
J.F., K. Kraft, L.S. Linton. 2002. “How the environment shapes physical
activity: a transdisciplinary research agenda”. Preventive Medicine
22: 208-211.
67.
Shafray E., S. Kim. 2017.
“A study of walkable spaces with natural elements for urban regeneration:
a focus on cases in Seoul, South Korea”. Sustainability 9(4): 587.
68.
Shriver
K. 2003. “A walkable places survey: approach and results”. The Annual Meeting of the Transportation
Research Board. Washington, DC.
69.
“Smart
Growth America”. Available at: http://www.smartgrowthamerica.org.
70.
Southworth
M. 2005. “Designing the walkable city”. Journal of Urban Planning and Development 131(4): 246-257.
71.
Southworth M., E. Ben-Joseph. 2004.
“Reconsidering the cul-de-sac”. ACCESS Magazine 1(24): 28-33.
72.
Stangor
Ch. 2007. Research Methods for the
Behavioral Sciences. Houghton Mifflin Company, University of Maryland.
73.
Titze
S., B. Giles-Corti, M.W. Knuiman, T.J. Pikora, A. Timperio, F.C. Bull, K. Van
Niel. 2010. “Associations between intrapersonal and neighborhood
environmental characteristics and cycling for transport and recreation in
adults: baseline results from the RESIDE study”. Journal of Physical Activity and Health 7(4): 423-431.
74.
Tiwari R. 2015.
“Designing a safe walkable city”. Urban Design International 20(1):
12-27.
75.
United States Energy Information
Administration (U.S. EIA). 2013. “International Energy outlook 2013:
natural gas. EIA, July 2013”. Available at http://www.eia.gov/forecasts/ieo/nat_gas.cfm.
76.
Zegeer
Ch.V., D.L. Carter, W.W. Hunter, J.R. Stewart, H. Huang, A.H. Do, L.S. Sandt.
2006. “Index for assessing pedestrian safety at intersections”. Transportation
Research Record: Transportation Research Board 982: 76-83.
77.
Zhang, Y., Y. Li, Q. Liu, C. Li. 2014. “The built environment and walking activity of
the elderly: an empirical analysis in the Zhongshan metropolitan area,
China”. Sustainability 6(2): 1076-1092.
78.
Mickevicius T., S.
Slavinskas, S. Wierzbicki, K. Duda. 2014. “The effect of diesel-biodiesel
blends on the performance and exhaust emissions of a direct injection off-road
diesel engine”. Transport
29(4): 440-448.
79.
Puškár M., M.
Fabian, T. Tomko. 2018. “Application of multidimensional statistical
model for evaluation of measured data obtained from testing of the HCCI engine
prototype”. Diagnostyka 19(1):
19-24. DOI: http://dx.doi.org/10.29354/diag/78349.
80.
Jacyna M., K. Lewczuk, E. Szczepanski, P. Golebiowski, R.
Jachimowski, M. Klodawski, D. Pyza, O. Sivets, M. Wasiak, J. Zak, I. Jacyna-Gołda.
2015. “Effectiveness of national transport
system according to costs of emission of pollutants”. In
Nowakowski T., Mlynczak M., Jodejko-Pietruczuk A, Werbinska-Wojciechowska S.
(eds.) Safety
and Reliability: Methodology and Applications: Proceedings of the European Safety and
Reliability Conference (ESREL): 559-567. Wroclaw, Poland. 14-18 September
2014. Boca Raton, FL: CRC Press-Taylor & Francis Group. ISBN:
978-1-315-73697-6, 978-1-138-02681-0.
Received 17.03.2018; accepted in revised form 27.08.2018
![]()
Scientific
Journal of Silesian University of Technology. Series Transport is licensed
under a Creative Commons Attribution 4.0 International License