Article citation information:
�ochowska, R., Socz�wka, P. Method for identifying hazardous
road locations at the intersection of tramlines and road traffic. Scientific Journal of Silesian University of
Technology. Series Transport. 2017, 97, 201-213. ISSN:
0209-3324.
DOI: https://doi.org/10.20858/sjsutst.2017.97.18.
Renata �OCHOWSKA[1],
Piotr SOCZ�WKA[2]
METHOD
FOR IDENTIFYING HAZARDOUS ROAD LOCATIONS AT THE INTERSECTION OF TRAMLINES AND
ROAD TRAFFIC
Summary.
Passenger transport safety is an important issue. This paper presents a method
for the identification of locations at the intersection of tramlines and road
traffic, which are characterized by a high level of risk. Furthermore,
different aspects of risk have been determined in order to analyse the problem
in a complex way. For each aspect of risk, a measure was developed to estimate
the level of risk. The application of the proposed method has been presented on
the basis of an analysis of documentation of traffic incidents on the tram
network. Accordingly, hazardous road locations have been identified.
Keywords:
traffic engineering; traffic safety; hazardous road location
1. INTRODUCTION
The level of road traffic safety in
Polish cities is still not satisfactory. The level of risk may be characterized
in many different ways (e.g., [4,5,12]). The numbers of traffic accidents and
the numbers of casualties are most commonly used. Although both these measures
are decreasing [16], they are still too high in Poland in comparison to other
European countries. The value of the traffic fatalities index per 100,000
inhabitants is more than two times higher in Poland than in Great Britain and
significantly higher than in Germany or France [8]. That means that the risk of
being involved in a traffic accident[3]
in Poland is too high and should be reduced.
In the literature associated with traffic
safety, there are many different approaches to defining a location that is
especially dangerous for users of the transport system. For example, in [14],
a hazardous road location is defined as a �location on the road network in
which there is a significant concentration of all - or only particular,
types of traffic accidents or effects of these accidents�. However, in [9] and
[11], a hazardous road location (also called an �accident prone location� or a
�crash hotspot�) is any location in which there is a higher than expected number
of traffic incidents than in other similar locations, as a result of local risk factors.
The claim that the number of traffic
incidents in hazardous road locations is connected with local risk factors
seems to be of great significance. Therefore, those incidents that have
occurred due to inappropriate features of the location should be of critical
importance in the process of identifying accident-prone locations than those
incidents caused by reckless or inappropriate ways of driving.
Based on that assumption, one may
surmise that the environmental features of a location, resulting from
insufficient visibility or non-typical design, should play a key role in
modelling road traffic safety. On account of this hypothesis, by using
engineering methods, one can influence the number of traffic incidents in
analysed locations [9]. In addition, in [14], a claim is made that the
influence of the environment of locations is often ignored. Most road traffic
incidents occur because of human (i.e., drivers or pedestrians) error, but
defects of the location have a big influence on the possibility of such
mistakes being made.
Many methods have been developed in order
to identify hazardous road locations. In [9] and [18], the most common hotspot
identification methods are described. Usually, these methods are associated
with the frequency of occurrence of road traffic accidents or with different
safety measures. The analysis of the frequency of occurrence is also mentioned
in [7] and [11] as one of the easiest methods of determining the risk in
particular locations. Other, albeit simpler methods, may be associated with the
total number of accidents or the costs of property damage [9].
In [14], different approaches for
determining the limit values of safety measures have been described. Those
approaches include:
-
Determining the limit value arbitrarily
-
Accepting a value that is significantly higher than the average value
-
Accepting a value of a chosen high quantile
Most methods are developed for road
traffic, whereas the safety of tram traffic is often overlooked. This is very
alarming because the safety of any operation in a passenger transport system
should be the primary standard of its functioning [2]. Traffic incidents
involving trams should be treated with great attention, due to the specificity
of tram traffic. First of all, a tram is a means of public transport that
usually carries more than 50 passengers, all of whom are exposed to danger.
Moreover, an incident on the tram network usually affects vehicles that do not
take part in the incident itself. One of the most important demands that is
addressed in the context of public transport is the certainty of arriving at
the destination [13] - an incident on the tram network may make that demand
impossible to fulfil.
It is also of great importance to
perform an analysis of traffic safety in a complex way, as only such an
analysis can lead to a significant improvement in the level of safety [3].
Taking the above into consideration,
the main purpose of this paper is to develop a method of identification of
hazardous road locations at the intersection of road traffic and tramlines,
which considers different aspects of risk.
2. DESCRIPTION OF THE PROPOSED METHOD
In different papers, there are
various definitions of a hazardous road location. Furthermore, some authors
almost treat the terms �hazardous road location� and �blackspot� as synonyms [6,9],
whereas others distinguish them [14]. Therefore, there is a need to formulate
a definition of a hazardous road location, which can be used in further
analysis.
An assumption was made that a
hazardous road location at the intersection of tramlines and road traffic should
be particularly da ngerous,
and that different aspects of risk should be taken into consideration. The
three most important aspects of risk that were chosen are shown in Fig. 1.
Fig. 1. Aspects of risk
included in the proposed method; source: own research
Based on those factors, a definition
of a hazardous road location was formulated. According to this definition, a
hazardous road location is a location on a transport network in which limit
values of measures connected with severity, homogeneity and the number of
traffic incidents are exceeded. Therefore, there is a need to develop a
complex method for identifying hazardous road locations at the intersection of
tramlines and road traffic, which will include all identified aspects of risk
[1,17].
2.1. Characteristics
of the chosen risk factors
The severity of incidents is
usually represented by the number of casualties (people injured or killed as a
result of an accident). There are about 3,000 people killed and about 40,000
injured in accidents on Polish roads every year [10]. As Polish law states, a
person killed in an accident is a person who died at the scene of an accident
or within 30 days of the accident in a hospital [10]. Despite being a tragedy
for the family and source of great pain for them, the death of a person in an
accident also causes financial loss, on account of all the administrative and
medical costs involved, such as the arrival of emergency services or any court
proceedings [10]. The cost of one fatality is therefore assessed at about PLN 2
million (PLN 2,052,518in 2015) [10]. If a person was seriously injured, the
cost may be even higher (about PLN 2,323,299in 2015) [10]. Taking all the
relevant factors into consideration, the severity of traffic incidents is one
aspect that must not be ignored.
The second aspect of risk is the
homogeneity of traffic incidents. This is defined as the occurrence of the same
types of incidents. If incidents of the same type happen regularly in a
particular location, then this location should be considered as being more
hazardous than locations with the same number of incidents, but of different
types. Such an assumption was made because the repetitiveness
of the same types of collisions or accidents may indicate a serious problem
with infrastructure, traffic organization or other local faults. If incidents
that occur in a particular location are of different types, then one may assume
that those incidents occurred randomly and are mostly connected to individual
mistakes by road users.
The final aspect of risk is associated with the total number of traffic
incidents in an analysed location. Every collision or accident between a tram
and another vehicle should be a source of concern, as a large number of
incidents in one location, even if they are not of the same type and without
any casualties, is still an evidence of high risk in that location.
2.2. Criteria used in the proposed method
��� (1)
To describe the proposed method, a set of
numbers of potential hazardous road locations has been determined as:
![]()
where:
i - the number of each potential
hazardous road location at the intersection of tramlines and road traffic; and ![]() �- a total number of all potential
locations.
�- a total number of all potential
locations.
��� (2)
In order to take the aspect of time into
consideration, a set containing numbers of individual study years has been
determined as:
![]()
where:
t - the number of each year of
analysis; and ![]() �- the total number of years of
analysis.
�- the total number of years of
analysis.
An important issue, which has to be taken into consideration, is the
minimal study period. As collisions and accidents between trams and other
vehicles are rare, in comparison to those involving only road vehicles, a
minimal study period was determined to be three years. Such a period should
allow for the avoidance of randomness in the occurrence of incidents.
��� (3)
Moreover, analysed incidents may be divided into
categories. A set of the numbers of possible
categories of incidents has been determined as:
![]()
where:
k - the number of category of
incident; and ![]() �- the total number of categories
of incidents adopted in the analysis.
�- the total number of categories
of incidents adopted in the analysis.
An assumption was made that, in the proposed method for the
identification of hazardous road locations at the intersection of tramlines and
road traffic, three criteria would be used: one for each previously mentioned
aspect of risk. For each criterion, a measure was worked out in order to
express the level of risk in the analysed location in terms of numerical
values. A limit value for each criterion was also established.
2.2.1. Criterion of the severity of incidents - K1
In order to use the criterion of the severity of incidents, a measure
was proposed, which describes the level of risk associated with the analysed
aspect in terms of numerical values. The numerical value for criterion K1 in i location, i.e., ![]() , is calculated using the following formula:
, is calculated using the following formula:
��� (4)
where:
![]() �- the number of incidents involving fatalities in i location in t year of analysis; and
�- the number of incidents involving fatalities in i location in t year of analysis; and ![]() �- the number of incidents with only injured casualties in i location in t year of analysis.
�- the number of incidents with only injured casualties in i location in t year of analysis.
The criterion of severity is used in order to identify those locations
at the intersection of tramlines and road traffic, in which the risk that there
will be casualties as a result of an accident is especially high. Taking into
consideration the fact that a tram is a means of public transport, which is
often used by a considerable number of passengers, a reduction in the number of
incidents involving trams, which may result in injuries, should be of very high
priority.
��� (5)
However, such incidents are relatively rare;
therefore, the limit value for the criterion of severity was assumed
arbitrarily. This criterion shall be treated as fulfilled if at least one
incident results in casualties in the analysed location; thus, the limit value
![]() �of criterion K1 may be assumed as
�of criterion K1 may be assumed as ![]() �The decision about whether the criterion of
the severity of incidents is fulfilled should be taken on the basis of
the following formula:
�The decision about whether the criterion of
the severity of incidents is fulfilled should be taken on the basis of
the following formula:
![]()
2.2.2. Criterion of the homogeneity of incidents - K2
For the purpose of modelling safety at the intersection of tramlines and road traffic, five categories of
incidents were identified. The following categories have been distinguished:
-
k = 1: a minor collision between two vehicles, which were
parallel to each other at the moment of the incident, in which one of the vehicles was not taking part in
traffic
-
k = 2: a minor collision between two vehicles, which
were parallel to each other at the moment of the incident, in which both vehicles were taking part in traffic
-
k = 3: side collision
-
k = 4: front collision
-
k = 5: rear collision
Categories 1 and 2 were introduced due to the specificity of tram
traffic - its characteristic feature being that trams and road vehicles often
run parallel to each other. Incidents covered in these categories have resulted
in minor paint damage, usually as a result of contact between mirrors or a
mirror and the car body. As the proposed method does not include incidents with
pedestrians, no category including such incidents was distinguished.
��� (6)
In order to use the criterion of the homogeneity
of incidents, it is necessary to calculate the numerical value of criterion K2 in i location for k category of the accident, i.e.
![]() . This value is calculated on the basis of the following formula:
. This value is calculated on the basis of the following formula:

where: ![]() - the number of incidents
assigned to the k category in i location in t year of analysis.
- the number of incidents
assigned to the k category in i location in t year of analysis.
The criterion of the homogeneity of incidents is
used to identify those locations in which the structure of accidents is
homogeneous. The homogeneity of incidents is defined as the regular
occurrence of incidents assigned to the same category. Therefore, the
limit value of this criterion should be appropriate in eliminating incidents that
happen due to random causes, and not because of local risk factors, which
influence the behaviour of drivers [19]. In the proposed method, it was assumed
that the limit value should be calculated using the total number of years of
analysis: ![]() .
.
��� (7)
Therefore, the criterion of the homogeneity of
incidents shall be
considered as fulfilled on the basis of the following formula:
![]()
2.2.3. Criterion of
the number of incidents - K3
��� (8)
The final
criterion is calculated on the basis of the total number of incidents in a
particular location during the study period. To calculate the numerical value
of criterion K3 in i location, i.e.,
![]() , the following formula is proposed:
, the following formula is proposed:
�
where: ![]() �- the number of incidents assigned to the k category in i location in t year of
analysis.
�- the number of incidents assigned to the k category in i location in t year of
analysis.
The criterion of the number of incidents is
used to identify those locations that stand out from other locations because of
the total number of incidents. Therefore, there should be a significant
difference between locations that satisfy the proposed criterion and those that
do not. The limit value should be calculated using the quantile ![]() �of the number of incidents, which is expressed as:
�of the number of incidents, which is expressed as: ![]() .
.
��� (9)
Therefore, the criterion of the number of incidents is considered as fulfilled
when the numerical value of measure
![]() �is equal to or exceeds the
numerical value of limit value
�is equal to or exceeds the
numerical value of limit value ![]() ,� as in the following formula:
,� as in the following formula:
![]()
2.4. Groups of traffic
safety
In order to rank locations in terms
of traffic risk and to determine which locations should be the object of
further detailed analysis, once all the measures are calculated, each location
should be assigned to one of five groups of traffic safety. The assignment to
one of five groups is made according to criteria that are fulfilled in the
analysed location.
Criteria that are assumed to be
fulfilled for each group are presented in Table 1.
Tab. 1
Groups of traffic safety
|
Group |
Fulfilled
criteria |
|
I |
K1 and K2 and K3 |
|
II |
(K1 and K2) or (K1 and K3) |
|
III |
K2 and K3 |
|
IV |
K1 or K2 or K3 |
|
V |
- |
According to Table 1, if, in
the analysed location, all criteria are fulfilled, then such a location is
considered to be most hazardous. Locations assigned to Group I should be
analysed in the first place. If two out of three criteria are fulfilled, then
such a location may be assigned to Group II or III. As it is assumed that death
and injury as a result of an accident are the most dangerous effects of a
traffic incident, if one of the two fulfilled criteria is the criterion of severity,
then such a location should be assigned to Group II. Locations assigned to
Group I, II or III should be chosen for further analysis.
2.5. Procedure for
identifying hazardous road locations according to the proposed method
The procedure is shown in
Fig. 2. In order to use the proposed method, it is necessary to collect
data about all traffic incidents at the intersection of tramlines and road
traffic in the study area in the given period of analysis. The study period
should not be shorter than three years.
The collected data should include
information about the following:
-
Location of an incident (as precisely as possible)
-
Date of an incident
-
Time of an incident
-
Types of vehicles involved
-
Number of casualties (fatalities and injured)
-
Damages to vehicles
-
Causes of an incident
-
Responsibility
-
Circumstances of an incident
Fig. 2. Scheme for the
procedure of the proposed method;
source: own research
Each incident has to be assigned to one of five
categories. Subsequently, all locations of an incident should be identified. To each
identified location, the following information should be assigned:
�
-
Number of incidents for each category
-
Number of casualties (fatalities and injured)
-
Total number of incident
The next step is the calculation of
the numerical values of measures ![]() ,
, ![]() ,
, ![]() , according to Formulas (4), (6) and
(8). Then, these values are compared with the limit values, using Formulas (5),
(7) and (9), in order to check if the analysed criterion is fulfilled. On the
basis of fulfilled criteria, all locations are assigned to one of five traffic
safety groups. Locations assigned to Groups I, II and III should be subjected
to further analysis.
, according to Formulas (4), (6) and
(8). Then, these values are compared with the limit values, using Formulas (5),
(7) and (9), in order to check if the analysed criterion is fulfilled. On the
basis of fulfilled criteria, all locations are assigned to one of five traffic
safety groups. Locations assigned to Groups I, II and III should be subjected
to further analysis.
3. ANALYSIS OF DATA FROM TRAMWAJE
�L�SKIE S.A.
To present the application of the
proposed method, an analysis of the documentation of traffic incidents
involving trams, which belong to Tramwaje �l�skie, was conducted. The
documentation included information about incidents only with vehicles from
Katowice-Zawodzie Tram Depot. Incidents from 2014, 2015 and 2016 have been
analysed.
Katowice-Zawodzie Tram Depot is one
of four depots currently in operation on the Tramwaje �l�skie S.A. tram
network, which consists of [15]:
-
96.2 km of overhead cables
-
102.3 km of tram lines
-
10 traction stations
Currently, almost 100 vehicles are
in operation in the analysed depot. They run on 13 tram lines in the cities of
the Silesian Agglomeration [15].
3.1. Analysis of
documentation
The main sources of information
about the incidents were the reports written by tram drivers.
They are obligated to prepare such reports after every collision or accident.
Such reports include every piece of information that is needed for the proposed
method of identifying hazardous road locations. Unfortunately, the location of incidents was
not always defined precisely, which led to the necessity of excluding a few incidents from
further analysis.
More than 500 occurred during the
study period. The incidents that took place at the tram depot, on the
tram loops or on sections of the network, which are currently not in operation,
were excluded from further analysis. Therefore, 419 traffic incidents were
analysed. Out of these 419 incidents, in 391 cases, only vehicles were
involved, while, in 28, vehicles and pedestrians were involved. After incidents with
an unprecise location were excluded, 370 incidents (in which only vehicles were
involved) were chosen for further analysis.
Each incident was assigned to one of five groups
of categories of incidents. As it turned out, most incidents were
assigned to Group 3, i.e., side collision (over 60%). Group 2 was next, covering minor collisions between two vehicles, which were parallel to
each other at the moment of the incident, in which both vehicles were taking
part in traffic. The
exact numbers are shown in Fig. 3.
Fig. 3. Accident structure by
categories of incidents; source: own research
Once all incidents were assigned to particular
locations, it turned out that 370 incidents took place in 176 locations. In
106 locations, only one incident had taken place, while there were five or more incidents in
only 16 locations. The structure of the locations in which no more than 10 incidents were
recorded is presented in Fig. 4.
Fig. 4. Location structure by
number of incidents; source: own research
3.2. Identifying
hazardous road locations
Once all locations were identified,
for each location, the values of three measures determined by Formulas (4), (6)
and (8) were calculated. For the criterion of homogeneity K2 and the criterion
of the number of incidents K3, the limit values (![]() ) had to be
calculated.� In the case of the criterion
of homogeneity, the limit value was fairly easy to determine; as the study period
was three years, the limit value was also 3. In the case of the criterion of
the number of incidents, the numerical value of quantile Q95
was calculated. Following the appropriate calculation, all limit values were
determined to be as follows:
) had to be
calculated.� In the case of the criterion
of homogeneity, the limit value was fairly easy to determine; as the study period
was three years, the limit value was also 3. In the case of the criterion of
the number of incidents, the numerical value of quantile Q95
was calculated. Following the appropriate calculation, all limit values were
determined to be as follows:
![]()
![]()
![]()
����������������������������������������������
Once the numerical values of all
measures were calculated and compared to their limit values, it turned out that
11 locations, out of 176, at least fulfilled the requirements for Group III.
From these 11 locations, only two were assigned to Group II and none to Group
I. In Table 3, all hazardous road locations at the intersection of
tramlines and road traffic, as identified by the proposed method, are
presented.
Tab. 3
Locations identified according to the proposed method
|
No. |
Location |
Criterion K1 |
Criterion K2 |
Criterion K3 |
|
1. |
Intersection of Gliwicka Street in Katowice
and Ga�eczki and Armii Krajowej Streets in Chorz�w |
� |
� |
- |
|
2. |
Entrances to the parking areas for properties
267 and 271 on Gliwicka Street in Katowice |
� |
� |
- |
|
3. |
Section of road (about 150 m) before Za��e
Dw�r tram stop |
- |
� |
� |
|
4. |
Miarki Square in Katowice |
- |
� |
� |
|
5. |
Intersection of Gliwicka, Grundmanna and
Goeppert-Mayer Streets in Katowice |
- |
� |
� |
|
6. |
Intersection of Staroko�cielna, Szymanowskiego,
Towarowa and Krakowska Streets in Mys�owice |
- |
� |
� |
|
7. |
Intersection of Chorzowska and Bytomska
Streets in �wi�toch�owice |
- |
� |
� |
|
8. |
Section of road between Chorz�w Batory Train
Station and the intersection of Al. Bowid, Armii Krajowej and Inwalidzka
Streets in Chorz�w |
- |
� |
� |
|
9. |
Intersection of Gliwicka, �elazna and
Po�piecha Streets in Katowice |
- |
� |
� |
|
10. |
General Zi�tek Roundabout in Katowice |
- |
� |
� |
|
11. |
Intersection of Asfaltowa and Chorzowska
Streets in Ruda �l�ska |
- |
� |
� |
All locations that were identified as hazardous road locations were
objects of further and more detailed analysis, in order to identify reasons,
why these locations are of particular risk. They are presented on the fragment of a map of the Silesian
Agglomeration (Fig. 5). Red lines represent the current tram network in
this agglomeration, which is operated by analysed depot.
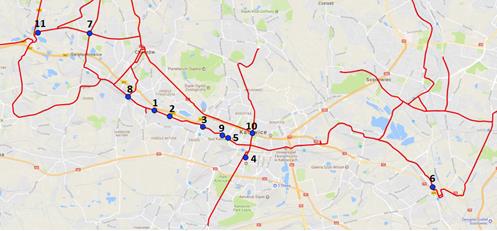
Fig. 5. Hazardous road
locations at the intersection of tramlines and road traffic, as identified by
the proposed method;
source: own research
4. CONCLUSIONS
The main goal of this paper was to
propose a method for the identification of hazardous road locations at the
intersection of tramlines and road traffic. The proposed method includes
different aspects of risk, thus allowing the problem of safety at the
intersections of tramlines and road traffic to be considered from various
points of view.
Nevertheless, the safety aspects of
tram traffic still need further research. It is still possible to perform a
more detailed analysis, i.e., by considering different categories of incidents (the
different number of categories as well) or even different criteria, such as the
cost of analysed collisions and accidents. That cost may apply not only to
property damage, but also to other actions, which must be undertaken when an incident
occurs.���
An analysis of the documentation
concerning incidents on the tram network, as operated by the
Katowice-Zawodzie Tram Depot, has been also presented. This allowed us to test
the proposed method on actual data. As a result, hazardous road locations at
the intersection of tramlines and road traffic have been identified and listed
in this paper. In further studies, these locations should be analysed in detail
to improve safety. Research should also cover incidents that took place in locations on
the tram network operated by other tram depots.
References
1.
Babu S. Shekhar, P. Vedagiri. �Traffic Conflict Analysis of Unsignalised
Intersections under Mixed Traffic Conditions�. European Transport\Transporti Europei 66(10): 1-12. ISSN 1825-3997.
2.
Bojar Piotr, Maciej Woropay, Miros�aw
Szubartowski. 2013. �The method of the evaluation of transport systems
operation safety�. The Archives of Transport 25-26
(1-2): 43-54 e-ISSN: 2300-8830
3.
Burdzik Rafa�, El�bieta Macioszek, Grzegorz Sierpi�ski, Jan Warczek.
2013. �Analysis of road traffic safety in Silesian province
on the background of Poland�. Zeszyty
Naukowe Politechniki �l�skiej s. Transport 79: 19-29.
4.
Czech Piotr. 2017. �Physically disabled pedestrians - road users in
terms of road accidents�. In: E. Macioszek, G. Sierpi�ski, (eds.). Contemporary Challenges of Transport Systems
and Traffic Engineering. Lecture Notes in Network Systems Vol. 2: 157-165. Springer. ISSN: 2367-3370. DOI:
https://doi.org/10.1007/978-3-319-43985-3_14.
5.
Czech Piotr. 2017. �Underage pedestrian road users in terms of road
accidents.� In: G. Sierpi�ski, (ed.), Intelligent
Transport Systems and Travel Behaviour. Advances in Intelligent Systems and
Computing, Vol. 505: 75-85. Springer. ISSN: 2194-5357. DOI:
https://doi.org/10.1007/978-3-319-43991-4_4.
6.
Gaca Stanis�aw, Marian Tracz,
Wojciech Suchorzewski. 2008. In�ynieria
ruchu drogowego. Teoria i praktyka. Warszawa: WK�. [In Polish: Road Traffic Engineering. Theory and Practice. Warsaw: WK�.] ISBN
978-83-206-1947-8.��
7.
Hussien H.H., Eissa F. H. 2016. �Identifying hazardous road locations in
Saudi Arabia�. Global Advanced Research
Journal of Engineering, Technology and Innovation (5) 45-56.
8.
KRBRD. �Level of
safety on roads in EU�. Available at:
http://www.krbrd.gov.pl/pl/aktualnosci/bezpieczenstwo-na-drogach-ue-najnowsze-dane-statystyczne.html.
9.
Montella Alfonso. 2010. �A comparative analysis of hotspot
identification methods�. Accident
Analysis and Prevention 42: 571-581.
10.
Osm�lska-Ja�dzik Agata. 2016. Wycena koszt�w wypadk�w i kolizji drogowych
na sieci dr�g w Polsce na koniec roku 2015, z wyodr�bnieniem �rednich koszt�w
spo�eczno-ekonomicznych wypadk�w na transeuropejskiej sieci transportowej. Warszawa: Instytut Badawczy Dr�g i Most�w. [In Polish:Pricing the Costs of Accidents and
Collisions on the Polish Road network at the End of 2015 with a Focus on the
Average Socio-economic Costs of Accidents on the Trans-European Transport
Network. Warsaw: Research Institute of Roads and Bridges.]
11.
Sadeghi Aliasghar. 2013. �Identification and prioritization of hazardous
road locations by segmentation and data envelopment analysis approach�. Traffic & Transportation 25(2):
127-136.
12.
Sobota Aleksander, Marcin Jacek
K�os, Grzegorz Karo�. 2017. �The influence of countdown timers on the traffic safety of
pedestrians and vehicles at the signalized intersection�. In G. Sierpi�ski
(ed.). Intelligent Transport Systems and
Travel Behaviour. Advances in Intelligent Systems and Computing Vol. 505:
13-21. Springer. ISBN: 978-3-319-43990-7978-3-319-43991-4.
13.
Starowicz Wies�aw. 2007. Jako�� przewoz�w w miejskim transporcie
zbiorowym. Krak�w:
Politechnika Krakowska. [In Polish: The
Quality of Urban Public Transport. Cracow: Cracow University of Technology.]
ISBN: 978-83-7242-427-3.
14.
Szczuraszek Tomasz. 2008. Bezpiecze�stwo ruchu miejskiego. Warszawa: WK�. [In Polish: Urban Traffic Safety. Warsaw: WK�.] ISBN 978-83-206-1557-9.
15.
Tramwaje �l�skie
S.A. �Rolling stock and infrastructure�. Available at: http://www.tram-silesia.pl/www/index.php/tabor/.
16.
Turek Dorota. 2017. Transport. Wyniki dzia�alno�ci w 2016 r. Warszawa:
GUS. [In Polish: Transport. Activity Results in 2016. Warsaw:
GUS.] ISSN 1506-7998.
17.
Van Oort N. 2016. �Incorporating enhanced service reliability of public
transport in cost-benefit analyses�. Public
Transport 8(1): 143-160. DOI: https://doi.org/10.1007/s12469-016-0121-3.
18.
Washington Simon. 2013. �Identifying black spots using property damage
only equivalency (PDOE) factors�. In 16th
Road Safety on Four Continents Conference, Beijing, China.
19.
Yannis George, Panagiotis Papantoniou, Marios Nikas. 2017. �Comparing
young drivers speeding behavior at rural areas in normal and simulation
conditions�. European
Transport\Transporti Europei� 66(5):
1-13. ISSN 1825-3997.
Received 03.09.2017; accepted in revised form 12.11.2017
![]()
Scientific Journal of Silesian
University of Technology. Series Transport is licensed under a Creative
Commons Attribution 4.0 International License