Article citation information:
Merkisz, J., Galant, M., Bieda, M. Analysis of operating instrument
landing system accuracy under simulated conditions. Scientific Journal of Silesian University of Technology. Series
Transport. 2017, 94, 163-173. ISSN: 0209-3324. DOI: https://doi.org/10.20858/sjsutst.2017.94.15.
Jerzy MERKISZ[1],
Marta GALANT[2],
Michał BIEDA[3]
ANALYSIS OF OPERATING INSTRUMENT LANDING SYSTEM
ACCURACY UNDER SIMULATED CONDITIONS
Summary. The
instrument landing system (ILS) is the most popular landing aid in the world.
It is a distance-angled support system for landing in reduced visibility, while
its task is the safe conduct of the aircraft from the prescribed course landing
on the approach path. The aim of this study is to analyse the correctness of
the ILS in simulated conditions. The study was conducted using a CKAS MotionSim5
flight simulator in the Simulation Research Laboratory of the Institute of
Combustion Engines and Transport at Poznan University of Technology. With the
advancement of technical equipment, it was possible to check the operation of
the system in various weather conditions. Studies have shown that the impact of
fog, rain and snow on the correct operation of the system is marginal.
Significant influence has been observed, however, during landing in strong
winds.
Keywords:
instrument landing system, flight simulator, CKAS MS5
1. INTRODUCTION
From the moment when
people began to be transported, a major problem has been location. In the
beginning, the position and the way forward were determined by the stars.
Later, with the development of means of transport, many methods to determine
the position in which the object is located were invented. The field of
science, in this area of navigation, is defined as the science of the ways,
methods and technical means of conducting moving objects according to the
route, route selection, determination of the position of movable or immovable
objects, and determination of errors of positions measurement [7].
Air navigation as a
field of study covers issues, both theoretical and practical, concerning the
safe and economical operation of the aircraft after embarking on the set route.
Navigating the aircraft is a set of activities performed by the pilot and/or
navigator to determine the geographical position of the aircraft, as well as
determine and maintain the navigational flight parameters, such as rate,
altitude and speed, which are necessary to operate an aircraft on the required
route in the appointed time to the destination [10].
Many factors affect
the proper operation of the ILS [9]. All of them, however, were examined and
described in Annex 10 to the Convention on International Civil Aviation. Thanks
to the recommendations issued by the ICAO, the risk of malfunction of the
system is minimized to an acceptable level, which significantly improves the
safety of the aircraft for the approach and landing. In this work, however, we
decided to validate the system under simulated conditions.
The aim of this study
is to investigate the correctness of the ILS. The study was conducted in the
Simulation Research Laboratory of the Institute of Combustion Engines and
Transport at Poznan University of Technology. The CKAS MotionSim5 simulator
used in the research was produced by CKAS Mechatronic Pty. Ltd.
2. INSTRUMENT LANDING SYSTEM
ILS tests began in 1929 in the USA
[6]. The Civil Aeronautics Administration (CAA) authorized the installation of
the system in 1941 at six locations. The first landing of a scheduled US
passenger airliner using an ILS was on 26 January 1938, when a Pennsylvania
Central Airlines Boeing 247D flew from Washington, DC, to Pittsburgh, PA, where
it landed in a snowstorm using only an ILS [8]. The first fully automatic
landing using an ILS occurred in March 1964 at Bedford Airport in the UK.
An ILS operates as ground-based
instrument approach system, which provides precision lateral and vertical
guidance to an aircraft approaching and landing on a runway, using a
combination of radio signals and, in many cases, high-intensity lighting arrays
to enable safe landing during instrument meteorological conditions, such as low
ceilings or reduced visibility due to fog, rain or blowing snow [3, 11].
An ILS comprises two segments: a
ground segment and airborne segment. The ground segment includes a localizer
(LOC or LLZ), an ILS glide slope, marking markers and DME radio beacons, while
the airborne segment consists of three receivers: VOR/LOC, ILS-GP receiver and
the markers’ receiver.
According to Annex 10 of the ICAO,
there are three categories of ILS, with the last category being the most
accurate and comprising another three subclasses. The division of ILS
categories is shown in Table 1.
Table 1. ILS categories for precision instrument
approach and landing [4]
|
Approach
category |
Runway visual range (RVR) |
|
|
I |
200 ft
(61 m) or more |
|
|
II |
Less
than 200 ft but more than 100 ft (30 m) |
1,000
feet (300 m) |
|
III a |
Less
than 100 ft but more than 50 ft (15 m) |
600 feet
(180 m) |
|
III b |
Less
than 50 ft (15 m) |
150 feet
(46 m) |
|
III c |
No
limitations |
None |
Smaller aircraft are generally
equipped to only fly with a CAT I ILS. On larger aircraft, these approaches are
typically controlled by the flight control system with the flight crew
providing supervision. The CAT I relies only on altimeter indications for
decision height, whereas CAT II and CAT III approaches use a radio altimeter to
determine decision height. Furthermore, as the Category III c ILS is able to
perform a precision instrument approach and landing, with no decision height
and unlimited RVR, it can be claimed that this offers a fully automatic
approach for landing.
3. RESEARCH METODOLOGHY
3.1. CKAS MotionSim5 simulator
The CKAS MotionSim5 flight
simulation training device (FSTD) is a software- and hardware-based system that
couples the reliability of modern desktop computer equipment, on a custom-built
motion platform, with a cockpit that provides control devices that are
identical or similar to those found on real aircraft. The CKAS MotionSim5
trainer (Fig. 1) is designed to simulate four generic types of light aircraft:
a piston single-engine aircraft, such as the Cessna C172, a piston twin-engine
aircraft, such as the Piper PA44 Seminole; a light twin-engine turboprop
aircraft, such as the Beechcraft KingAir; and a light jet, such as the Cessna
CitationJet. It is not intended to simulate a particular aircraft model, but
rather to represent a typical aircraft of each class in its handling qualities
and features.
The aircraft used for the test is a
twin-engine jet designed for use by up to nine people. It is very light
business jet.
All simulated aircraft are equipped
with a common Garmin G1000-like avionics package. Some equipment, such as
throttle quadrants or starter panels, are aircraft-specific and should be
installed by the user for each particular model.
The MS5 Visual System provides a
wide 200° × 40° field of view with high resolution [1]. It consists of three
full-HD projectors, three high-end PCs for image generation and a screen. An
additional PC is used to drive flight instruments and for general flight
simulation.
The movement simulator cab is made
possible by the electrical motion system with six degrees of freedom. This
makes it possible to obtain a high level of accuracy in performing movement.
The system tilts the hull in every possible direction at an angle of 18° and
moves it by 150 mm [1].
The instructor station provides
control over the flight simulator environment in respect of weather,
positioning, malfunctions, and real-time tracking and flight recording, for
example. Additionally, it is possible to take operations from and to almost
every airport in the world.
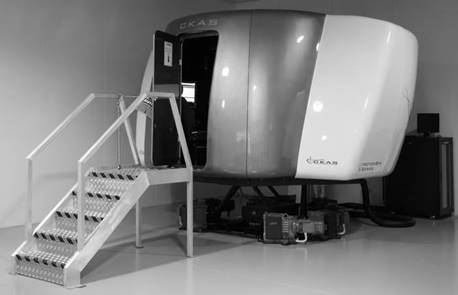
Fig. 1. CKAS MotionSim5 simulator [5]
3.2. The course of study
The aim of the study was to
determine the effect of weather conditions on the correct operation of an ILS
system. Poznań-Ławica Airport was selected as the destination airport for the
tests. It is equipped with a CAT I ILS installed on RWY28.
Each of the flights started from the
same place at the same altitude, i.e., 7 NM from RWY28 and located exactly in
the axis of the runway, while the initial height was 2,200 ft.
After setting the frequency of the
ILS in Poznan, i.e., 110,300 MHz, the correct interception of the localizer’s
beam (course and direction), the aircraft should have begun the approach
automatically. The operator was responsible only for the disposition of a
thrust of engines, as the other parameters were controlled by the on-board
computer cooperating with the ILS.
Graphs were generated after each of
the flights:
• altitude
above ground level
• indicated
aircraft speed
• aircraft
vertical speed
• pitch
In addition, logs of various
approaches were recorded in order to create spatial graphs using Google Earth
and charts showing the trajectory deviation from the ideal approach path (azimuth
and elevation).
4. RESULTS
4.1. Base flight
The first flight was conducted under
CAVOK conditions. CAVOK is an abbreviation of Ceiling And Visibility OKay,
indicating no cloud below 5,000 ft (1,500 m) or the highest minimum sector
altitude and no cumulonimbus or towering cumulus at any level, a visibility of
10 km or more and no significant weather change [2]. In addition, it
established a lack of wind. This flight was supposed to be the base, while its
landing approach could be regarded as exemplary.
Figure 2 shows a three-dimensional
(3D) glide path made with the Google Earth. To better illustrate this
trajectory, we should also compare it with the curve generated by the FS
Instructor software. The program, in addition to the glide path in the flight,
applied an ideal path.
a) b)
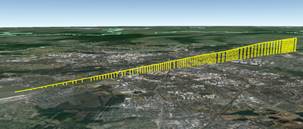
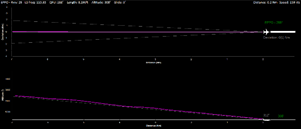
Fig. 2. Glide path in the first
flight: a) 3D (Google Earth)
and b) generated by FS Instructor
As shown, the deviation from the
path defining the axis of the runway is similar to the ideal for the entire
approach and landing (Fig. 2a). In the case of the glide path, slight
deviations from the ideal can be seen (Fig. 2b). This may be caused by manual
thrust control and problems with keeping constant speed while approaching. This
scenario is illustrated by the indicated aircraft speed graph (Fig. 3a).
b) a)
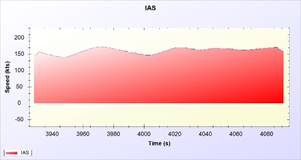
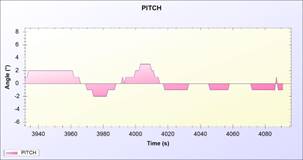
Fig. 3. Parameters in the first
flight: a) indicated airspeed (IAS)
and b) pitch angle
The IAS was not equal throughout the
landing (Fig. 3a), possible due to the manual thrust control and delays between
the change in the throttle position and the engine response to this change.
Speed fluctuations affect the climbing angle, which is determined automatically
by the on-board system in collaboration with the ILS (Fig 3b).
From Figure 3, it can be deduced
that, when the speed drops, the aircraft, in order to maintain an adequate rate
of glide, changes the climb angle from a negative value (about 2°) to a
positive value (such as 3°). The more stable the IAS was, the smaller the
fluctuations that occurred in the changed climb angle.
4.2. Flight in fog
The second approach to land was made
in order to check the proper operation of the CAT I ILS minima, provided by the
ICAO. In addition, as in the case of landing performed by real aircraft, a
slight turbulence were generated. Similar to the first flight, wind speed was
set to 0 kt. Visualization of a 3D glide path made with Google Earth showed no
significant deviation (Fig. 4a).
Figure 4, as in the case of the
first (base) flight, shows that, with regard to the deviation from the axis of
the runway, the altitude coincides with an ideal path for almost its entire
length. Minimum deviation can result from turbulence caused by fog and,
identical to the first flight, manual thrust control.
b) a)
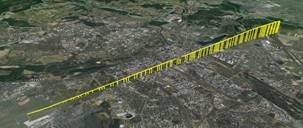
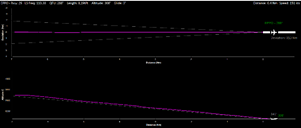
Fig. 4. Glide path in the second
flight: a) 3D (Google Earth) and
b) generated by FS Instructor
Any change in the IAS was reflected
in the change of the climbing angle (Fig. 5b). Compared to a
standard flight, it should be noted that, although more frequent changes in
speed occur (Fig. 5a), the angle of climb does not change as rapidly as
the first flight. The reason for this may be that the speed of the second
flight was more stable. The last part of the graph shows a sharp increase in
the climbing angle, which is due to the exclusion of the autopilot and
acquisition of control by the pilot.
a) b)
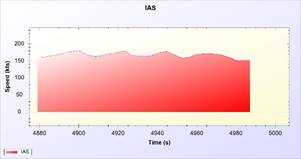
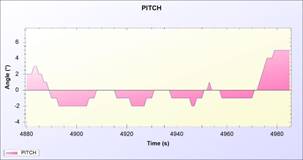
Fig. 5. Parameters in the second
flight: a) IAS and b) pitch angle
4.3. Flight in snow
The third simulated approach was
landing under snowfall conditions. The purpose of this simulation was to test
the effect of snowfall on the proper operation of the ILS. In this case, it
also included the force and direction of the wind. In the CKAS MotionSim Driver
Remote Control program, two types of wind should be defined: aloft (base: 1,000
ft, speed: 15 kt, direction: 0°) and ground (base: 0 ft, speed: 8 kt,
direction: 0°). Figure 6 shows a) a 3D path landing approach made in Google
Earth, and b) a graph showing the glide path, along with the applied ideal GP
line, created with FS Instructor.
For this approach, the difference
with the previous approach is that the aircraft initially deviated from the
ideal path and was on the right side of the runway. After about 1.5 NM, the
aircraft was on the left side of the runway’s centre line. The ideal glide path
was not covered until a distance of 4 NM from the runway.
b) a)
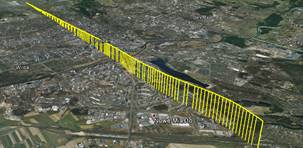
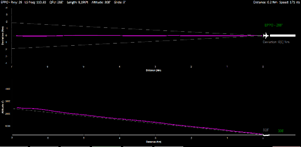
Fig. 6. Glide path in the third
flight: a) 3D (Google Earth)
and b) generated by FS Instructor
b) a)
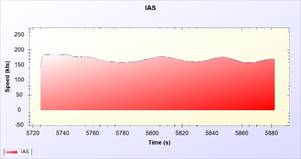
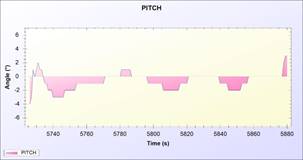
Fig. 7. Parameters in the third
flight: a) IAS and b) pitch angle
The IAS (Fig. 7a) is similar to that
in the charts created for the previous flights. The difference is in value of
the speed. For the previous approaches, it was about 150 kts, while, in the
case of landing during a snowfall, the speed was higher by about 30 kts. It can
be seen that, despite the higher speed, the glide path still does not deviate
significantly from the standard.
In the pitch angle graph (Fig. 7b),
a significant moment occurs during the start of the approach with the rapid
change in the angle. This is probably due to the fact that the on-board
computer sought to direct the aircraft to the ideal path relative to the axis
of the runway.
4.2. Flight in strong wind
The fourth simulation was carried
out under conditions of strong wind. The meteorological conditions were created
specifically for this study. Wind speed was set to 80 kt (150 km/h), which
corresponds to the wind speed during a storm strength of 17° on the Beaufort
Scale. Winds of similar speed can also be found during a hurricane. Apart from
the wind force changes, an additional difficulty for the ILS was that wind
direction changed when crossing 1,500 ft. The strength of the turbulence caused
by the wind is set to the highest possible level. Figure 8 shows a) a 3D path
landing approach made in Google Earth, and b) a graph showing the glide path
along with the applied ideal GP line, created with FS Instructor. It can be
seen that the ILS failed to guide the aircraft to the runway. Deviation from
the ideal glide path took place at the start of approach. The aircraft guided
by the ILS touched down about 15 m from the outer edge of the runway. In the
case of landing in such conditions, it would be the pilot’s responsibility to
disrupt the approach. If that were to occur while reaching the decision height,
the aircraft would not be in the axis of the runway.
b) a)
Fig. 8. Glide path in the fourth
flight: a) 3D (Google Earth)
and b) generated by FS Instructor
The descent of the ideal glide path
took place at the beginning of the approach. The aircraft continued until the
end of the right path glide. Touchdown occurred at the beginning of the runway.
The visualized IAS (Fig. 9a) did not differ from that which could be observed
for the standard approach, as the waveform is close to it. Therefore, the impact
of speed on the accuracy operation of the ILS can be ruled out. It should be
noted that this was the only parameter in the studies that influenced the human
factor. The course changes in the pitch angle (Fig. 9b) shows that the descent
of the ideal path took place at the moment of the most significant change to
that angle.
b) a)
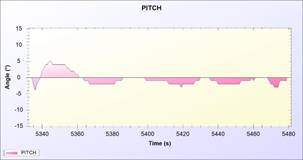
Fig. 9. Parameters in the fourth
flight: a) IAS and b) pitch angle
4.3. Flight using the boundary
conditions of the wind that can be used in the simulation
The final simulated approach was
performed in conditions of maximum obtainable wind. The CKAS MotionSim5
simulator limited wind speed to 150 kt (about 280 km/h). This is equal to the
speed at which most powerful hurricanes blow. It should be noted that, on
account of the hurricane’s direction and return, the wind undergoes dynamic
changes. It is therefore impossible to perform flights under real conditions in
this weather. In the simulation, wind direction changed only once after
crossing 1,500 ft, while its speed was constant.
The glide path differs significantly
from those of previous approaches (Fig. 10), lacking a steady reduction
altitude and rectilinear flight in the direction of the axis of the runway. The
study was interrupted when the aircraft was at an altitude of about 2,200 ft
because it was away from the runway by 2.3 NM (about 4.26 km) in a straight
line.
The path marked with a perfect
landing path (Fig. 10) shows how dynamically the altitude was changing.
Contrary to what can be seen on the previous graphs, the descent to the
destination airport did not proceed evenly. In addition, it should be noted
that the ILS approach finished within 4 NM of the runway threshold. At this
point, the aircraft left the operating range of the system. As can be seen in
the chart, control was lost during the glide slope descent at a distance of
approximately 1.8 NM from the airport.
The IAS course (Fig. 11a) and the
change in pitch angle (Fig. 11b) differ from those of previous approaches. The aircraft’s
IAS was substantially higher than in previous landings, which is explained by
the lack of control over its speed using the throttle. Despite setting the
throttle in the “idle” position, as a result of wind gusts, the aircraft
accelerates.
b) a)
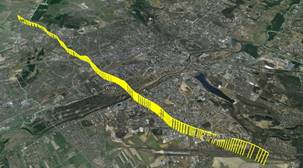
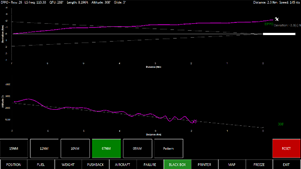
Fig. 10. Glide path in the fifth
flight: a) 3D (Google Earth)
and b) generated by FS Instructor
It is noteworthy that the pitch
angle graph changes the scale of the vertical axis (Fig. 11b). This is due to
the fact that the change of angle was larger than that in previous approaches.
In previous approaches, we did not observe the angle of ascent reaching a value
greater than ± 3°; for this test, the landing angle reached a value as high as
± 10°.
b) a)
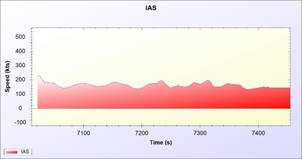
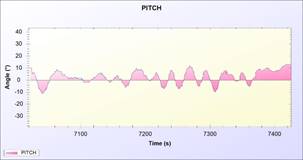
Fig. 11. Parameters in the fifth
flight: a) IAS and b) pitch angle
5. CONCLUSIONS
The aim of this study was to examine the
accuracy of an ILS in simulated conditions. The study was conducted using the
CKAS MotionSim5 flight simulator based in the Simulation Research Laboratory of
the Institute of Combustion Engines and Transport at Poznan University of
Technology. With the advancement of technical equipment, it was possible to
carry out a full set of simulations. The study focused on the impact of weather
conditions on the correct operation of the ILS, such as:
•
fog
•
rain
•
snow
•
wind
Research
began with the base flight under CAVOK conditions, after which four flights
were made in adverse weather conditions. During the last simulation, boundary
settings for wind conditions, which are possible to use in the simulator, were
set.
The research led to the following conclusions
about the operation of the ILS system:
•
The
impact of fog, rain and snow on correct ILS functioning is marginal, as the
aircraft in cooperation with the ILS made correct approaches and landings in
these weather conditions.
•
In the case of landing with the wind blowing at a
speed of 50 kt (about 93 km/h), increased operation of the on-board system
(autopilot) was observed.
•
When landing in strong wind, with a speed of 80 kt
(150 km/h), the ILS system in collaboration with the on-board system failed to
guide the aircraft on the runway axis.
•
When landing in extreme weather conditions, i.e.,
with gusts of wind of up to 150 kt (about 280km/h), it was impossible to make an approach by
only using automatic landing systems.
The conditions in which the ILS system failed
to perform the correct approaches are comparable to hurricanes. It should be
noted that the most intense tropical cyclone ever recorded in the Atlantic
Basin (Hurricane Wilma) has been qualified as a Category 5 hurricane with winds
of 185 mph (295 km/h).
Analysis
of the IAS and pitch angle charts allowed us to observe the relationship
between the flight parameters. In the case of the approach with a CAT I ILS,
human intervention was only required for the disposition of engine thrust,
which, in part, affected the IAS; the remaining parameters were set by the
system automatically. It has been noted that, with regard to the close
relationship between parameters, changing one affects the other.
The work
carried out in this study was dictated by the fact that the ILS is the most
widely used system in aviation; indeed, every airport is currently equipped
with this system. The correct operation of the system affects safety when
flying or landing aircraft. As this study is far from exhaustive, however, we
recommend that a complete analysis should be carried out on the impact of other
factors on the operation of the ILS.
References
1.
CKAS. 2015. CKAS MotionSim5 FSTD Operations Manual.
Melbourne: CKAS.
2.
GetMet. 2012. Make a Difference to Your Flying with
Accurate Weather Briefing. 2016. Available at: http://www.metoffice.gov.uk/.
3.
Heading. ND.
“Lotnicze systemy nawigacyjne”. [In Polish: “Air navigation systems”]. 2016.
Available at: http://www.heading.pata.pl.
4.
Annex 10 to the
Convention on International Civil Aviation. Vol. I: Radio Navigation Aids.
ICAO, 2006.
5.
Merkisz Jerzy,
Marta Galant, Michał Zalewski. 2016. “Research on the influence of weather
conditions on the pilot’s psychophysical condition”. Journal of Mechanical and Transport Engineering, Vol. 68 (1). ISSN 2300-3596.
6.
Planes Are Landing by Radio When Fog Hides the Field. 1931. Chicago, IL: Popular Mechanics.
7.
PWN. ND.
“Nawigacja”. [In Polish: “Navigation”]. 2016. Available at: http://encyklopedia.pwn.pl/haslo/nawigacja;4009285.html.
8.
Mola Roger. 2010.
“History of aircraft landing aids”. 2016. Available at: http://centennialofflight.net.
9.
Compa Tadeusz, Jan
Rajchel J. 2011. Podstawy nawigacji
lotniczej. Dęblin: Wydawnictwo Wyższej Szkoły Oficerskiej Sił Powietrznych.
[In Polish: Basics of Air Navigation.
Deblin: Polish Air Force Academy Publishing]. ISBN 978-83-60908-92-1.
10.
Wyrozumski Wacław.
1984. Podręcznik Nawigacji Lotniczej.
Warszawa: Wydawnictwa Komunikacji i Łączności. [In Polish:
Manual Air
Navigation. Warsaw: Communications and Liaison Publishing]. ISBN
83-206-0420-6.
11.
Kharchenko
Volodymir, Bo Wang, Andrii Grekhov, Anna Leschenko. 2014. “Modelling the
satellite communication links with orthogonal frequency-division multiplexing”.
Transport, Vol. 31, Issue 1: 22-28.
DOI: http://dx.doi.org/10.3846/16484142.2014.1003599. ISSN: 1648-4142.
Received 12.12.2016;
accepted in revised form 18.02.2017
![]()
Scientific Journal of Silesian University of
Technology. Series Transport is licensed under a Creative Commons
Attribution 4.0 International License