Article citation information:
Głowacki, P., Balicki,
W. ICAO aviation occurrence categories significantly affecting aviation safety
in Poland from 2008 to 2015. Scientific
Journal of Silesian University of Technology. Series Transport. 2017, 94, 47-56. ISSN: 0209-3324. DOI: https://doi.org/10.20858/sjsutst.2017.94.5.
Paweł GŁOWACKI[1],
Włodzimierz BALICKI[2]
ICAO AVIATION
OCCURRENCE CATEGORIES SIGNIFICANTLY AFFECTING AVIATION SAFETY IN POLAND FROM
2008 TO 2015
Summary. Poland, as a member of the EU, is represented within
the ICAO, by the European Aviation Safety Agency. However, this does not
relieve our country from the responsibility of developing a state safety
programme (SSP). The need to set up such a programme, which has to be specific
to every country involved in aviation operation, was introduced by the ICAO’s
Annex 19. One of the important points in Annex 19 is: “5.2.1 Each State shall
establish and maintain a safety database to facilitate the effective analysis
of information on actual or potential safety deficiencies obtained, including
that from its incident reporting systems, and to determine any actions required
for the enhancement of safety”. The Polish Civil Aviation Authority, along with
other databases, manages the European Coordination Centre for Aviation Incident
Reporting Systems (ECCAIRS). The authors (who are specialists dealing with
exploitation processes in aviation) have conducted a laborious processing
of the data contained in the ECCAIRS database, analysing them based on various
criteria: aviation occurrence categories (as defined by the ICAO), phases of
flight for different airports in Poland etc. Aircraft with an maximum take-off mass
(MTOM) <5,700 kg (mainly general aviation) and for aircraft with
an MTOM >5,700 kg (commercial aviation) were considered separately. It
was found that the most events are those that relate to power plant (SCF-PP)
airframes and related system (SCF-NP) failures, followed by collisions with
birds (BIRD), events related to airports (ADRM) and events related to the
required separation of aircraft (MAC). For lighter aircraft, the dominant
categories are ARC, CTOL, GTOW and LOC-I events. The article presents a
proposed method for predicting the number of events, determining the alert
levels for the next years and assuming a normal distribution (Gaussian). It is
one of the first attempts to use actual data contained in the database of
events on airports in Poland. The results of this analysis may support the
decisions of supervisory authorities in the areas where security threats are
most important.
Keywords: air transport, security management, aircraft
accident, aircraft power plant
1. INTRODUCTION
For several years, air traffic in
Poland, as measured by the number of passenger operations in major airports,
has remained stable, albeit with a slight upward trend (see Fig. 1). Almost
half of these operations are carried out at Warszawa-
Okęcie Airport. Poland, as an EU member state,
is obliged to introduce a system of air traffic safety oversight,
including aviation occurrence reporting for collection by ECCAIRS.
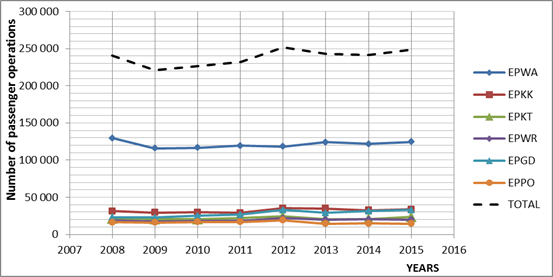
Fig. 1. Number of passenger operations at the main Polish airports [2]
(EPWA - Warszawa-Okęcie,
EPKK - Kraków-Balice, EPKT - Katowice-Pyrzowice,
EPWR - Wrocław-Strachowice, EPGD - Gdańsk- Rębiechowo,
EPPO - Poznań-Ławica)
It should be noted that the number
of reported occurrences involving large aircraft (with an MTOM >5,700 kg)
increased between 2009 and 2014 by as much as 112% (see Fig. 2), while in
the same period the number of passenger operations increased by just over 9%.
Reported air traffic events are
eligible for each category defined by the ICAO in periodically published
bulletins [1]. The most recent provides 36 aviation occurrence categories
related to traffic events at the airport, during flights, weather conditions,
events in the cabin, or power plant or airframe failures. Each category is
coded, such as ARC (abnormal runway contact), BIRD (bird strike) and GCOL
(ground collision).
The process of events qualification is quite
complicated, because it sometimes requires the extraction of vital meaning from
the occurrence description submitted by the crew or ground service. Mistakes
made at this stage of the database creation can result in the falsification of
outcomes and conclusions reached. It seems that efforts should be made to
“objectify” the process. Reservations cover a range of events according to the
categories introduced by the ICAO. Some of them are very detailed or even
duplicated, for example, F-NI (fire/smoke
non-impact) and F-POST (fire/smoke post-impact).
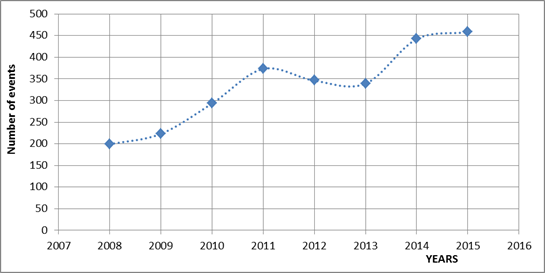
Fig. 2. Number of reported
occurrences in the main Polish airports for aircraft
with an MTOM >5,700 kg
(from ECCAIRS database)
The authors introduced, for the
purpose of analysis, the additional category of LASER in order to define cases
of the blinding of aircraft crews by laser lights from the ground on the
approach to landing.
2. RESEARCH METHOD
ECCAIRS comprises reports submitted
by different aviation organizations. It is very extensive, containing more than
6,000 records (events) for air traffic reported from 2008 to 2015. During this
period of time, the number of aircraft involved in air traffic changed, as well
as the number of passenger operations at airports. In order to objectify the
analysis of the data, coefficients, relating the number of events to the number
of registered aircraft (per 100 aircraft) or the number of passenger operations
at a given airport during the period considered (per 1,000 passenger
operations), were introduced.
![]() (1)
(1)
![]() (2)
(2)
where LZGA, LZK represent
the number of events for aircraft with an MTOM <5,700 kg and an MTOM
>5,700 kg, respectively, while LSPGA, LSPK represent
the number of registered aircraft with an MTOM <5,700 kg and an MTOM
>5,700 kg, respectively.
![]() (3)
(3)
where LZ represents the number of events, while
LOairport, is the number of passenger
operations at a certain airport.
The current method for analysing the
data contained in ECCAIRS is based on comparing the number of events in the
current year with a corresponding number of events in the previous year. The
decrease in the number of events is considered as an indicator of safety
improvement.
The authors propose forecasting
based on observing trends over several years and setting alert levels, while
assuming a normal distribution. These forecasts should be verified annually by
comparing them with actual numbers of events.
To determine the alert levels, we
propose the method of Shewhart control charts, which
allow for the observation of process variability, as well as identifying the
reasons that cause this increase in volatility [3]. Shewhart
divided causes of process variation between random and special. Random causes
are many and the effect of each is relatively small compared with the result of
the occurrence of special causes, although the cumulative effect of random
causes is usually quite significant. The main purpose of this kind of process
monitoring is, thus, to signal deviations from a statistically stable condition
caused by special reasons. They are associated with human activities (operator,
pilot etc.) or characteristics of machine changes (e.g., aircraft engine) and,
when found, should be removed or corrective action taken.
The Shewhart
control chart limits (see Fig. 3) are located 3s on each side of the centre line
(average values m), where s is the standard deviation in each
subset of the population estimated by the variability of the samples. The
interval from -3s to +3s comprises 99.73% of the total area
of the characteristic dispersion. The boundaries established at 3s show that about 99.73% of the subset will be
in the area defined by control lines, assuming that the process is
statistically regulated. The control chart also contains 2s limits on both sides of the line of mean
values m as alert levels. In this area should be 95.4% of the variation of the
studied phenomenon.
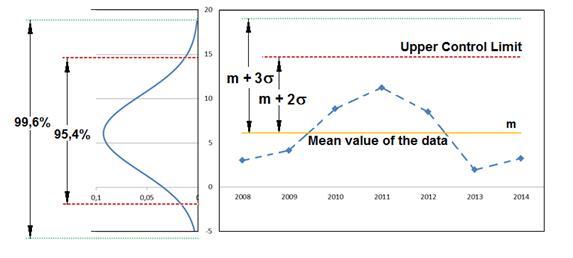
Fig. 3. Dependence between the
confidence level and confidence interval: m - mean; Ϭ - standard
deviation
Samples that appear outside 2s may indicate the possibility of going beyond
the defined control limits. Methodology for determining the forecast for the
next year and determining alert levels for specific types of events involving
the 2Ϭ criterion has been developed.
To date, the data from ECCAIRS have been
processed by dividing the events according to the following criteria:
- aircraft with an MTOM <5,700 kg
and an MTOM >5,700 kg
- ICAO aviation occurrence category
(36)
- site of the event
- flight phase
Between 2008 and 2015, around
2,100-2,200 aircraft with an MTOM <5,700 kg and 110-140 aircraft with an
MTOM >5,700 kg and with Polish registration were operated (the number of
helicopters in both categories was 10 times less). Every year, about 140-300
events involving aircraft with an MTOM <5,700 kg and 300-700 aircraft
with an MTOM >5,700 kg are reported. It is highly noteworthy that, in
relation to the number of aircraft, the number of reported events is almost 40
times less for aircraft with an MTOM <5,700 kg.
3. CALCULATION OF RESULTS
The analysis shows that, in the
observed period of 2008-2015, the most commonly reported events were related to
the malfunction of an airframe (SCF-NP), representing more than 25% of all
events regardless of the aircraft category (see Fig. 4).
Other events having a significant
impact on the level of safety were identified as follows:
- MTOM >5,700 kg: BIRD,
ADRM, SCF-PP, MAC, LASER, MED, RAMP
- MTOM <5,700 kg: SCF-PP, ARC,
CTOL, MAC, GTOW, LOC-I, BIRD
Figure 5 shows that the events
reported in many phases of a flight do not depend on the aircraft category and
are similar for take-off, standing, taxi and en-route.
In the MTOM <5,700 kg category, events during landing twice as often
than for the MTOM >5,700 kg category. On the other hand, in the MTOM
>5,700 kg category, the majority of events were reported during
the approach.
Analysis of the total number of
events with reference to the number of passenger operations (i.e., the
coefficient W1000) indicates an increasing trend. In 2008, its value was 0.83,
while, in 2015, it increased to 1.84 (see Fig. 6).
The above-described method can be
used to predict the number of events in the future and set alert levels. Figure
7 shows the results of these calculations for all occurrences in Poland
concerning MTOM <5,700 kg category aircraft. The expected average values and
alert levels for 2016 and 2017 were calculated using the known values of the
ZSGA coefficients for previous years.
The LASER category was analysed in a
similar manner. Figure 8 shows the growth of this phenomenon in the past
seven years and the forecast for the next two years.
Figures 7-8 present examples of
possible transformations; while others exist, they were not shown due to space
limitations.
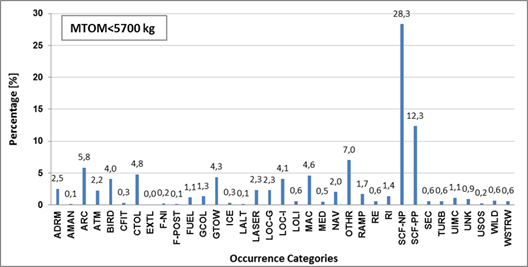
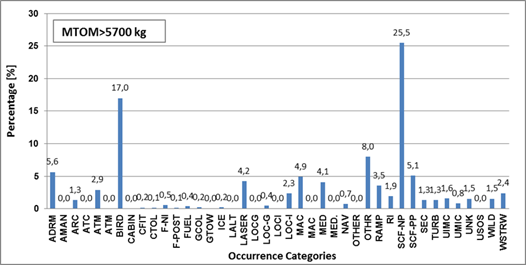
Fig. 4. Percentage share of the number of reported
occurrence categories in each aircraft category: MTOM <5,700 kg (top), MTOM
>5,700 kg (bottom)
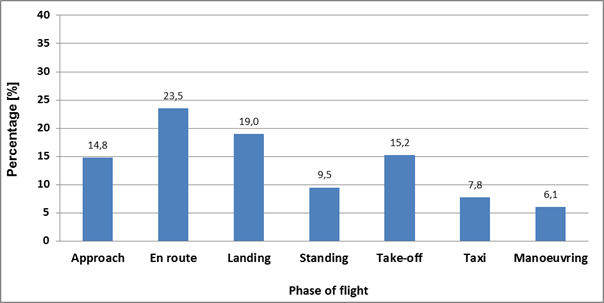
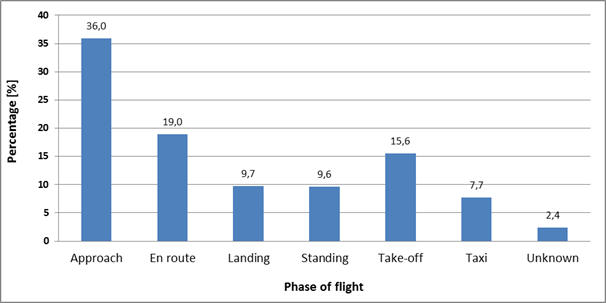
Fig. 5. Percentage share of the number of reported
events during certain phases of an aircraft flight in each aircraft category:
MTOM <5,700 kg (top), MTOM >5,700 kg (bottom)
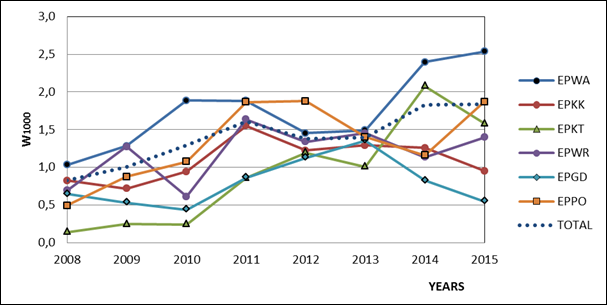
Fig. 6. Changes in the value of W1000
coefficients at a particular airport
(airport symbols are the same as in Fig. 1)
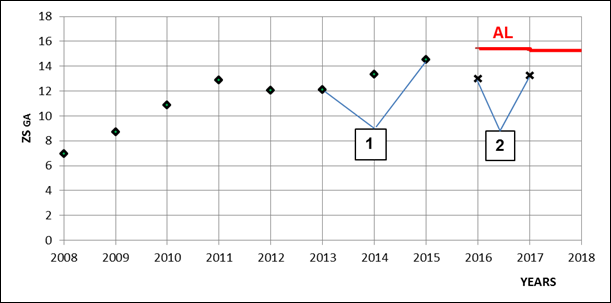
Fig. 7. Changes of ZSGA coefficients
(per 100 registered aircraft):
1 - calculated real values,
2 - forecasted means, AL - forecasted alert levels
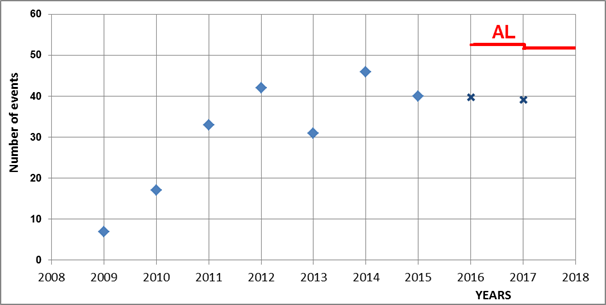
Fig. 8. Changes in number of events
in the LASER category in Poland
(AL - forecasted alert levels)
4. SUMMARY
The results of our proposed method
for events analysis may provide assistance to the civil aviation
regulatory authorities in the implementation of state safety programmes and
safety management systems in aviation organizations, as required by the EU.
It should be clarified whether the
steadily increase in W1000 coefficients is due to aviation safety
deterioration, as well as whether there has been any increase in employee
awareness concerning the importance of events reporting.
The small number of reported events
associated with MTOM <5,700 kg category aircraft is evidence of a
Signiant levels restraint in such reporting. Perhaps action is needed
to raise awareness of the importance of reporting events for safety improvements.
In most cases, the actual number of
events does not exceed the alert levels determined by the presented
method. On this basis, it can be stated that these levels were exceeded most
often for events in the BIRD, MAC and RAMP categories in 2014.
It seems that events involving the
LASER category are gradually disappearing, possibly because of changing
“fashion” or an increased awareness that this is a serious offence.
There is a need to develop models to
address the fact that, according to civil aviation authority inspection reports
in the ACAM database and reported events in ECCAIRS, there is no compliance
with existing rules in aviation organizations. This could inform the direction
of further research in this area.
References
1.
ICAO. 2013. Aviation Occurrence Categories, Definitions and Usage
Notes (4.6).
Montreal: Common Taxonomy
Team, ICAO.
2.
Civil Aviation
Authority. “Statistics”. Available at: http://www.ULC.gov/pl/regulacja-rynku/3724-statystyki-wg-portow-lotniczych.
3.
Coppola Anthony.
1999. Practical Statistical Tools for the
Reliability Engineer. Rome, NY: Reliability Analysis Centre.
4.
European
Aviation Safety Agency. 2015. Annual Safety Review 2014. Cologne: Safety Intelligence &
Performance Department, European Aviation Safety
Agency.
Received 17.11.2016;
accepted in revised form 12.01.2017
![]()
Scientific Journal of Silesian University of
Technology. Series Transport is licensed under a Creative Commons
Attribution 4.0 International License