Article citation information:
Majewski, P., Spychała, J., Żokowski, M. Some problems with
vibroacoustic method in relation to the transmission gearbox of a military
helicopter. Scientific Journal of the
Silesian University of Technology. Series Transport. 2016, 93, 79-90. ISSN: 0209-3324.
DOI: https://doi.org/10.20858/sjsutst.2016.93.9.
Paweł MAJEWSKI[1],
Jarosław SPYCHAŁA[2],
Mariusz ŻOKOWSKI[3]
SOME PROBLEMS WITH
VIBROACOUSTIC METHOD IN RELATION TO THE TRANSMISSION GEARBOX OF A MILITARY
HELICOPTER
Summary. The
article presents the results of a laboratory gear stage with regard to
deepening its consumption. In addition, the study looked at the construction of
the transmission gearbox of a military helicopter, according to the basic
kinematic results of the analysis of vibroacoustic signals, in order to
determine the diagnostic criteria for the assessment of the technical
condition of a military helicopter’s transmission gearbox.
Keywords: transmission gear, vibroacoustics,
gearbox, helicopter
1. INTRODUCTION
The issue of monitoring and diagnosing the
technical condition of machines, as well as detecting the damage and wear of
their components, is a subject of interest to all personnel performing
operational maintenance duties. This is for the following reasons: safety,
economy and time. However, the methods and measures used, which take the form
of implemented control measurement systems, along with the defined current
services are not always adequate, such that these machines are often damaged.
This is a problem faced by the aviation
engineering services of the Polish Armed Forces, which operate combat
helicopters, including their main transmissions. In the main, the only aspect
of the transmission gear of a helicopter that is constantly monitored is the value
relating to temperature and oil pressure, as well as the rotational speed of
the input shaft. Although magnetic plugs in transmission gear trap the products
that cause wear and tear in the lube oil, there is no system to monitor
its vibrations. Additionally, the evaluation of the main transmission
gear’s technical condition is carried out periodically, during planned
maintenance works. Despite the above-mentioned measures, damage still occurs,
which is why the Air Force Technical Institute has attempted to determine the
possibilities of using the vibroacoustic method to evaluate the technical
condition of the main transmission gear of a combat helicopter under conditions
as discussed below.
The literature presents many methods for
diagnosing transmissions on the basis of the analysis of the vibroacoustic
signal measured with the housing of the gear. The existing methods were
classified into four groups: time domain analyses, frequency domain analyses,
time-frequency analyses and others [1-4]. The aforementioned methods are based
on known symptoms of damage to rolling bearings and gear wheel transmission.
2. GENERAL CHARACTERISTICS OF THE TEST OBJECT
The test object is the main
transmission located on board the helicopter, as shown in Figure 1, with a schematic
diagram presented in Figure 2.
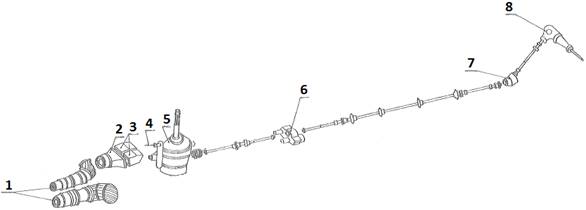
Fig. 1. View of the transmission’s
location in relation to the basic sub-assemblies of the helicopter
(1 = engines, 2 = fan, 3 = oil
cooler, 4 = fan drive shaft, 5 = main transmission gear, 6 = drive box, 7 = intermediate
transmission, 8 = rear transmission)
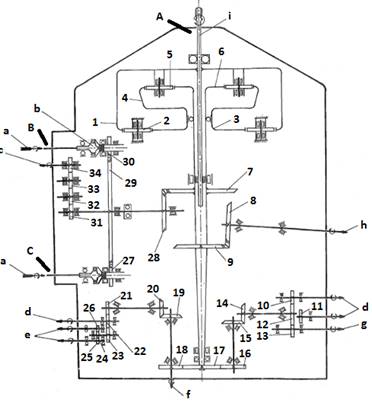
Fig. 2. Kinematics of the main
transmission
The design of the transmission and
its location on the helicopter causes the occurrence of a series of
extortions, which appear in the vibroacoustic signal. First of all, the
transmission is powered by two turbine engines, through an idle run clutch (b)
and an axle shaft (a). In the engine, apart from a series of
mechanical generators coupled with it, the most important elements are the
power turbine, generating useful power for the gear, and the turbocharger
rotor, which is not coupled kinematically with the engine. Secondly, the
transmission of the torque onto the rotor shaft (i), coming from the
propulsion turbine, takes places in the course of three stages of the
transmission gear. The first stage of the gear transmits rotations from two
engines through the idle run clutch and cogwheels 27 and 30 onto cogwheel 29
with helical wheels. The second gear stage consists of two bevel gear wheels 28
and 7 with spiral teeth. The third stage is a closed planetary-differential
gear with cogwheels 1, 2, 3, 4, 5 and 6. Sprocket 6, located on one shaft with
conical sprocket 7, is a drive wheel (sun wheel) of the transmission gear.
Sprockets 5, comprising five pieces, are satellites of the planetary gear.
The satellite yoke creates one whole with powered sprocket 1 and is connected
with the rotor shaft. Sprockets 2, comprising seven pieces, are transitional
wheels, which close the system. The body of these wheels is stationary.
Thirdly, the propulsion from the transmission is transferred onto one more
series of receiving generators, including the tail propeller and the gearbox
generators. Transmission of the drive to the tail propeller (h) is achieved
through the first and second stages of the gearbox, which is common for the
carrier rotor, and through an additional stage, which increases the rotational
speed, consisting of two conical gears, 9 and 8, with spiral teeth. Drives of
the main gearbox generators are directed to the front, left and right sides of
the gearbox body. To the front side, the fan drive is directed (c) from
sprocket 29, through 31, 32, 33 and 340. To the left side, drives of the
carrier rotor rotational speed accelerator (e) and the hydraulic pump (d) are directed
through sprockets 19 and 20 and cylindrical sprockets 21÷26. To the right side,
the drives of two hydraulic pumps (d) and the compressor (g) are directed
through sprockets 17 and 16, conical sprockets 15 and 14 and cylindrical
sprockets 10÷13. Apart from the assemblies of the above-mentioned toothed
kinetic pairs, there are also a number of bearings.
For such complex kinematics, the
relations describing characteristic frequencies are presented below:
-
rotational frequency of the turbocharger fTS (100% rotations
corresponds to 19,500 rpm)
![]() (1)
(1)
-
rotational frequency of the turbocharger fTN (100% rotations
corresponds to 15,000 rpm)
![]() (2)
(2)
-
characteristic frequencies for gears with fixed axes; for sprockets 7 to
34, for example, with a pair of teeth z30 and z29, the
relation is as follows:
![]() (3)
(3)
-
gearing frequency
![]() (4)
(4)
-
frequency of sidebands (similarly for other frequencies)
![]() (5)
(5)
-
frequency of carrier rotor blade passing (k = blade number, five pieces)
![]() (6)
(6)
Sprockets z1 to z6
form a planetary gear, with a layout as shown in Figure 3.
OUT IN
Fig. 3. Planetary gear
layout
The planetary gear has w degrees of freedom:
![]() (7)
(7)
where:
n = number of mobile links,
p = number of rotational links,
k = mesh number.
The rotational frequencies of the
planetary gear assembly are determined according to the relations:
![]() (8)
(8)
![]() (9)
(9)
![]() (10)
(10)
![]() (11)
(11)
Rotational frequency values for
rated operating conditions are summarized in Table 1, which, with the knowledge
of the number of gear teeth and appropriate bearing parameters, enabled the
determination of the remaining characteristic frequencies associated with
symptoms of bearing [6] and transmission gear [7] damage.
Table 1.
Values of the rotational frequencies
of the main transmission gear, propulsion unit and the rotor
|
Designation |
Value [Hz] |
Designation |
Value [Hz] |
|
fTS |
325 |
f16 |
49.3 |
|
fTN |
250 |
f15 |
49.3 |
|
fŁ |
20 |
f14 |
59.6 |
|
f30 |
250 |
f13 |
33.5 |
|
f29 |
86.8 |
f12 |
59.6 |
|
f28 |
86.8 |
f11 |
40.6 |
|
f27 |
250 |
f10 |
40.6 |
|
f26 |
39.7 |
f9 |
40.8 |
|
f25 |
39.7 |
f8 |
53.9 |
|
f24 |
39.7 |
f7 |
40.8 |
|
f23 |
39.7 |
f6 |
40.8 |
|
f22 |
40.6 |
f5 |
1.5 |
|
f21 |
59.6 |
f4 |
-8.8* |
|
f20 |
59.6 |
f3 |
-8.8* |
|
f19 |
49.3 |
f2 |
-14.6* |
|
f18 |
49.3 |
f1 |
4 |
|
f17 |
40.8 |
*opposite direction |
|
3. LABORATORY TESTS OF A DOUBLE REDUCTION GEAR
WHEEL TRANSMISSION
Planned vibration measurements of
the helicopter’s main transmission were to be carried out without the signal
informing about the momentary rotational speed, thus limiting the possibility
of applying certain algorithms, e.g., time synchronous averaging. A prepared
laboratory bench without the phase marker was designed to validate the applied
algorithms for the evaluation of a combat helicopter’s technical condition. The
expected results concerned the information about the general level of
vibrations and the possibility to detect damage to the bearings and the teeth
of the transmission.
The gear wheel transmission, as
presented in Figure 4, was tested.
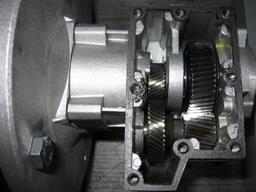
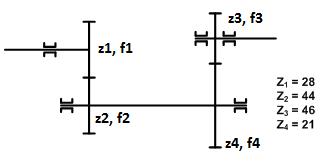
Fig. 4. View of the tested
transmission and its kinetic diagram
On implementing, in three subsequent
stages, a deepening damage to tooth z3 (Fig. 5), with stable ranges
of the rotational speed, gearbox body vibrations were measured in three,
mutually perpendicular, directions and later related to the condition without
the damage.
dam3: deeper grinding of
the tooth planes, with a chipping at a length up to 4 mm dam2: slight grinding of
the opposite plane of the tooth dam1: slight grinding of
one plane of the tooth OK – teeth without damage
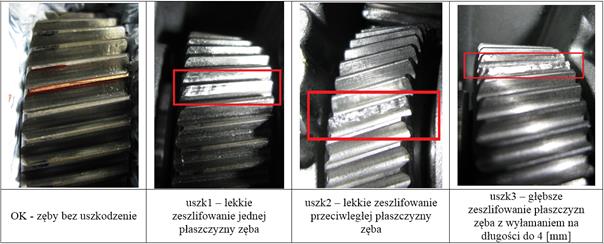
Fig. 5. View of subsequent damage
stages of sprocket z3
After that, a number of analyses in
the time and frequency domains were carried out.
In the time domain, in the band 10 Hz÷10 kHz, values were determined for
effective vibration speed V, kurtosis K, peak factor CF and signal power P, as
presented in Figure 6.
|
channel0 – axis x
channel1-axis Y channel2 –
axis Z OK dam1 dam2 dam3 |
channel0 – axis x
channel1-axis Y channel2 –
axis Z ok dam1 dam2 dam3 |
||||||||
|
channel0 – axis x
channel1-axis Y channel2 –
axis Z ok dam1 dam2 dam3 |
channel0 – axis x
channel1-axis Y channel2 –
axis Z ok dam1 dam2 dam3 |
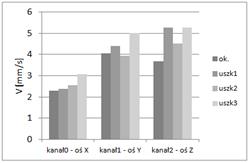
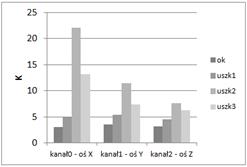
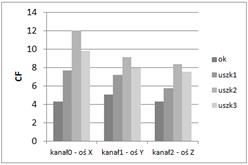
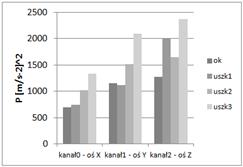
Fig. 6. Results of time domain
analyses
In the frequency domain, amplitudes
of individual harmonics, resulting from the kinematics of the tested
transmission, and a spectrum of the envelope signal were determined (envelope
narrowband analysis method with the use of Hilbert’s transformation; see Fig.
7).
The increase in transmission damage
causes an increase in the analysis parameters in the time domain.
Narrowband envelope analysis allowed the determination of modulating
frequencies, including, for the condition without damage (marked OK), frequency
f1=67 Hz and the number of its times, while, for damage conditions,
bearing information about gearing z3 with frequency f3=19Hz
and the number of its times. Frequency amplitude f3 increased along
with the damage. However, one inconvenience is the fact that it is a rotational
frequency, which also carries information about imbalance. It was assumed that
damage to therolling bearings on a lab bench and on an actual, technical object
was detectable using this method.
|
|
|
|
|
|
|
|
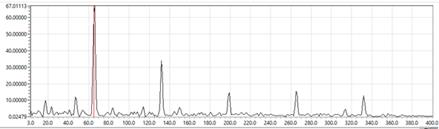
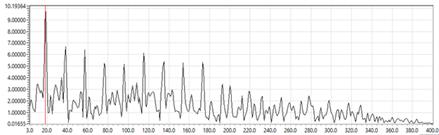
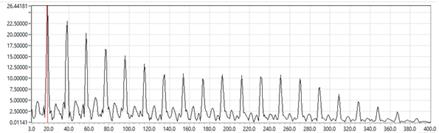
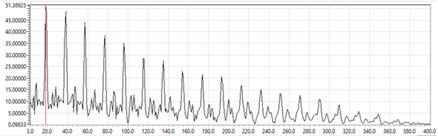
Fig. 7. Frequency
domain analyses results: envelope spectrum
4. TESTS OF THE MAIN TRANSMISSION
GEAR OF THE HELICOPTER
The measurements of the main
transmission body vibrations were taken during the on-ground test of the
helicopter, at set and temporary ranges, which changed the speed of the propulsion
units to the maximum acceptable (hovering of the helicopter). A sample profile,
determined on the basis of parameters recorded by the on-board recorder,
including rotational speed values of the left (NSL) and right (NSP) engine
turbochargers and the rotor (NR), is presented in Figure 8.
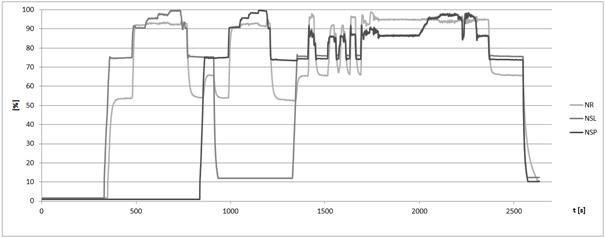
Fig. 8. Profile of the on-ground
helicopter test
Due to structural reasons
(non-magnetic body, no process openings, no planes with the possibility to
use adhesive sensors) and safety reasons, there was a limitation in terms of
the possibility to install sensors, which can measure temporary vibrations of
the transmission’s body. For this reason, accelerometers were fixed (Fig.
2) at measurement points: A (bonding method) - three remaining, perpendicular
directions, marked WNX, WNY and WNZ; and B, C (with the permanent magnet) -
vertical direction marked with LSZ and PSZ. Information about the current rotational
speed was initially determined from the test sheets and data indexing,
corrected with values from Figure 8 and determined by the vibration signal
spectrum. As in the scope of laboratory tests, a number of analyses in the time
and frequency domains were carried out. In the time domain, i.e., in the band
45÷1,590 Hz, 25÷10 kHz, 190÷340 Hz, 2 Hz÷10 kHz (see Fig. 9), the
effective vibration speed V values and its maximum values were determined for
the whole sample.
Time [s] Time [s] Time [s] Time [s] Time [s]
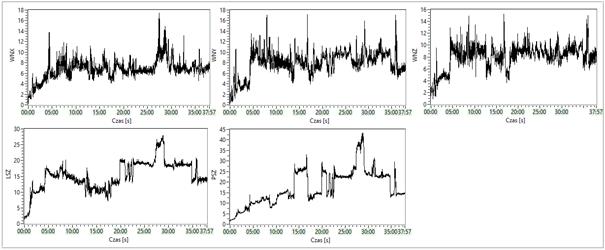
Fig. 9. Course of changes of the
effective vibration speed in the band 2 Hz÷10 kHz
Peak vibration speed values at
particular points for individual bands are presented in Figure 10. These values
are related to the assumed limit values. Points B (vertical axis marked LSZ)
and C (vertical axis marked PSZ) are defined by the producer for the propulsion
unit (being 45 mm/s → warning value and 60 mm/s → limit value).
Point A (directions WNX, WNY and WNZ) is defined by the standard [8]. Only in
the band 2 Hz÷10 kHz, at point A, was the assumed limit value found to be
exceeded.
band band band band
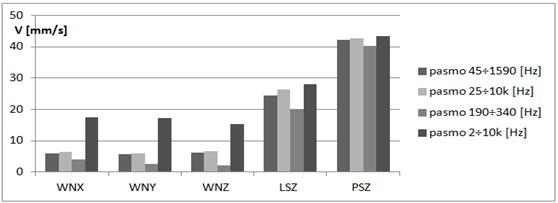
Fig. 10. Peak vibration speed values
at particular points for individual bands
In the time domain were determined
the kurtosis K value (Fig. 11), the CF peak factor and signal power P, within
stable ranges of the operation of the left or right engine and two at the same
time.
hovering starting, starting,
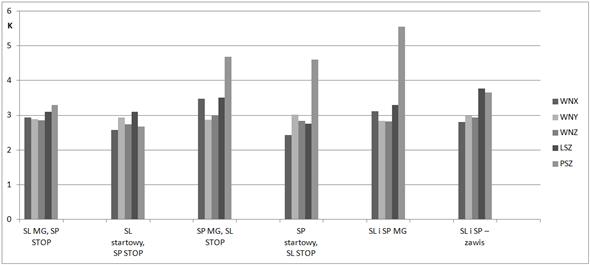
Fig. 11. Kurtosis value for
individual directions in stable ranges of the rotational speed
The above analyses and a number of
others from the scope of the time domain, due to the lack of explicit
levels determining the acceptable limit values, were treated as informational
and a reference for comparison in the case of extending the population of
studied objects.
In order to detect damage to the
bearings and transmission wheels, envelope spectrum analysis was used
(narrowband envelope analysis method). Frequencies were found in this spectrum,
which correspond to the kinematic calculations, part of which were not linked
to the identified kinetics of the studied transmission gear (Fig. 12).
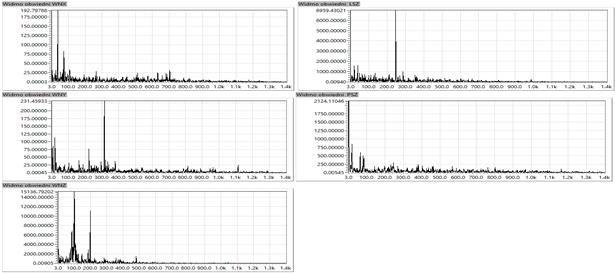
Fig.12. Envelope spectrum (left
engine starting, right engine off)
5. CONCLUSION
The use of vibroacoustic testing to
assess the technical condition of the transmission is an issue widely discussed
in the literature. A number of methods to process a measured signal, with
different efficiency, has been developed. There are also certain requirements,
which need to be satisfied, e.g., correct parameters describing the tested
kinematics, allowing for the determination of characteristic frequencies
and the appropriate number of sensors located in the correct places. Due to
operational limitations and a given technical object, it was impossible to use
the phase marker, because, having the reference signal, it was possible to use
other damage detection algorithms.
The results presented above
regarding studies associated with the diagnostics of the main transmission of a
helicopter might indicate a potential for monitoring its sub-assemblies with
the vibroacoustic method. However, we need to expand the population of objects
and verify the parameters describing the kinematics, thereby enabling
characteristic frequencies to be determined.
References
1.
Paul Samuel, Darryll Pines. 2005. “A review of vibration-based
techniques for helicopter transmission diagnostics”. Journal of Sound and Vibration 282: 475-508.
2.
Lei Yaguo, Jing Lin, Ming Zuo, Zhengija He. 2014. “Condition monitoring
and fault diagnosis of planetary gearboxes: a review”. Measurement 48: 292-305.
3.
Aherwar Amit, Saifullah Khalid. 2012. “Vibration analysis techniques for
gearbox diagnostic”. International
Journal of Advanced Engineering Technology 3(2).
ISSN: 0976-3945.
4.
Randall Robert, Antoni Jerome. 2011. “Rolling element bearing
diagnostics – a tutorial”. Mechanical
Systems and Signal Processing 25: 485-520.
5.
Randall Robert. 2011. Vibration-based
Condition Monitoring: Industrial, Aerospace and Automotive Applications.
Chichester: Wiley. ISBN: 978-0-470-74785-8.
6.
Cempel Czesław. 1982. Podstawy wibroakustycznej diagnostyki
maszyn. [In Polish:
Fundamentals of Vibroacoustic Diagnostics
of Machines].Warsaw: WNT.
7.
Bartelmus Walter, Zimroz Radosław. 2011. “Vibration spectra
characteristic frequencies for condition monitoring of mining machinery
compound and complex gearboxes”. Prace
Naukowe Instytutu Górnictwa Politechniki Wrocławskiej 133.
8.
Polski Komitet Normalizacyjny.
1996. Polska Norma PN-ISO 8579-2:
Przepisy Odbioru Przekładni Zębatych. Określanie Drgań Mechanicznych Przekładni
Zębatych Podczas Badań Odbiorczych. [In Polish: PN-ISO
8579-2: Provisions Concerning the Determination of Mechanical Vibrations
of Gears During Acceptance Testing] Warsaw: Polski Komitet Normalizacyjny.
Received 07.06.2016; accepted in
revised form 02.10.2016
![]()
Scientific Journal of the Silesian
University of Technology. Series Transport is licensed under a Creative
Commons Attribution 4.0 International