Article citation information:
Nosal, K., Duda, U. Selected aspect of the implementation of active
marketing campaign to raise awareness and promote of public transport services
in rural areas. Scientific Journal of
Silesian University of Technology. Series Transport. 2016, 92,
77-86. ISSN: 0209-3324.
DOI: 10.20858/sjsutst.2016.92.8.
Katarzyna NOSAL[1], Urszula DUDA[2]
SELECTED ASPECTS OF THE
IMPLEMENTATION OF ACTIVE MARKETING CAMPAIGN TO RAISE AWARENESS AND PROMOTE
PUBLIC TRANSPORT SERVICES IN RURAL AREAS
Summary. The
article presents selected aspects of the implementation of the EU’s SmartMove project, which aims to promote feeder public
transport systems in rural areas through the implementation of an active
marketing campaign (AMC). Campaigns of this type are connected with providing
general and personalized information concerning the functioning of public
transport services. In the article, characteristics of one of the
implementation areas of the project are presented, namely, the Liszki district near Cracow. Transport services were also
evaluated. In addition, selected results are presented from a survey that
was conducted among residents of the area from the point of view of the
implementation of the AMC. The results concerned data about the means of
transport that were currently used for travelling, the knowledge of bus
services, the reasons for their use and the factors that might encourage
residents to use public transport.
Keywords:
public transport; feeder system; rural areas; active marketing campaign;
personalized information.
1. INTRODUCTION
Suburban areas are usually
characterized by low density in terms of the public transport network and low
travel frequency, resulting from a relatively high dispersion of settlement
structures [1]. However, in places with an attractive public transport offer,
it is often not perceived by residents as an attractive and competitive one,
when compared to a private car. Changing the perception of public transport and
increasing its share in travel within less urbanized areas are possible by
using relatively simple methods related to the provision of information,
promotion and improvement of the quality of services [2]. Examples of solutions
that aim to improve the attractiveness of the transport system in peripheral
areas may include the following: organization of flexible bus lines,
application of measures for the improvement of the functioning of conventional
bus lines, organization of bicycle rental service systems, improved pedestrian
access to bus stops, provision of “park and ride” (P&R)
and “bike and ride” (B&R) parking interchanges,
or car-sharing and car-pooling schemes [1, 3, 4, 5].
In turn, an innovative activity that
aims to providing information and promote sustainable mobility is the
organization of a so-called AMC [6]. An AMC is a direct marketing campaign
through which current and the potential passengers are informed about the
possibility of travelling via various communication channels (leaflets,
brochures, websites, mobile applications, information in the mass media etc.).
Parallel to traditional information activities, interaction with users is
ensured through the organization of meetings and events, as well as personal
advice given by so-called mobility consultants. These actions effectively enhance
the effectiveness of measures that increase the attractiveness of the transport
system [7, 8]. They also increase the acceptance of the means of public
transport, by providing information about the possibilities of making choices
in the process of planning a trip, which leads to increasing the number of
people who give up car journeys [9].
An integral part of the campaign is
to provide so-called active measures concerning, for example, the arrangement
of guided bicycle tours, walking for health, discussion groups for the
involvement of residents, events that promote bus transport on demand, and
audits of the infrastructure for pedestrians and cyclists [6]. In
addition, people can experience bus journey trials, while the elderly are
offered assistance when they travel within the major interchange points. Active
measures are closely related to the promoted means of transport and are
complementary to information and consulting activities.
Measures undertaken to promote
public transport in rural areas, which are focused in particular on increasing
the number of users of the “feeder systems” [10] (e.g., the suburban bus lines
that drop off passengers at tram lines), are implemented in line with the
framework of the EU’s SmartMove project. The project
is being implemented in eight European regions that have prepared and conducted
local AMC campaigns, as well as evaluated them. One of the areas of
implementation is the Liszki district, which is a
Cracow suburb. A team from the Cracow University of Technology is
responsible for the implementation of the solutions, which foster the mobility
of the residents of the Liszki district. The article
presents the profile of this area, as well as the results of a survey, which
was conducted among the residents from the perspective of the implementation of
the AMC campaign, forming a part of the activities implemented as part of its
scope.
2. TARGET GROUP AND IMPLEMENTATION OF DIRECTORY
AREA CHARACTERISTICS
The Liszki
district is located on the western side of the city of Cracow and consists of a few
villages with approximately 16,700 inhabitants. The implementation area also
includes a transportation corridor connecting the western part of Cracow with
the territory of the Liszki district (Road 780). The
analysed area is marked in grey in Figure 1.
According to data from the
Statistical Office in Cracow [11], in 2014, the Liszki
district was inhabited by 8,528 women and 8,189 men. The vast majority of
inhabitants are aged between 15 and 59 years. As these people mostly study or
work in Cracow, they travel to the city every day, in many cases using a
car, thereby causing traffic congestion. They are the main target group
for the SmartMove project. Some AMC activities are
also directed at primary and secondary school pupils, given that mobility
education at school age influences the future decisions made by young road
users. Children also often share interesting ideas heard in school with their
parents and suggest solutions concerning the selection of transport mode.
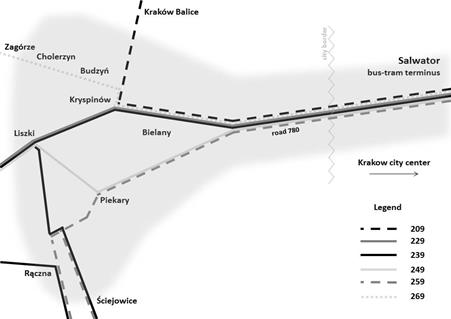
Fig. 1. SmartMove
implementation area in Cracow and the bus network
In the analysed area, there are 10
bus lines. However, six of these lines are the most important ones, which
could be used by the target groups: namely, 209, 229, 239, 249, 259 and 269.
All routes end at the Salwator bus terminus, which is
located at the beginning of the analysed transportation corridor (Fig. 1).
Salwator tram terminus is located next to the bus
terminus. As all tram lines go the city centre of Cracow, Salwator
is an interchange point, where commuters from the Liszki
district can change from a bus to a tram in order to get to Cracow city centre.
Bus lines constitute a feeder system for the tram lines. An increase in the use
of bus transport will translate into an increase in the number of passengers
along the tram lines connecting western areas of Cracow with the city centre.
Unfortunately, the bus system in the area faces several problems. One of them
relates to poor frequency of buses. On weekdays, the average frequency
along bus lines is one to two buses per hour at peak hours and one per hour
during the off-peak period. The greatest number of vehicle trips per day on
weekdays is carried out along the 229 and 249 routes (27 vehicle trips). The
greatest number of vehicle trips per day on Saturdays and Sundays is performed
along the 239 and 249 routes (14 vehicle trips).
There are around 98 stops along the
analysed corridor [13]. Only 38% of stops are roofed, while more than half of
the stops do not have shelters, causing a lack of comfort among the passengers
waiting for a vehicle in bad weather conditions, which may discourage them from
travelling by bus. Meanwhile, 67% of stops are well lit, which has a
significant impact on the safety and security of the passengers. Although 81%
of bus stops are paved, the pavement is very often narrow and has an
uneven surface. In many cases, the pavement is only provided at the stop area,
assuring no direct connection with the rest of the street, which means that
there is no possibility of safely getting to it. Only 47% of stops have a bus
bay, which causes temporary traffic congestion on busy streets, as well as a
decrease in the safety of passengers and vehicles. The number of stops with
seats is quite low (only 39% of stops have seats). Although 98% of bus stops
are equipped with information on timetables, only one offers real-time
information. Maps are available at only 8% of stops, while only 3% of bus stops
have and ticket machines.
Stops along bus lines are served by
standard low-floor vehicles (12 m in length) and equipped with information
about passenger rights, tariffs, bus routes etc. It is also worth mentioning
that passengers who use the Salwator terminus have
the option of changing from a bus to a bicycle (a bicycle rental station
is located at the Cracow terminus).
In terms of the data related to car
usage in the analysed area, the car ownership rate is equal to 344 cars per
1,000 inhabitants. The average length of a car trip in the analysed area is 7.6
km, but it is 13.4 km on the route from that area to Cracow. The average car
trip lasts 26 min. Average fuel consumption per car is 5.9 l/km and an
average CO2 emission per car equals 0.14 g/km.
3. GETTING IN CONTACT WITH INHABITANTS
The first step in implementing an
AMC in the Liszki district was to look for support
from relevant stakeholders, such as local authorities, the church, religious
communities and schools. Their representatives were contacted by telephone.
Meetings were then organized with them, after which they received announcement
letters with relevant information about the goals and the scope of the AMC, as
well as a request to support the campaign (by distributing information
about it). They were very supportive and passed on the information during
mass in churches and classes at schools, as well as placed it on the local
community website. Following this general contact phase, the SmartMove team started a face-to-face contact phase, which
meant that the inhabitants were visited in their homes (June-August 2015). The
team obtained general information about the transport operation (brochures
about local transport with a map of the corresponding bus network, information
about ticket prices, the ways to buy tickets, bicycle traffic and pathways
etc.). Inhabitants were informed about the AMC, additional active measures and
the possibility of receiving personalized information (e.g., personalized
timetables). Those who were interested in receiving individual information were
asked to fill in an order form and set the date for the delivery of
materials.
The ex ante
evaluation questionnaire was carried out at the same time. People were asked
about their travel behaviours and preferences, as well as about the factors
that encourage them to use public transport. Staff who carried out the survey
knocked on 1,920 doors, although the final research result was 508
surveys, which shows an efficiency rate of 25%. One person per household was
interviewed. Taking into account the total number of households in the area
(4,000 households), 13% of them were interviewed. The most important results of
the questionnaire are presented below.
4. SELECTED RESULTS OF THE RESEARCH
QUESTIONNAIRE
Concerning the modal split in
non-pedestrian trips of the inhabitants, a significant percentage of the trips
are made using public transport (47%) and by car (40% as a driver and 8% as a
passenger). Only 4% of trips are undertaken by bicycle, with the rest by
motorcycle. The respondents make, on average, 2.37 trips per 24 h.
Taking into consideration the most
important bus lines, the most recognizable line is number 249. It is known by
almost two thirds of Liszki district residents (65%).
Approximately half of the people are familiar with the following lines: 239
(48%), 229 (45%) and 259 (40%). Definitely the smallest number of people are
familiar with lines 269 (27%) and 209 (23%). Every 10th resident knows nothing
about these public transport lines. There is a significant group among the
inhabitants who use public transport more than once a week (Fig. 2).
Fig. 2. Usage of at least one of the bus
routes
This frequency was indicated by 40%
of the respondents. At the same time, half of the population never use
public transport or do so less than once a month. These results show that it is
necessary to inform people about the public transport offer, as well as
implement solutions that will encourage them to use these services.
The main reason to use public
transport is no access to a car. This is the reason given by half of the people
using it. It is a clear signal that some activities have to be undertaken in
order to prevent car purchases, such as information and educational activities
raising travel awareness, measures to improve bus services and investments in
the public transport infrastructure. Other important reasons include the
proximity of a bus stop, access to direct connections and the ability to save
money, either due to cheap season tickets or due to the lack of the
necessity to pay parking fees in the city centre.
Public transport passengers were
asked to give certain quality indicators regarding bus services, using a scale
from 1 to 10, where 1 = very bad and 10 = very good. The most important
advantages of the public transport included a high security level (8.8) and the distance
to the nearest bus stops (8.7). The quality of passenger information (8.1),
punctuality (8.1) and regularity (8.0) were also highly rated. On the other
hand, among the factors that require definite improvement are travel
comfort (6.6) and the frequency of buses (4.6). These findings correspond with
the opinions of the passengers about the elements of the service that should be
improved (Fig. 3), where frequency received the highest number of responses. In
terms of travel comfort, the passengers stated that they would like to have
more seats at their disposal (57% of responses). Other elements that require
improving concern the higher number of direct connections (40%) and longer bus
operation hours in the evening time (32%).
Fig. 3. Ways to improve public transport
(PT) services (the opinion of people currently using it)
The main reasons behind not using
public transport are comfort and speed. In the opinion of the residents who do
not use public transport, a car is still much faster and more comfortable than
a bus. At the same time, nothing could encourage half of the people that do not
use public transport to change their mind. Residents who would be willing to change
their habits could be convinced by an increase in the frequency of the
operation, the reduction of ticket prices and the implementation of a P&R scheme (Fig. 4).
Respondents were also asked if they
used any Internet tools when planning a trip (on a personal computer,
tablet or smartphone): 46% of them use them and 54% do not. These results prove
that informational and promotional activities should also be implemented in
order to make people more familiar with the Internet-based journey planning solutions.
Fig. 4. Factors that could encourage new
users to use the public transport (PT) service (the opinion of the people
not currently using it)
An important part of the AMC
campaign is the distribution of personalized information made in response to
the residents’ demands, i.e., tailored to their special needs. While the research
questionnaire was being carried out, the residents could order personalized
information and gifts (the concept of an AMC assumes the distribution of small
thank-you gifts among people who are interested in participating in it). The
giveaways can include pocket torches, USB sticks and umbrellas. Inhabitants
could order the following personalized information: personal timetable for a
specific bus stop and a map of the public transport stops in the surrounding
area. An interesting offer was prepared for students (information on ticketing
discounts, bicycle traffic and journey planning tools) and for older people
(information on ticketing discounts, the use of ticket machines and exercises
that can increase body fitness). It was also possible to order a comparison of
time, cost and CO2 emissions for trips made by public transport and
by car. Time (including all relevant elements, such as access time to bus stops
or parking spots, waiting times, ride times and access times to specific
destination) and cost were presented as daily, monthly, weekly and yearly
expenses, including all relevant costs of bus and car use.
In total, 379 people ordered the personalized
information and the thank-you gifts. Meanwhile, as the transport offer was
slightly changed, all 508 inhabitants who were interviewed received a package
with updated information. A map of the area with the location of stops and a
personalized timetable were the most preferred kinds of information. This meant
that such information had previously been unavailable or people had organized
their own personalized map and a timetable. The most ordered gadgets were USB
sticks, which was quite predictable since it is an attractive gadget. Taking
into account the type of information and the age of residents, one can see that
timetables, maps and data comparisons were mostly needed by people aged between
31 and 60 years, i.e., those of working age (Fig. 5).
Fig. 5. Type of personalized information
ordered by particular age groups
Information for students was ordered
by residents of student age (18-30 years old), but also by these who probably
had intentions of going to study (younger than 18 years old) and by the students’
parents. Given that, in many cases, families who live in the Polish households
in the rural areas are multigenerational, the fact that information for seniors
was demanded not only by older people, but also by their grown children, is not
surprising. According to the type of personalized information ordered by
particular groups of public transport users and non-users, it is easy to notice
that timetables, maps, data comparison and information for seniors were
requested by people currently travelling by bus at different frequencies as
well as by those who do not use buses (Fig. 6).
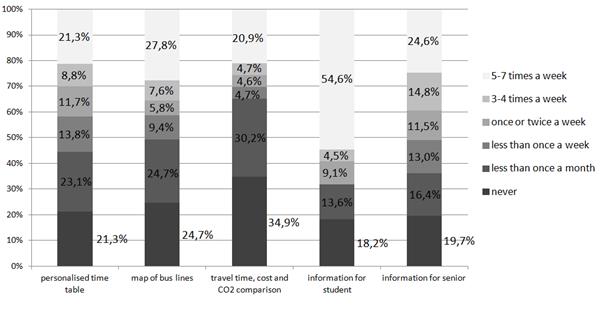
Fig. 6. Type of personalized information
ordered by particular groups of public transport users and non-users
These findings show that public
transport users would like to be updated with information even if they already
know how to use the service. What is very important is that 65% of people who
requested information on travel time, cost and CO2 comparisons are
the residents who travel by bus less than once a month, or even never. Maybe
this information will increase their awareness, especially in terms of the
price they have to pay to travel by car, such that they will be willing to use
a cheaper mode of transport, i.e., a bus. The rather high level of demand for
information for students among these who already travel by bus five to seven
times a week probably results from the fact that, because a significant
percentage of students use public transport every day in any case, they are
more likely to want updated information.
5. SUMMARY
The Cracow suburb chosen for the
implementation of the AMC campaign faces many problems, which discourage
residents from using bus travel services. Among the most important ones, the
frequency of operation and the poor condition of bus stop infrastructure should
be underlined (no roof, seats etc.). This condition is reflected in
communication behaviours of those residents who do not use public transport,
preferring instead to use individual transport that guarantees them more
comfort and a faster travel time. Of the respondents, 50% do not use
public transport, while only 16% of them use a bus five times per week. Factors
that could encourage drivers to give up the car and use a bus include higher
travelling frequency, cheaper tickets, more direct connections and P&R facilities.
Those implementing the SmartMove project hope that, despite the above-mentioned
weaknesses of the system, the information and publicity activities undertaken
will help build a positive image of public transport and will increase
transport awareness, which could be the first step in the process of a
change in travel behaviour. The results of the survey indicate that there is a
demand for access to data about the functioning of services. Nearly 400 people
asked for personalized information. Making this information available will
allow them to become familiar with the public transport offer and its
advantages (e.g., lower travel costs), as well as help to retain existing
and attract new users.
It is important to mention that the
ordered personalized information was distributed between August and October
2015) and the effectiveness of this activity was additionally enhanced by the
implementation of the following accompanying active measures: organizing
meetings with students of primary and secondary schools to increase their
transport awareness (involving a total of approximately 180 students and 12
teachers), public transport promotion during a family festival at one of the
primary schools (approximately 200 to 220 participants, about half of whom were
adults), and distribution of information about journey planning tools among
church communities.
The SmartMove
team is also planning to organize a citizens’ audit to obtain information about
the quality of bus stops and pedestrian infrastructure from the users’ point of
view. A report on the necessary improvements will be written and provided
to the authorities that manage transport infrastructure. This will help to
improve the public transport service and pedestrian traffic in the future.
Currently (i.e., as of February 2016), the ex-post evaluation research is being
carried out to assess the results of the AMC campaign.
References
1.
Moseley Malcolm. 1979. Accessibility:
The Rural Challenge. London: Methuen and Company Limited. ISSN:
0416-712304.
2.
Gronau Werner, Andreas Kagermeier.
2004. “Mobility management outside metropolitan areas: case study from North
Rhine-Westphalia”. Journal of Transport Geography
12 (4): 315-322. ISSN 0966-6923.
3.
Starkey Paul. 2002.
Improving Rural Mobility: Options for
Developing Motorized and Nonmotorized Transport in
Rural Areas. World Bank Publications. ISSN 0253-7494.
4.
Brake Jenny,
Corinne Mulley, John Nelson. 2006. Good
Practice for Demand Responsive Transport Services Using Telematics.
Newcastle upon Tyne: University of Newcastle upon Tyne. ISBN 0-7017-0209-5.
5.
Hosen
Kenneth, Bennett Powell. 2011. TCRP SYNTHESIS 94. Innovative Rural
Transit Services. A Synthesis of Transit Practice. Transit Cooperative Research
Program. Washington: Transportation Research Board.
6.
BOKU Institute for Transport Studies. 2011. Active Mobility Consultancy for the Waldviertel-Line. Research project funded by the
Federal State Government of Lower Austria.
7.
Fujii Satoshi, Taniguchi Ayako. 2005. “Travel
feedback programs: communicative mobility management measures for changing
travel behavior”. Proceedings
of the Eastern Asia Society for Transportation Studies 5: 2320-2329.
ISSN 1881-1132.
8.
Fujii Satoshi, Taniguchi Ayako. 2006.
“Determinants of the effectiveness of travel feedback programs: a review of
communicative management measures for changing travel behavior
in Japan”. Transport Policy 13:
339-48. ISSN 0967-070X.
9.
Cairns Sally, Lynn Sloman, Carey Newson, Jillian Anable,
Alistair Kirkbride, Phil Goodwin. 2004. “Smarter
choices: changing the way we travel”. Final
Report of the Research Project: The Influence of Soft Factor Interventions on
Travel Demand. London: Department for Transport.
10.
Statistical Office
in Cracow. “Liszki district”. Available at: http://krakow.stat.gov.pl.
11.
Urban Transport
Enterprise. Available at: http://www.mpk.krakow.pl.
12.
Nosal Katarzyna,
Katarzyna Solecka. 2015. “Analiza obsługi transportowej w obszarze zamiejskim
pod kątem promowania transportu publicznego”. Logistyka 3: 3542-3551. ISSN 1231-5478. [In Polish: “Analysis of the transport
service in the suburban area in terms of public transport promotion”. Logistics 3: 3542-3551].
Received 25.02.2016;
accepted in revised form 03.06.2016
![]()
Scientific Journal of Silesian University of
Technology. Series Transport is licensed under a Creative Commons Attribution
4.0 International License