Article
citation information:
Khabiri, M.M., Afkhamy Meybodi, P.,
Montazeri, A.M. Evaluation of the effect of various surficial pollutants and
environmental condition on surface friction performance of road pavement. Scientific Journal of Silesian University of
Technology. Series Transport. 2021, 112,
99-111. ISSN: 0209-3324. DOI: https://doi.org/10.20858/sjsutst.2021.112.7.8
Mohammad Mehdi KHABIRI[1],
Pooya AFKHAMY MEYBODI[2],
Ali Mohammad MONTAZERI[3]
EVALUATION
OF THE EFFECT OF VARIOUS SURFICIAL POLLUTANTS AND ENVIRONMENTAL CONDITION ON
SURFACE FRICTION PERFORMANCE OF ROAD PAVEMENT
Summary. Skip resistance of
asphalt is an important parameter that can influence the safety of drivers on
roads. Although there is a linear relationship between slipping on road
surfaces and accidents, the impacts of pollutants for decreasing friction of
roads is clear to researchers. Moisture and temperature influence friction and
safety. In this research in SMA
samples, three different gradations with the maximum nominal sizes of 19, 12.5
and 9.5, based on international standards were used. For polluting the surface,
five materials that are found on roads were used, including fine-grained soil,
sand, oil, soot and rubber powder. To measure the skip
resistance, the British pendulum tester was used and for analysing
macro-texture, the sand patch method was used. The results of this research
showed that by increasing the maximum nominal size of aggregates, the depth of
macro-texture in surfaces are grown and this is due to the decrease of fine
aggregates in larger gradations. Because of the higher flexibility of pure bitumen,
the applied compression pressure on rigid aggregates can cause indentations in
the substrate and result in declining the roughness height of aggregates in the
mixed surface. This leads to declining the hysteresis part of friction by
increasing temperature.
Keywords: road safety, skid resistance, pollutants,
British pendulum tester, decision tree
1. INTRODUCTION
Every day
around the world, road accidents occur. Driver errors, poor transportation
system and poor road infrastructure contribute to these accidents [1-5].
Accumulated pollutants on roads surfaces decrease skid resistance significantly
and increase the risk of accidents. Skid resistance of asphalt is a crucial
parameter that affects the safety of drivers. Additionally, there is a linear
relationship between slippery road surfaces and accidents [6]. In the dry
season, road surfaces have sufficient skid resistance, however, in the winter
skid resistance is reduced when the surface of the road is covered with mud,
snow, ice, etc. Environmental situations are largely influential in skid
resistance between road and vehicle wheels. When the
surface of roads are covered, skid resistance is influenced significantly [7].
The
increase in the number of accidents after the first rainfall during a dry
period is due to the existence of particles on road surfaces (dust, rubber
debris, exhaust fumes, equipment, etc.) [8]. It seems
that the accumulated particles during the dry periods and water from the first
rain create a mixture of high viscosity and decreases friction [9]. Fine
particles from the road, rubber debris or traffic and dispersion of industrial
materials can be the source of safety issues such as accidents on the first day
of rain after a dry period or season change of skid resistance [10]. This
article provides an experimental study under a controlled situation, analysing
the accumulation of particles and cleaning by flow and surface water.
2. REVIEWING SOURCES
Wilson [11] observed that friction ratio decreases significantly at the
beginning of rain (pollution stage), and then upon reaching a stable amount
(cleaning stage) it increases. Kulakowski and Harwood [12] showed that a water
layer with 0.025 thicknesses on road surfaces can
decrease friction by 75%. The fine particles on roads are recognised as an additional element that declines the wet friction.
Lambourn and Viner [13] experimented with different waste materials (clay,
sand, etc.) on the road surface and they realised that when the surface of
roads are polluted, friction ratio decreases strongly in comparison with a dry
situation. Moreover, other researchers found out that these particles can
result in the lubrication of road surfaces. Li et al. [14] investigated the
friction between shoes and surfaces and they discovered that particles can
decrease friction even in dry situations. Although, with increase in particle
sizes, friction ratio decreases. Mills et al. [15] studied dry surface friction
covered with waste particles and it was found that the critical size of
particles is about 50-60 µm. When a rubber layer is slipped on the
surface, the larger particles than the critical size, slip on each other.
However, particles with lower size than the critical size, stick to each other
because of stitches force and they result in a slippery behaviour between the
surface and the rubber. On the other hand, surface roughness can trap some of
the particles, preventing particle passage from the surface bulge, resulting in
cutting the particle layer.
Heshmat [16] showed that solid particles can make a thin layer of
lubricant, which behaves like a thin layer of fluid. For a complete perception
of the effect of precipitated particles on the friction of tyre and road, then
we need to investigate the dry situation.
In another research by Hichri [17], the influence of fine particles on skid
resistance was investigated. In this research, a British pendulum tester was
used for friction measuring. Surfaces with rough and eroded aggregates were
studied. In addition, a container was used for the simulation of rain that controlled the sprayed water on the surface of the
sample. It was defined that friction recovery in dry and wet situations for
eroded aggregates was slower than rough aggregates. Based on this study,
friction and mass of particles are changed similarly but in adverse direction.
This means that when the mass of particles is decreased,
friction is increased. There is a mass threshold, above it, friction is low and
approximately stable but under this threshold, the friction increases due to
direct contact between surface roughness and rubber tyre.
This article advances previous studies with new data and friction
experiments from the application of SMA
asphalt on road surfaces. In the first section, the experiments are described
based on particles properties, type of pollutants and method used. In the
second section, the results of friction experiments in different temperatures
and moistures are provided. Then the analyses with different statistical
approaches are implemented in the third section and the effect of facial
wetness, fine-grained texture and pollutants are surveyed on friction.
3. MATERIALS
3.1. Aggregate and Bitumen
In this
research for SMA samples, three
different aggregates with maximum nominal sizes of 19, 12.5 and
9.5 mm based on NCHRP 9-8 were used. Also, the aggregates are made of lime.
Table 1 and Figure 1 show the definition of these gradations. The physical
properties of aggregates are listed in Table 2. For preparing samples, pure
60-70 bitumen was used, and its properties are given in Table 3.
Tab.
1
Gradation of SMA by NCHRP
|
Sieve
size (mm) |
Maximum
nominal size |
||
|
9.5 mm |
12.5 mm |
19 mm |
|
|
25 |
- |
- |
100 |
|
19 |
- |
100 |
95 |
|
12.5 |
100 |
95 |
62 |
|
9.5 |
95 |
52 |
42.5 |
|
4.75 |
43 |
24 |
24 |
|
2.36 |
24 |
20 |
20 |
|
1.18 |
17 |
17 |
17 |
|
0.6 |
15 |
15 |
15 |
|
0.3 |
13.5 |
13.5 |
13.5 |
|
0.075 |
9 |
9 |
9 |
Fig. 1. Gradation of aggregates
Tab.
2
Physical properties
of aggregates
|
Experiment |
Standard
|
Results
|
|
Coarse
aggregate specific gravity (gr/cm3) |
ASTM
C127 |
2.68 |
|
Fine
aggregate specific gravity (gr/cm3) |
ASTM
C128 |
2.58 |
|
Sodium sulfate
soundness (%) |
ASTM C88 |
2.5 |
|
Los
Angeles abrasion value (%) |
ASTM
C131 |
25.2 |
|
Sand
equivalent (%) |
ASTM
T176 |
63 |
|
Flakiness
(%) |
BS-812 |
15.78 |
Tab. 3
Properties of used
bitumen
|
Experiment |
Temperature
of experiment (°C) |
Standard
|
Results
|
|
Penetration
(0.1 mm) |
25 |
ASTM D5 |
65 |
|
Ductility
(cm) |
25 |
ASTM
D113 |
106.3 |
|
Specific
gravity (gr/cm3) |
25 |
ASTM D70 |
1.013 |
|
Softing
point (°C) |
- |
ASTM D36 |
54.3 |
|
Flash point (°C) |
- |
ASTM D92 |
304 |
|
Rotational
viscosity (mPa.sec) |
135 |
ASTM
D4402 |
436 |
3.2. Pollutants
In this
research, five common and most important pollutants that are seen on road
surfaces with low seasonal rainfall and deserts were used for the simulation.
These pollutants are fine-grained soil, sand, oil, soot and rubber powder and
are shown in Figure 2.
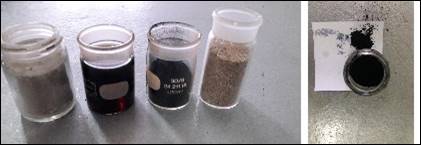
Fig. 2.
Various pollutants used in this research
4. PREPARATION OF SPECIMENS
In this
research, preparing the samples were implemented in two stages. In the first
stage for determining the optimum bitumen content, samples based on the
following standards were made and tested: bulk specific gravity (ASTM D2726),
stability and flow (ASTM D1559), and the maximum theoretical specific gravity
(ASTM D 2041). For compressing the SMA
samples, 50 impacts of Marshal Hammer were used [18]. The optimum bitumen
content for different gradation is listed in Table 4.
As shown
in Table 4, by decreasing the nominal size, the optimum bitumen content
increases. In the second stage, SMA
samples were made based on the ASTM D5581 standard with 6 inches (15 cm)
diameter for the skid resistance experiment (Figure 3).
Tab.
4
Optimum bitumen
content of SMA samples
|
Maximum
nominal size (mm) |
Optimal
pitch percentage (%) |
|
9.5 |
6.5 |
|
12.5 |
6.3 |
|
19 |
6.14 |
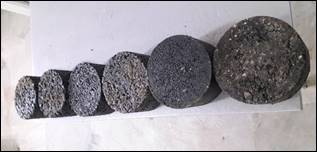
Fig. 3.
SMA sample with 6 inches diameter.
5. PREPARATION OF SPECIMENS
5.1. Measuring friction
In this
research, the British pendulum tester (BPT)
was used for measuring friction. This device was designed by the Road Research
Laboratory (RRL), and it is one of
the simplest devices for measuring skid resistance since 1960. This method is
described in the ASTM E303 standard.
This device has a rubber slipper at the end of its arm, which slips on
the surface and measures friction. The measured values (Britain pendulum number
– BPN), shows the skid
resistance of the surface, and it is between 0 and 150. A larger BPN shows
higher skid resistance. For experimental samples, the dimensions of the rubber
slipper are 6*25*76 mm and the length of slip is between 124 and 127 mm so that
the 6 inches (15 cm) samples cover this length [19]. Before every experiment,
this rubber slipper should pass five times on the aggregate surface. This
operation results in removing the sharp edges of the rubber slipper before
every experiment [17].
5.2. Sand Patch Method
One of the
most common methods for measuring the macro-texture of pavement surfaces is the
sand patch method described in the ASTM E965 standard. In this method, a
certain volume of standard sand is dispersed on a dry and clean surface in a
circular shape. The level of dispersed sand should be at the same level of the
top point as aggregate, and then the diameter of the cycle is measured. The
mean texture depth (MTD) is
calculated by dividing volume by cycle area as follows [19]:
 (1)
(1)
Where:
MTD= the mean texture depth (mm),
V= sand volume (mm3),
D= average of cycle diameter (mm),
As the MTD is larger, the surface is rougher.
5.3. Simulating rainfall
One
simulator for rainfall was implemented for controlling the water splash on the
surface of the sample. This system included a rectangular container (20*30*40
cm) and a nozzle attached to a water pump that stored a stable flow of water
and made small drops (Figure 4). This system can simulate high and low
rainfalls (low water volume and the surface remained viscose and
slippery).
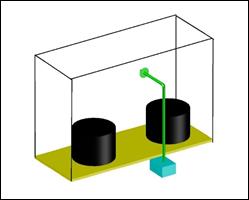
Fig. 4.
The simulating rainfall container
6. RESULTS
For the
sand patch experiment, for every asphalt mixture, two samples were made, and
every sample was experimented twice. Figure 5 shows the average amount of sand
patch. As seen, by increasing the maximum nominal size of aggregates, the depth
of macro-grained texture increases, and this is due to decreasing the amount of
fine aggregate in the larger gradation. As MTD
increases, the drainage of surface water happens more rapidly, and friction
increases at the end.
Fig. 5.
The result of sand patch
Figures
6-8 illustrate the variation of the sample's friction in dry and wet situations
for three gradations. As expected, friction in a dry state is higher than in a
wet state. As witnessed, the highest loss of friction was seen in oily
pollutants. Because oil is an insoluble liquid, when it mixes with water, a
thicker layer is created on the surface, which leads to more decrease in
friction.
Fig. 6.
The comparison of BPN in dry and wet
situations for samples with 9.5 mm aggregates
Fig. 7.
The comparison of BPN in dry and wet
situations for
samples with 12.5 mm aggregates
Fig. 8.
The comparison of BPN in dry and wet
situations for samples with 19 mm aggregates
Figure 9
shows the variation in the BPN amount
based on gradation and type of pollution. As noticed, by increasing the maximum
nominal size of aggregates, sample's friction rises due to MTD increase. In addition, the lowest amount of BPN in every gradation relates to
fine-grained soil. In samples with maximum nominal sizes of 9.5 and 12.5 mm, the highest amount of BPN is related to soot pollution but in
the sample with the highest nominal size, 19 mm, the biggest amount BPN is for rubber powder.
Fig. 9.
The gradation variation based on type of pollutant
Figure 10 shows the BPN amount
for three different temperatures (25, 45 and 65°C). As seen, by increasing
the temperature of the experiment, the BPN
amount decreases in all plots of the Figure. This effect can be attributed to
variation in bitumen stiffness in addition to variations in water viscosity on
the surface of the sample. These two factors can be effective in both
hysteresis and adhesion. Since the mixture of asphalt in the surface of
pavements and rubber tyre from vehicles are viscoelastic materials, temperature
affects the friction properties. Stiffness of the slider in the British
pendulum tester and bitumen decreases with the increase in temperature. As
temperature increases, total loss energy in vehicle wheel for deformation
decreases, and finally the hysteresis part declines for a certain amount of
shape change. Moreover, because of more flexibility in higher temperature, the
applied compressive pressure on rigid aggregates can cause indentations in the
substrate, thus reduce the roughness height of aggregates in the surface of the
mixture. This phenomenon helps to decrease the hysteresis part of friction with
temperature rise. The adhesion part of friction is influenced by the change in
the hydrodynamic properties of water with temperature change. Shear stress in
Newtonian fluids such as water depends on viscosity and strain time rate. As
viscosity decreases with temperature rise, shear stress drops and finally the
adhesion part of friction decreases [20].
7. DECISION TREE
The
decision tree method is one of the ways for classifying data and it is a subset
of the numerical taxonomy method. The decision tree is a method of
non-parametric data analysis; it is a powerful tool for predicting and
classifying problems. In this method, the result of data analysis is shown
graphically, making the tree easier to understand and interpret. Using the
decision tree, important and insignificant variables can be identified and
eliminated. The decision tree consists of several nodes. In Figure 11, the zero
node, which is the root and the first node, shows the amount of friction (BPN). This node is divided into three
branches. This indicates that the most important variable affecting the BPN value is the size of the aggregates.
As observed, when the aggregate size is 19 mm, the largest amount of friction
was obtained (42.1% of the largest BPN
is for samples with a maximum size of 19 mm). Each of
its 1 to 3 nodes is divided into 2 separate nodes. This phenomenon shows that
after the maximum size of aggregates, the variable of water content on the
surface of the samples is the most important factor affecting the amount of BPN. As seen, there is more BPN in low rainfall than in heavy
rainfall. This phenomenon is true for all three gradations. Samples with a size
of 19 mm have the highest amount of BPN,
which is due to the rapid drainage of rainwater. Further, Node 6 is divided
into three branches. This shows that temperature has the greatest effect on the
samples with 12.5 aggregate size with low
precipitation. As temperature increases, the amount of friction increases,
which is expected.
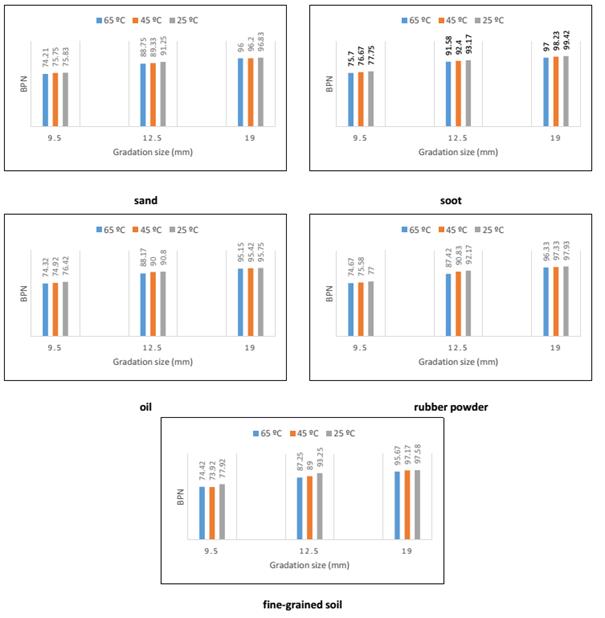
Fig. 10.
The plot of friction change by temperature
Fig. 11.
The decision tree of pollutant impact and environmental factors on friction
8. CONCLUSION
1-
By increasing the maximum nominal size of aggregates, MTD of pavement increases due to decline
in fine particles in higher granules.
2-
The maximum friction loss is for oil pollution. Because
oil is an insoluble liquid, when mixed with water, it creates a thicker layer
on the surface that further reduces friction.
3-
By increase in the maximum nominal size of aggregates,
friction of the samples increases and this is because of increase in MTD.
4-
The minimum amount of BPN
in every three gradation is for fine-grained soil. In samples with a maximum
nominal size of 9.5 and 12.5 mm,
the highest amount of BPN is related
to soot pollution, but in the case of samples with a maximum nominal size of 19
mm, the highest amount of BPN is
related to rubber powder.
5-
The amount of friction decreases with increasing the test
temperature. This effect can be due to changes in bitumen hardness plus changes
in the viscosity of water on the surface of the sample, which can affect both
hysteresis and friction adhesion.
6-
Because of the higher flexibility of bitumen at higher
temperatures, the compressive pressure applied to the rigid aggregate can cause
indentations in the substrate and finally reduce the roughness height of the
surface aggregates. This phenomenon also helps to reduce the hysteresis
component of friction by increase in the temperature.
7-
Based on the decision tree, the most important factor
influence on friction is the size of the aggregates. In addition, the second
factor that has the most significant effect on friction is the amount of water
on the surface of the samples.
References
1.
Ibrahim
M. Asi. 2007. „Evaluating skid Resistance of
different asphalt concrete mixes”. Building
and Environment 42: 325-329. DOI: https://doi.org/10.1016/j.buildenv.2005.08.020.
2.
Farooq
Danish, Janos Juhasz. 2020. „Statistical Evaluation of Risky Driver
Behavior Factors that Influence Road Safety based on Drivers Age and Driving
Experience in Budapest and Islamabad”. European Transport \ Trasporti Europei 80(2): 1-18.
ISSN: 1825-3997. DOI: https://doi.org/10.48295/ET.2020.80.2.
3.
Mohanty
Malaya, Partha Pratim Dey, Bhagyashree Panda. 2020. „Assessment of
traffic safety at median openings using surrogate safety measures: a case study
in India”. European Transport \
Trasporti Europei 80(3): 1-12. ISSN: 1825-3997.
DOI: https://doi.org/10.48295/ET.2020.80.3.
4.
Hichim
Majid Farag, Ahmed Shany Khusheef, Saddam Hasan Raheemah. 2020.
“The Effects of Driver Age and Gender on Vehicle Stopping Distance Under Different Speeds”. European Transport \ Trasporti Europei 80(1): 1-11. ISSN 1825-3997.
DOI: https://doi.org/10.48295/ET.2020.80.1.
5.
Staniek
M., P. Czech. 2016. “Self-correcting neural network in road pavement
diagnostics”. Automation in
Construction 96: 75-87.
DOI: 10.1016/j.autcon.2018.09.001.
6. Reginald B. Kogbara, Eyad A. Masad, Emad Kassem, A. Tom Scarpas, Kumar Anupam. 2016. „A state-of-the-art review of parameters influencing measurement and modeling of skid resistance of asphalt pa vements”. Construction and Building Materials 114: 602-617. DOI: https://doi.org/10.1016/j.conbuildmat.2016.04.002.
7. Lubis A.S, Z.A Muis, E.M. Gultom. 2018. „The effect of contaminant on skid resistance of pavement surface”. In: IOP Conference Series: Earth and Environmental Science 126. DOI: doi:10.1088/1755-1315/126/1/012040.
8.
Eisenberg
Daniel. 2004. „The mixed effects
of precipitation on traffic crashes”. Accident analysis & prevention 36(4): 637-647.
DOI: https://doi.org/10.1016/S0001-4575(03)00085-X.
9.
Persson
B.N.J, U. Tartaglino, O. Albohr, E. Tosatti. 2005. „Rubber friction on
wet and dry road surfaces: The sealing effect”. Physical Review B 71(3): 035428.
DOI: https://doi.org/10.1103/PhysRevB.71.035428.
10.
Hichri
Yosra, Veronique Cerezo, Minh Tan Do. 2017. „Effect of dry deposited
particles on the tire/road friction”. Wear
376-377: 1437-1449.
DOI: https://doi.org/10.1016/j.wear.2017.01.037.
11. Wilson Douglas James. 2006.
„An analysis of the seasonal and short-term variation of road pavement
skid resistance”. PhD thesis.
The University of Auckland.
12. Kulakowski B., D. Harwood, U. Kreßel. 1990. “Effect of water-film thickness on tire-pavement friction”. In: Surface
characteristics of roadways: international research and technologies. Edited by W. Meyer and J. Reicher. P. 50-60. ASTM International.
ISBN: 978-0-8031-5110-9.
13. Lambourn R.F., H.E. Viner. 2006. Friction tests on contaminated road surfaces. Transport Research Laboratory (TRL). Transport Research Laboratory.
ISBN: 1-84608-935-2.
14.
Way Li
Kai, Fanxing Meng, Wei Zhang. 2014. „Friction between footwear and floor
covered with solid particles under dry and wet conditions”. International Journal of Occupational Safety and Ergonomics 20(1): 43-53.
DOI: 10.1080/10803548.2014.11077027.
15.
Mills
R., R.S. Dwyer-Joyce, M. Loo-Morrey. 2009. „ The mechanisms of pedestrian
slip on flooring contaminated with solid particles”. Tribology International 42(3):
403-412. DOI: https://doi.org/10.1016/j.triboint.2008.07.013.
16.
Heshmat
Hooshang. 1993. „Wear reduction
systems for coal-fueled diesel engines II. Experimental results and
hydrodynamic model of powder lubrication”. Wear 16:
518-528. DOI: https://doi.org/10.1016/0043-1648(93)90537-V.
17. Yosra Hichri, Cerezo Véronique,
Do Minh-Tan. 2018. „Effect of fine particles on road skid
resistance”. In: 8th Symposium on
Pavement Surface Characteristics (SURF) 16: 518-528. 2-4 May 2018. Brisbane, Queensland,
Australia.
18. Davari Mohammad. 2019.
„Determining the appropriate asphalt pavement in areas with dust from the
point of view of surface friction”. Master’s
thesis. Iran: Yazd University.
19. ASTM E965-15:2019. Standard Test method for measuring pavement Macrotexture Depth using a volumetric Technique. West conshohocken: ASTM International.
20.
Elger
Donald F., Barbara A. Lebret, Clayton T. Crowe, John A. Roberson. 2020. Engineering fluid mechanics. Washington State Uninercity. ISBN: 978-1-119-72350-9.
Received 09.04.2021; accepted in revised form 22.06.2021
![]()
Scientific
Journal of Silesian University of Technology. Series Transport is licensed
under a Creative Commons Attribution 4.0 International License