Article
citation information:
Tarar, A. Mukherjee, D. Rao, K.R. Development of bus
transit system control measures with open transit data. Scientific Journal of Silesian University of Technology. Series
Transport. 2021, 111, 169-180. ISSN:
0209-3324. DOI: https://doi.org/10.20858/sjsutst.2021.111.15.
Anjali TARAR[1],
Deotima MUKHERJEE[2],
Kalaga Ramachandra RAO[3]
DEVELOPMENT OF BUS
TRANSIT SYSTEM CONTROL MEASURES WITH OPEN TRANSIT DATA
Summary. The purpose of this study is to analyse the accuracy of
the static schedule of bus transit network in Delhi using real-time data
available from Delhi’s Open Transit Data (OTD) platform. To access and
organise the data, an algorithm that can convert real-time data into a General
Transit Feed Specification (GTFS) format, needs to be designed. Further, this
study intends to develop a methodology, which can convert raw data of bus
locations into link travel times, which consequently, helps in identifying
problematic links. As researchers continue to make use of the data available
via GTFS, they may well be aware of the fact that such data may differ
systematically from actual transit operations. Continuous improvement of the
accuracy of the GTFS static file would benefit its users.
Keywords: OTD, GTSF, schedule adherence, bus transit system
1. INTRODUCTION
Globally, the
General Transit Feed Specification (GTFS) has become the most popular format to
identify fixed-route transit services. Precise and updated data plays a vital
role in an information system. GTFS static data when plotted on Google Maps
help in the easy visualisation of the spatio-temporal bus routes. It helps the
users in identifying the location and provides researchers, the scope for
further investigation into the optimality and accessibility of routes spread
across major cities that were previously unavailable. Research suggests
that such integrated systems enable easy real-time tracking of buses and
provide information on their location, thus, enhancing punctuality and service
quality [1].
The transit buses usually do not operate as per the planned schedule as
unavoidable circumstances such as congestion and bus bunching lead to
significant variation in the travel time. Both commuters and transit agencies
are aware of these issues. However, research addressing routing issues and
schedule adherence across transit networks are insufficient, even with the
availability of the GTFS data. The available data consists of real-time bus location information
accumulated through a data interface. Open transit feed offers raw real-time
bus locations updates on operating buses of a city. Thus, an
algorithm that can convert real-time data into the GTFS format needs to be
developed. The static data available do not define
specific arrival and departure timings but instead calculates the time between
bus stops using a constant speed, which leads to bias results. Formulating a
methodology to identify the actual arrival/departure time at individual bus
stops can help in calculating the optimal waiting time for the buses for
boarding and alighting passengers. Finding the delay encountered by the
operational buses is also mandatory to understand the actual bus travel
patterns and the loopholes that need to be fixed for the existing static
schedule data.
2. RESEARCH MOTIVATION
The stored real-time and static GTFS data helps in locating
critical issues of the urban traffic movement. The critical challenge faced by the public transport sector is the
reliability of the travel time schedules. According to [2], the major criticisms
regarding public transportation are often delays in bus arrival and the
unnecessary time spent while travelling due to unforeseen events such as road
crashes or traffic. The static nature of most trip-planning systems prevents
travellers from assessing information in real-time. Information influences the
riders’ opinion on public transportation [3] pursued appropriate ways to apply GPS data to
diagnose problems and evaluate the performance of road networks. The term ‘travel time
variability’ is used to describe the variation for the same journey over
a specific route [4] defined PT reliability, or rather
unreliability, in terms of travel time variability (TTV). Waiting time
uncertainty is one of the main factors of public transport reliability and
overall level of service. The
delay encountered by a bus during a trip consequently increases the waiting
time and total journey time for passengers on that route.
Similarly, when a bus is ahead of
its schedule, the waiting time might extend by an entire headway. This is a
matter of unreliability as well. According to [5], the stored real-time and static GTFS data can
be used in detecting the issues with traffic movement [6] found that real-time bus arrival
information impacts both passenger behaviour and the significance of their
waiting time at the bus stop [7] concluded that the accessibility of
real-time information concerning vehicle arrivals are often considered an
important measure to reduce unreliability. The difference between passenger
waiting time expectations derived from the timetable and real-time information
has an impact on reliability [8] elucidates a method improving the
accuracy of a General Transit Feed Specification package by using open transit
data. It is evident from the literature that an insignificant number of studies
has been conducted in this field. Thus, this study aims to develop an approach
for evaluating the travel time reliability of bus networks in Delhi, India,
using the bus Open Transit Data (OTD) obtained from the website of the
Government of Delhi.
3. DATA
3.1. GTFS (Static data)
This study is conducted for the
city of New Delhi, India, on the routes covered by buses operated under the
Delhi Integrated Multi-modal Transit System (DIMTS). GTFS data covers planned
schedule and map data but excludes real-time vehicle location or prediction
information. The general transit static file provides information on routes,
bus stop latitudes and longitudes, and trips and timetable of a specific
agency. GTFS static data is mainly established on a schedule, which gives
information about service instead of real-time tracking. OTD sources are
expected to have constantly updated arrival and departure information with the
help of the GPS.
3.2. Real-time data
Open transit real-time data provides bus location history in a raw data
format. A program was developed to receive
real-time data from the OTD website of the Government of Delhi after
registering for the API (Application Program Interference) key on the same
website. The study period consists of 15 days (from 05/01/2020-20/01/2020) to
eliminate the winter holidays and the final saved file contains more than a
million data. It displays the locations of buses with their information on
vehicle ID, route ID, date and time on the web map of the user. The buses
update their position on the road in the form of geographical coordinates every
10 seconds. These data along with all related information are saved in a
spreadsheet.
Moreover, it is presumed that each
registered vehicle is operating a trip belonging to a scheduled route and it
identifies the bus stops that have been crossed. Bus stops, which are within 60
m of the matched route of the vehicle, are considered and fitted to the nearest
point on that route. This is because not all vehicles complete an entire route
smoothly due to bus bunching or congestion during their trip.
All data sets are clustered based on multiple
timeframes, owing to diverse schedules of transit vehicles that result in
diverse travel patterns as well. The four timeframes are weekend, weekday
morning, weekday non-peak, and weekday evening. Weekday indicates Monday
through Saturday, while weekend denotes Sunday. Weekday peak period included
data between 7:30 A.M. ~ 9:30 A.M., weekday evening period includes data
between 6:00 P.M. ~ 8:00 P.M., while weekday non-peak period includes data
between 12:00 P.M. ~ 2:00 P.M.
3.3. Data sampling
A total of 266 operative routes in
the city were identified through the data files. After analysing the route and
trip files, the routes were arranged with the number of bus stops. For
determining the sample size of bus routes for this study, a cumulative frequency
was plotted to obtain the number of routes ranging between 50th and
75th percentiles (which turns out to be 143), with the number of bus
stops ranging from 25 to 55 per route.
A stratified sampling technique was
implemented in which the population was separated into groups called strata and
then a simple random sample is drawn from each group. Thus, the study area was
divided into zones based on the following types of indicator – land use,
population and geographical representativeness. The bus routes were then
classified into clusters that are covered area-wise by DIMTS buses. These five
clusters include Central Delhi, North Delhi, South Delhi, North-East Delhi,
South-West Delhi and New Delhi, covering almost 55% of the population and 57%
of the area of Delhi.
These clusters cover the CBD area
of Connaught Place, residential areas, railway stations and the ISBT bus
terminals. It ensures a geographically well-represented sample. Given the
significance of travel time variability in OTD data, bus routes with
considerable land-use variability and route lengths are selected for the study.
One route from each cluster, with a minimum of 20 and a maximum of 55 bus
stops, is selected from the total population (routes) as shown in Figure 1. Further, routes originating
or merging with the major cluster bus depots in Delhi are identified; this
covers all nine administrative districts of Delhi NCT.
Fig. 1. Selected
survey routes
4. RESULTS AND ANALYSIS
4.1. Effectiveness of the static data
After comparison with real-time data, the
static files are matched to provide accurate information with less variation
and help plot routes on Google Maps. They also provide the arrival and
departure information of buses at a particular bus stop on a route and the
number of trips per day on that route. As mentioned on the official website,
the arrival and departure times of buses are not accurate and are rough
estimations generated by assuming a constant travel speed. In fact, the same
time is mentioned for arrival and departure, with no information related to the
dwell time of individual buses. Thus, the data of these files are highly
incompatible (Figure 2) with
the number of trips and headway being far from reality.
Delhi has a transit system with a
predefined schedule, available for commuters in the static data file. Buses
operate on this schedule and the bus schedule affect the overall transit
system. Bus schedules help in identifying the actual performance of the transit
system. Schedule adherence between link travel time is the difference between
schedule and actual travel time between a link. If the difference has a
positive value, that indicates bus arrival before time, and a negative value
shows late arrival of the bus. Schedule adherence at a specific link is
determined by the following:
|
|
where,
Sjk is the
schedule adherence of bus k at bus
stop j, Ajk is the actual link travel time of bus k at bus stop j and Pjk is
the predetermined/scheduled link travel time of bus k at bus
stop j.
The congestion on urban roads varies for
different hours of the day such as weekend and weekday, peak and off-peak hours
as well as morning and evening periods. Figures 3-7 shows the schedule
adherence in seconds at each stop on routes 764 UP and GL 23 UP. They show that
the buses during all travel periods arrive before time and the mean of schedule
adherence significantly varies on different time periods. Thus, after analysing
two routes, it revealed that the GTFS static data is mainly established on
schedule, which gave information about service instead of monitoring them. As
GTFS data is widely used by researchers, they should be familiar with the fact
that GTFS static data is based on schedules and can differ from actual data.
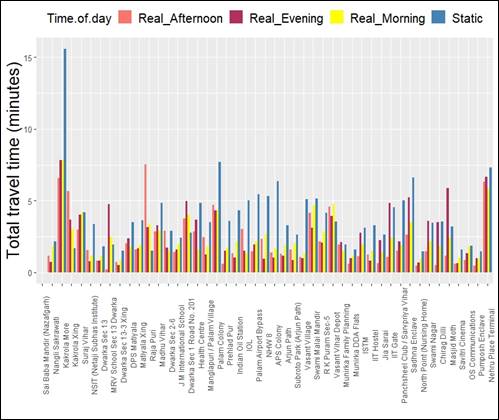
Fig. 2. Comparison between static time and real-time on
different times of the day
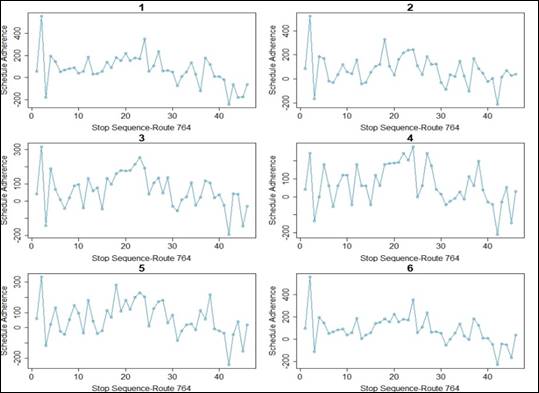
Fig. 3. Schedule adherence of weekday peak on route
764 UP
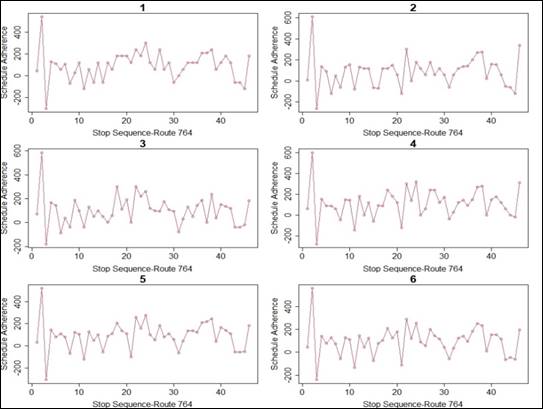
Fig. 4. Schedule adherence of weekday off-peak on route 764 UP
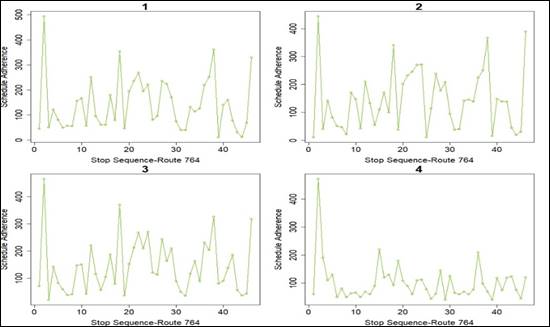
Fig. 5. Schedule adherence of weekday on route 764 UP
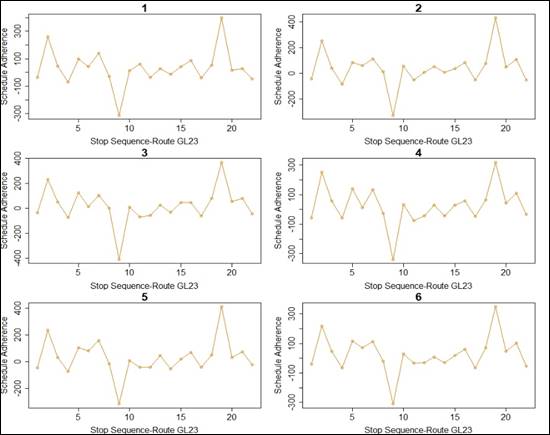
Fig. 6. Schedule adherence of weekday peak hours on route GL23 UP
4.2. Effectiveness of the real-time data
Travel time data was collected using a GPS enabled mobile
application (between 1/2/2020 – 5/2/2020) for obtaining accurate
real-field travel time and bus stop locations. Link travel times and journey
time are matched with the OTD data, demonstrating a significant level of
inconsistency. Repetitive data updates and missing data for buses or overall
bus system for hours impedes the true use of real-time tracking.
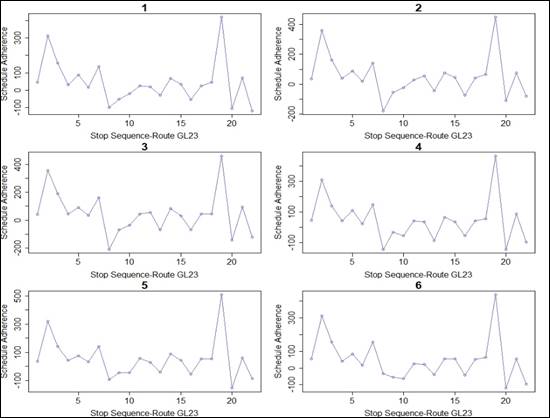
Fig. 7. Schedule adherence of weekday off-peak hours on route GL23 UP
Fig. 8. Inconsistent data from the real-time update on route 764
UP
As shown in Figure 8, some links have missing location data as received via
GPS. The total number of GPS locations on route 764 UP was around 32,400 (data
updated every 10 seconds). However, the total number of input data for route
764 UP was 2,070 (45 data set multiply by 46 bus stops) as only the stop data
are required. The missing data, then modified by 780 times, indicated that
around 37% of bus stops had missing data. The reason behind this issue could be
the presence of skyscrapers in that area, owing to which the GPS could not
trace the coordinates around those locations. In this case, the longest time
interval during which no data was received is almost 12 minutes. OTD data shows
missing data for hours occasionally, mostly before 9:00 A.M., and at times,
during the afternoon, between 1:00 P.M. to 3:00 P.M.
4.3. Weekday trend
during lockdown/ best travel time
Public transport services were stopped in the city for
almost two months due to the COVID-19 pandemic. Public transportation resumed
in Delhi on Tuesday (19 May 2020) with a limited number of passengers. A best
travel time study determines the amount of time required to travel from origin
to the destination on a given route in an ideal condition. Comparison of the
data obtained from best travel time and regular travel time gives a good
indication of the level of service (LOS) in the study section. Figures 9-10 are
representations of the comparison.
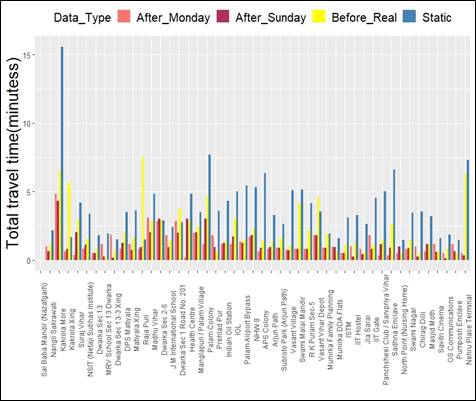
Fig. 9. Comparison of travel time during pre- and post-lockdown
phases of route 764 UP
Travel Time Variability is one of
the key performance measure used by many public agencies; LOS and travel time
share a significant relationship. The relation between travel time and LOS
shows the following: under LOS A-E, the travel time is low and consistent,
while under LOS F, the travel time is 3 times longer than free-flow traffic
conditions and the standard deviation is also considerably greater. LOS F is
normally considered for stop-and-go traffic,
which is unacceptable, while A-D are generally acceptable by drivers. As shown
in Figure 10, travel time is
almost 2 times longer than the free-flow traffic condition, which prevailed
during the lockdown, so the level of service provided on route 764 UP is within
the range of A-D, thus, acceptable.
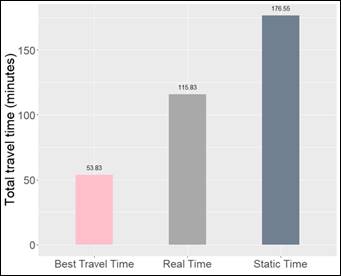
Fig. 10. Comparison of total travel time: static, real, best for route 764 UP
4.4. Identification of potential issues with
the urban traffic flow
The GTFS file was analysed based on travel time
and the number of bus stops per route to identify the most delayed routes with
remarkably high travel time as presented in the static data files
(Figure 11). A comparison between the GTFS static files and the on-the-go
data collected from bus locations highlight the trends in the most delayed bus
routes. Additionally, it identifies the causes of a delay from the actual bus
arrival time and the scheduled time.
Fig. 11.
Most delayed routes
Inter-Quartile
Range (IQR) variation
In this analysis, Route 67 is split into
multiple link travel times (7 working days, 42 journeys) so that each journey
segment between subsequent bus stops represented one link. The times spent
between the 5 bus stops could be considered as one type of link travel time.
This study identifies the variation between the links and compares them with
the IQR of link travel times. Quartiles and medians are used in this research,
as they are outliers found in data. If IQR is small, it indicates that the link
is showing less variation almost throughout the day, while a larger value
indicates large variations for the same. In other words, a route between bus
stops can be driven through quickly in 25% of the cases in optimal conditions;
however, at least in 25% of the cases, it takes a long time. The IQR
variations, as shown in Figure 12,
are colour coded, with areas of low IQR variation as green and areas of high
IQR variation as red for easy detection of problematic links.
Fig. 12. IQR variations on Route 67
5. CONCLUSIONS
The main objective of this study was
to inspect a reliable parameter from the service point of view. GTFS and
agencies used this technique to present the actual service provided through a
route in a transportation system. Based on this, actual trips can be
systematically planned according to need. The measurements received from GTFS
regarding bus location can be directly interpolated to the arrival frequency.
The main aim was to provide a data format, which is more reliable for research
and analysis. GPS enabled bus travel time may vary considerably from the
planned schedule due to unavoidable circumstances like traffic congestion,
breakdown of vehicles and non-functional traffic signals. Analytical methods
used are simple and can be applied anywhere to any route. Moreover, it
identifies the results according to different traffic flow situations available
for a selected region.
This study was conducted with data of only 20
days and is limited to data available through the GTFS static file and
real-time data. Field implementation requires long-term data to validate and
test the model. The real-time transit data could be used to assess field
measures like punctuality, apart from various applications in planning.
Furthermore, it could be helpful in the creation of extracted data obtained
from GTFS, which are more reliable. Some other important analyses, such as reliability,
missed trips, headway deviations, etc., could not be performed for the selected
routes, as real-time transit feed is available only for buses operated by one
agency. The DIMTS timetable is officially not a part of the Open Transit Data
published by the Government of Delhi, hence, was not considered for this
project. The missing data is about 37%, which needs modifications before using
it for research purposes. Such discrepancies make it difficult to identify how
much proportions of trips were made for full alignment and what percentage were
curtailed/modified on various routes. Improved data quality and data cleaning
in the future could help in improving the quality of data for further detailed
analysis and developing appropriate diagnostic tools for operational control.
Reference
1.
Monzon Andres, Sara
Hernandez, Rocio Cascajo. 2013. ,,Quality of bus services performance: Benefits
of real time passenger information systems”. Transport and
Telecommunication 14(2):
155-166. DOI: 10.2478/ttj-2013-0013.
2.
Lyons Glenn, Reg
Harman. 2002. ,,The UK public transport industry and provision of multi-modal
traveller information”. International Journal of
Transport Management 1(1): 1-13.
3.
Lorkowski S., P.
Mieth, K.U. Thiessenhusen, D. Chauhan, B. Passfeld, R.P. Schäfer. 2004.
„Towards Area-wide Traffic Monitoring-applications derived from Probe
Vehicle Data”. In: Eighth International Conference on Applications of
Advanced Technologies in Transportation Engineering (AATTE): 1-6. ASCE. May
26-28, Beijing, China.
4.
Mazloumi Ehsan,
Graham Currie, Goeffrey Rose. 2010. ,,Using GPS data to gain insight into
public transport travel time variability”. Journal of Transportation
Engineering 136: 623-631.
DOI: 10.1061/(ASCE)TE.1943-5436.0000126.
5.
Syrjärinne
Paula, Jyrki Nummenmaa, Peter Thanisch, Riitta Kerminen, Esa Hakulinen. 2015.
,,Analysing traffic fluency from bus data”. IET Intelligent Transport
Systems 9(6): 566-572. DOI:
10.1049/iet-its.2014.0192. ISSN: 1751-956X.
6.
Lu Hui, Peter
Burge, Chris Heywood, Rob Sheldon,
Peter Lee, Kate Barber, Alex Phillips.
2018. „The impact of real-time information on passengers’ value of
bus waiting time”. Transportation Research Procedia 31: 18-34. DOI: 10.1016/j.trpro.2018.09.043.
7.
Cats Oded,
Gerasimos Loutos. 2016. „Real-Time Bus Arrival Information System :
An Real-Time Bus Arrival Information System: An Empirical
Evaluation”. Journal of Intelligent Transport Systems 20(2): 138-151. DOI:
10.1080/15472450.2015.1011638.
8.
Wessel Nate, Jeff
Allen, Steven Farber. 2017. „Constructing a routable retrospective
transit timetable from a real-time vehicle location feed and GTFS”. Journal
of Transport Geography 62:
92-97. DOI: 10.1016/j.jtrangeo.2017.04.012.
Received 15.04.2021; accepted in revised form 20.05.2021
![]()
Scientific
Journal of Silesian University of Technology. Series Transport is licensed
under a Creative Commons Attribution 4.0 International License