Article
citation information:
Olszańska, S., Prokopiuk, I. Balanced scorecard as an
effective method for process management in a transport company. Scientific Journal of Silesian University of
Technology. Series Transport. 2021, 111,
119-128. ISSN: 0209-3324. DOI: https://doi.org/10.20858/sjsutst.2021.111.10.
Sylwia
OLSZAŃSKA[1],
Iryna PROKOPIUK[2]
BALANCED
SCORECARD AS AN EFFECTIVE METHOD FOR PROCESS MANAGEMENT IN A TRANSPORT COMPANY
Summary. The strategic scorecard represents a major element of an
enterprise's management system, which contributes to improving the key areas of
operation, as well as precisely defining operational goals, metrics and tasks
within the strategical framework. Increasing competitiveness, as well as
progressive globalisation of the Transport, Shipping and Logistics (TSL)
services market, requires constant adaptation to change from managers. It is,
therefore, appropriate to use the strategic scorecard as it can be applied for
continuous monitoring of progress in the implementation of strategy and, if
necessary, for enhancing actions and the measurement system. The authors
analysed a transport company operating in the Podkarpackie Voivodship, with the
implementation of the strategic scorecard. The purpose of this article was to
create a strategic scorecard for the transport company in the context of
streamlining transport processes, while simultaneously improving the quality of
customer service, translating into maximising financial results.
Keywords: balanced scorecard, process management, transport company
1. INTRODUCTION
Currently, the transport market is
developing very dynamically. Companies from the TSL industry are offering a
variety of services to meet the increasing demands of their customers
[4, 5, 10, 11, 18]. In light of this, in an era of such strong competition,
transport companies must constantly improve their strategy in the context of
their processes [2, 6, 16]. Thus, strategic management is a key element of
management in transport companies [9, 12, 13]. In this aspect, the authors
believe that the use of a strategic scorecard provides major opportunities to
link these metrics with the improvement of the accepted strategy [1, 8, 17].
Moreover, the balanced scorecard includes a wide variety of goals and sensitive
metrics that permit a better understanding of the functioning of the enterprise
[7]. In addition, it combines
traditional informative indicators about the current implementation of
processes, with metres that analyse these processes, as well as factors that
contribute to shaping future results [3, 14]. Consequently, the use of a
properly executed balanced scorecard affects the improvement of transport
processes [15].
2. STRATEGIC SCORECARD AS AN ESSENTIAL ELEMENT SUPPORTING MANAGEMENT IN A TRANSPORT COMPANY
The use of a strategic scorecard
carries numerous benefits, for example, it helps to transform the company's
vision and mission into a strategy and to assign strategic goals to specific
metrics and tasks. The balanced scorecard focuses on perspectives that include
the key range of activities within the framework of process management.
Moreover, this management tool combines traditional (financial) indicators that
reflect past events in the company with metrics that analyse processes and
factors (for example, innovations), which shape the future in terms of
processes. An important advantage of introducing the balanced scorecard to the
enterprise process management system is its ability to monitor the
implementation of strategic goals daily , and consequently, improve them.
Furthermore, a strategic scorecard
enables the combination of planning and target setting
with initiatives to increase the efficiency of transport processes, and as a
result, build management feedback (Figure 1).
The strategic scorecard focuses on
four areas in the company, the perspectives. The strategy map, which focuses on
the causal link between the objectives and the measurers in the given
perspectives (Figure 2), is therefore relevant in this respect.
3. CHARASTERISTICS OF THE ANALYSED COMPANY
The analysed freight forwarding and transport
company is located in Rzeszów (Podkarpackie Voivodeship) and has been
operating since 2015. At the beginning of its activity, the company provided
only freight transport services, however, the scope of services expanded over
time with its forwarding, as part of which contracts were signed with
manufacturers in the chemical industry. The company provides services based on
cooperation with permanent contractors. It disposed of a transport fleet that
includes 6 transport sets of 3.5 t, 7 trucks of 12 t, 4 semi-trailers of 13.6
t, known as MEGA. In addition, with the growth of the company and increased
demand for services, there emerged a need for investment in the form of
warehouse construction. Accordingly, the organisational structure of the
analysed company is as follows (Figure 3).
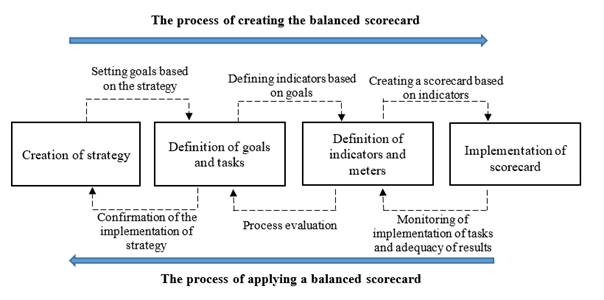
Fig. 1. Implementation and application of the scorecard in the enterprise
[authors’ study]
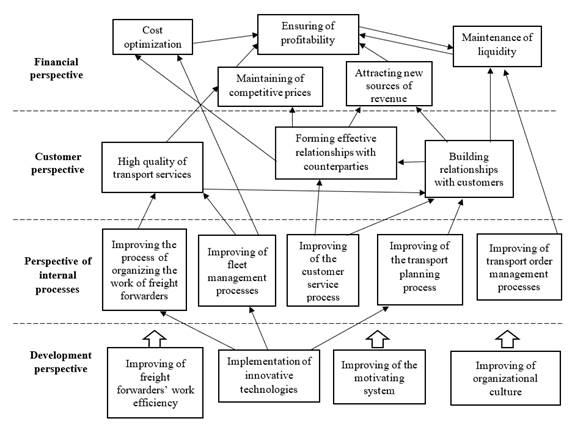
Fig. 2. Strategy map for the transport
company [authors’ study]
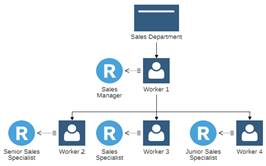
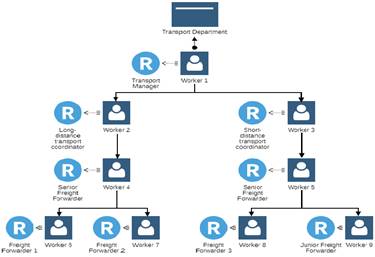
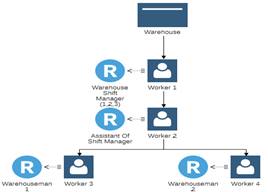
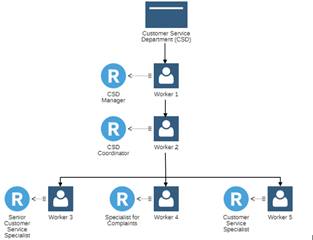
Fig. 3. Organisational structure at different
departments of the studied
freight forwarding company (R – denotes role) [authors’ study using
Adonis]
An integral element in the
implementation of processes in the enterprise are costs, therefore, the leading
objective in this respect is to generate maximum profit at minimal costs.
Consequently, both management, operational and functional processes are
fundamental to the company. In the case of the analysed enterprise, the process
of accepting orders from the customer, the process of planning and implementing
deliveries, and the process of accepting and issuing goods from the warehouse
were considered.
4. ANALYSIS OF THE TRANSPORT COMPANY IN TERMS OF THE STRATEGIC SCORECARD
The strategic scorecard is an
essential element of management in transport companies. It allows changing the
strategy into specific tasks and measures for their implementation. The
strategic scorecard draws particular attention to such areas as customer
service, process improvement, internal processes and finance, which are to
improve the situation in these four areas, either directly or indirectly, and
to generate the greatest possible profits and high market value.
To describe specific goals, we used
abbreviations, in which the first letter denotes the unit to which the goal
relates (K – general management, D – department), the second letter
is an abbreviation of the name of the perspective (K – client, f –
finance), and the third symbol is an ordinal number, for example, KK1 is a
target for the top management in the client's perspective.
The first perspective in the
strategic scorecard is the financial perspective. The key area of the company's
strategic goals is the financial indicators that make up the company's success.
The financial perspective mainly includes profitability in terms of profit and
expenses (Table 1).
Tab. 1.
The financial perspective of the strategic
scorecard for
top management in the analysed company
|
Goal |
Metres |
Value of metres |
|
Increase of service revenue (KF1) |
ROS
(return on sales) |
>0 |
|
Increase of asset profitability (KF2) |
ROA (return on assets) |
>0 |
|
Increase of equity profitability (KF3) |
ROE (return on equity) |
>0 |
|
Increase of enterprise productivity (KF4) |
ROI (return on investment) |
>0 |
|
Cost advantage in the industry (KF5) |
Average cost per kilometre in comparison to competitors |
PLN 2.90/km or 10% less than other companies |
In the context of this perspective,
the aim is to increase sales of services to the level of the ROS. Therefore,
all action must be geared towards a high value of the ROS, which will
consequently constitute a competitive advantage.
Another area of activity is the customer service perspective (Table 2). The organisation’s strategic goals from the perspective of the client include increasing the market share of services and improving customer satisfaction with the quality of the provided transport services.
Tab. 2.
Customer perspective strategic scorecard for
top management
|
Goal |
Metres |
Value of metres |
|
Increasing the transport market share (KK1) |
% of the sales of transport services in relation to sales in the segment |
min. 20% |
|
Improving customer loyalty (KK2) |
Number of regular customers increase in the number of customers number of new customers average value of transport orders |
50 35% 20 per month 1600 € |
|
Increasing customer satisfaction (KK3) |
Degree of customer satisfaction share of long-term contracts repeatability of transactions with 1 customer number of complaints |
min. 98% 40% min. 3 per week 0 |
|
Ensuring timely delivery of services (KK4) |
Percentage of orders executed on time |
99% |
|
Improving the company's image (KK5) |
Place in the ranking of the best companies according to customers |
1-5 |
Accordingly, each goal and measure
must be transformed into specific tasks to facilitate the implementation of the
strategy, for example, the company seeks to increase its market share in the
target market (KK1). The position of the company in the market is an important
indicator through which the company can observe its percentage of sales of
transport services with other businesses. Following such an assessment,
managers have the opportunity to take action towards improving the offered
services. Subsequently, the company will maintain its well-established
position, and since the goal of the senior managers is to gain customer loyalty
(KK2), then by taking such actions, the company can even achieve the position
of leadership in the competitive transport market. Hence, in this context,
customer satisfaction (KK3) is the main determinant; customer satisfaction
determines the success of the company. For this reason, it is quite important
to provide transport services in just-in-time and door-to-door systems, as well
as ensure continuous analysis of services, and consequently, their improvement
to meet the highest standards (kk4). Such actions will translate into another
equally important element, namely, the company's image (kk5), upon which the
company can expand the range of services, and thus, maximise the financial
result. The key strategic goal for the analysed enterprise is cost
optimisation. In this aspect, the company seeks to reduce operating costs
(Table 3), which will be measured by the percentage of the load capacity of
each type of vehicle. For large semi-trailers, this is 33-34 euro pallets
(dimensions 80 cm*120 cm), for a solo vehicle – 14-20 pallets, and a bus
8-10 pallets. Therefore, it is the task of the forwarding department to plan
transport routes in such a way as to convey as many goods as possible at the
lowest possible cost. Furthermore, the forwarding department should aim for a
vehicle fill rate of at least 96%.
Tab. 3.
Financial perspective of the balanced scorecard
for the forwarding department
|
Goal |
Metres |
Value of metres |
|
Reduction of operating costs (DF1) |
Filling of cargo space: semi-trailer, solo vehicles, buses up to 3.5 t |
96% 96% 100% |
|
Efficient cost management (DF2) |
Supercharging in the unloading area |
30 per month |
High-quality transport services is a
priority for the analysed company (Table 4). Thus, in the given perspective,
the forwarding department is driven by a single goal - timeliness (Fig. 4).
Tab. 4.
The customers’ perspective of the
balanced scorecard for the forwarding department
|
Goal |
Metres |
Value of metres |
|
Ensuring the punctuality of services (DK1) |
Punctuality of departure from the place of loading, timeliness of arrival at the place of unloading, timeliness of transshipment (if applicable) number of delays, % ETA 2h (estimated time of arrival) |
98% 98% 100% 1 per quarter 70% |
|
Providing customer access to information (DK2) |
Current order status update |
hourly |
The first step in the process of
cargo movement is loading onto the vehicle. The task of the transport
department, together with the warehouse and the driver, is to cooperate
efficiently to meet the deadline (DK1). The analysed company uses the ETA to
provide high-quality services. If the customer is very time-sensitive, the
company offers express or critical transport, which means that the cargo will
be delivered in the shortest possible time. The ETA indicator gives the
customer information about the time of delivery. Towards improving the quality
of service, the top management set an ETA target of 2 hours (that is, the
estimated delivery time may differ from the actual time by a maximum of 2
hours) at 70%. This target applies not only to express shipments but also to
all other shipments, so the company must aim for at least 7 out of 10 to be
delivered to the destination within ≈2 hours of the ETA. Although the
company strives to ensure that all deliveries are carried out timely, however,
in practice, considering unexpected events, delays may occur. The actions of
all functional cells responsible for transport are aimed at eliminating such
issues, and the maximum number of deliveries carried out after the deadline is
1 delivery in 3 months. In terms of high-quality customer service, an equally
important question in the transport department is keeping the customer informed
of the order execution status (DK2).
Fig. 4. Timeliness of deliveries at the
analysed enterprise
The profit of a company offering
services is largely based on the sum of margins on each transaction. To
maximise profit, the analysed company generates the desired margin of 10-20% of
sales (DsF1) (Table 5).
Tab. 5.
Financial perspective of balanced scorecard in
the analysed enterprise
|
Goal |
Metres |
Value of metres |
|
Profit maximisation (DsF1) |
Margin per transaction |
10-20% |
|
Increase in sale revenue (DsF2) |
Amount of sales of transport services |
PLN 50,000 per month |
In addition, the company applies a
preferential pricing policy for regular customers. When the margin is, for
example, 10%, it is applied to new customers to encourage further cooperation.
Another margin value will be determined in the case of express transportation
when the customer is keen on the fast delivery of cargo, and our company, as
one of the few in the region, can offer such a service. Another major goal for
the company is to increase the sale of transport services. Therefore, the
managers strive to ensure that each employee of a given department receives
orders for at least PLN 50,000 every month; according to the financial plan,
exactly such an amount will be optimal for covering the costs of the company's
activities and ensuring financial liquidity. Approximately 50% of the revenue
is to come from the delivery of services to regular customers who, for example,
will have to transport 24-30 tonnes of goods two or three times a week. On the
other hand, around 5-10% of revenue can originate from the orders of customers
who will use the company’s services not less than once a month. The
remaining 40-45% of revenue should be the result of effective negotiations of
freight forwarders with new customers.
5. CONCLUSIONS
The
strategic scorecard is an extremely important element of effective management
in transport companies. It is a tool for implementing the adopted strategy
since it allows determining both specific metrics of strategic goals and a list
of tasks, the implementation of which will allow achieving the desired results
in line with the company's strategy. In this article, the authors developed a
strategic scorecard for the studied company to accurately determine the desired
values, including those from the client's perspective, through which managers
can determine whether the adopted strategy is appropriate or requires
improvement. Subsequently,
the presented scorecard has contributed to the identification of vulnerable
areas in the analysed enterprise. Thus, by taking immediate action, the
company's processes were streamlined, leading to the expansion of activities on
the European market through cooperation with new counterparties. Consequently,
the inclusion of the tool presented in this article in the activities of the
analysed enterprise will ensure success in the long term.
References
1.
Emerling I. 2018. „Balanced scorecard and its role company
management”. Research papers of
Wrocław University of Economics 514: 108-115. ISSN: 1899-3192. DOI: 10.15611/pn.2018.514.10.
2.
Galkin A. 2019. „Mechanisms for increasing of transportation efficiency
using joint service of logistics systems”. Archives of Transport 49(1): 7-24. DOI: 10.5604/01.3001.0013.2770.
3.
Galkin A., V.
Skrypin, E. Kush, K. Vakulenko, V. Dolia. 2017. „Invest Approach to the Transportation Services Cost Formation”. Procedia Engineering 178: 435-442. DOI: 10.1016/j.proeng.2017.01.086.
4.
Naumov V., O.
Kholeva. 2017. „Studying Demand for Freight Forwarding Services in
Ukraine on the Base of Logistics Portals Data”. Procedia Engineering 187: 317-323. DOI:
10.1016/j.proeng.2017.04.381.
5.
Kuśmińska-Fijałkowska
A., Z. Łukasik, J. Kozyra. 2019. „Consolidation as a Key to Success an European Transport Enterprise Case
Study”. TransNav, the International Journal on Marine
Navigation and Safety of Sea Transportation 13: 889-894. DOI: 10.12716/ 1001.13.04.24.
6.
Kuśmińska-Fijałkowska
A., Z. Łukasik, J. Kozyra. 2017. „Noise Reduction in Railway Traffic as an element of Greening of
Transport”. In: Marine Navigation
and Safety of Sea Transportation. CRC Press. DOI: 10.1201/9781315099088-22.
7.
Zhou W., J. Zhang,
H. Chen. 2010. „Service quality evaluation for international freight
forwarder”. Proc. of the 7th Int. Conf. on Service Systems and Service Management. P. 515-519.
8.
Tavassoli M., G.R.
Faramarzi, R.F. Saen 2014. „A joint
measurement of efficiency and effectiveness using network data envelopment
analysis approach in the presence of shared input”. OPSEARCH 52(3): 1-15. DOI: 10.1007/s12597-014-0188-z.
9.
Kholeva O.G. 2017.
„Forming the strategies of sustainable development of
freight forwarders at transportation market”. Науковий
вісник НГУ 3: 129-134.
ISSN: 2071-2227.
10.
Dolia
V., Galkin А.
2013. „Results of
efficiency evaluation of investing alternative projects of transportation
customer service”. Technology Audit
and Production Reserves 5(3-13): 4-6. DOI:
http://dx.doi.org/10.15587/2312-8372.2013.18458.
11.
Melovic
Boban, Slavica Mitrovic, Arton Djokaj, Nikolai Vatin. 2015. „Logistics
in the Function of Customer Service- Relevance for the Engineering
Management”. Procedia Engineering 117(1):
802-807. DOI: 10.1016/j.proeng.2015.08.255.
12.
Dong J.Q., Z.G. Huang,
L. Huang, Z.X. Wu, Y. Do, W. Hai-Ying. 2012. „Enhancing Transport Efficiency by
Hybrid Routing Strategy”. EPL (Europhysics Letters) 99(2):
1-10. DOI: 10.1209/0295-5075/99/20007.
13.
Zimon D., J. Tyan,
R. Sroufe. „Implementing
Sustainable Supply Chain Management: Reactive, Cooperative, and Dynamic Models”. Sustainability
11(24): 1-22. DOI: 10.3390/su11247227.
14.
Monghasemi S., M. Abdallah,
A. Tawfik, C. Clevenger. 2018. „Transportation Planning and Sustainability”. International Conference on Transportation and Development:
265-276. DOI: 10.1061/9780784481561.026.
15.
Ocalir-Akunal Ebru
Vesile. 2016. „Decision Support Systems in Transport Planning”. Procedia Engineering 161: 1119-1126. DOI: 10.1016/j.proeng.2016.08.518.
16.
Dusko Kalenatic,
Karol Viviana Moreno Valbuena, Luz Mancera, et al. 2011. „Methodology of logistics planning based on
project management and system dynamics for business service providers”. Revista Facultad
Deingeniera – Universidad de Antioquia 58: 208-218. ISSN: 0120-6230.
17.
Yi Li, Libin Lu. 2019. „Research on
B2C Reverse Logistics Service Quality Evaluation”. System, Proceedings of the 5th International
Conference on E-Business and Applications: 10-15. DOI: 10.1145/3317614.3317631.
18. Lysenko-Ryba Kateryna. 2017. „The Impact of Reverse Logistics on Customers
Satisfaction”. Przedsiębiorczość
i Zarządzanie XVIII(8): 137-146. ISSN: 2543-8190.
Received 28.01.2021; accepted in revised form 30.04.2021
![]()
Scientific
Journal of Silesian University of Technology. Series Transport is licensed
under a Creative Commons Attribution 4.0 International License