Article
citation information:
Gorzelanczyk, P., Wojtasik, M. Research on air pollutant emissions from transport
sources in Pila. Scientific Journal of
Silesian University of Technology. Series Transport. 2021, 111,
57-74. ISSN: 0209-3324. DOI: https://doi.org/10.20858/sjsutst.2021.111.5.
Piotr GORZELANCZYK[1], Maja WOJTASIK[2]
RESEARCH
ON AIR POLLUTANT EMISSIONS FROM TRANSPORT SOURCES IN PILA
Summary. This article aims
to examine the emission of pollutants utilising transport in
different points of the city in question at two different
intervals, then show whether the means of transport negatively affects the city through pollution.
The study of air pollutant emissions from transport
sources is a key aspect towards
solving problems related to environmental pollution. A study on the measurements of selected PM10 and PM2.5 pollutants to be able to determine the quality of air from transport sources in Pila at different times of the year and with appropriate assumptions regarding the appropriate distance by the road is included
in this article. This study analysed
data on air pollutants and compared it with the results of the Chief Inspectorate
for Environmental Protection.
This made it possible to propose solutions for the
development of the air condition
in Pila.
Keywords: air pollution, transport, exhaust gas emissions, transport sources, environmental protection, smog, internal combustion engines
1. INTRODUCTION
Air pollution is substances that
take various forms, come from an anthropogenic source or are the result of
human activity. Air pollution has a strong impact on the environment and human
health; it causes many diseases for the respiratory and circulatory systems.
The elderly, people with respiratory problems and children are the most
endangered by polluted air. The main reason places have polluted air is because
of high traffic due to exhaust emissions. Therefore, air quality programmes are being introduced to prevent further
deterioration of air quality.
This article aims to present places
in Pila that are most endangered by the emission of air pollutants from
transport sources. For this purpose, an appropriate device for measuring PM10 and PM2.5 pollutants was
used for the study, and then the measurements were compared with data from the
Chief Inspectorate for Environmental Protection (CIEP).
The tests were carried out in eight locations in Pila with the appropriate
assumptions regarding the specified distances by road during measurement. Based
on the obtained measurement results, charts were made to present the value of
pollutants and show how the pollutants changed at a specific time and on a
specific day, and proposed directions for improving the air quality in Pila.
2. AIR POLLUTION
Air pollution plays an important
role in the functioning of the environment and negatively affects the health of
society [3, 10, 13, 16, 22]. These are substances in
solid, liquid or gaseous form, which may be derived from a natural source or
result from human activity (anthropogenic origin). They include carbon dioxide,
sulfur dioxide, nitrogen oxide and dust [20].
Air pollution is influenced by
various factors that cause changes in the atmosphere. They include dust, gas and
aerosol contamination of suspended liquid particles [17].
Due to the type of air pollution,
there is primary and secondary pollution. Primary pollutants occur in the air
in the form in which they were directly released into the atmosphere. However,
secondary pollutants are not emitted from sources; they arise in the atmosphere
from chemical reactions and primary pollutants [1].
The substances that pollute the air
are solid, gaseous or liquid, present in the air in greater amounts than they
should be. Air pollution is one of the most dangerous pollutants because it
spreads very quickly and can contaminate large parts of the environment [34].
There are two sources of air pollution; pollution of natural origin and
pollution of anthropogenic origin [7, 24, 32, 33].
The most common substances that
pollute the atmosphere are primarily carbon dioxide, sulfur dioxide, nitrogen
oxide and dust, which are generated by the intensity of cars, fuel combustion
and production processes. Sulfur dioxide (SO2)
takes a colourless form, a gas with a pungent and
suffocating odour. It has a high specific gravity
(2.93 kg/m3, relative density 2.26),
therefore, spreads slowly in the atmosphere. It is produced by burning large
amounts of fuels containing sulfur. Sulfur dioxide can stay in the air for
several days, allowing it to travel long distances. Carbon dioxide (CO2)
is a colourless gas with an odourless
odour. It is produced through the combustion of
solid, liquid and gaseous fuels. Carbon monoxide (CO) is colourless,
odourless and flammable. It is a highly toxic gas. It
can cause severe asphyxiation. This gas has an extremely low specific gravity
(1.25 kg/m3, relative density 0.97),
allowing it to spread easily in the atmosphere. Other substances that
contribute to air pollution are nitrogen oxides (NO, NO2).
The first is NO, a colourless, toxic gas, and NO2, nitrogen dioxide with a brown colour and a suffocating odour.
Nitrogen oxides are formed during the combustion of fuels at very high
temperatures from cars and ships, and during energy production. They are
responsible for the increased ozone content and the photochemical smog that
occurs [19, 20].
Suspended dust (PM10,
PM2.5) is a mixture of various particle diameters and
chemical compositions. They are harmful to health due to the content of
hazardous elements. Particulate matter is produced during the combustion of
coal in combined heat and power plants, domestic stoves or during public
transport, which plays important roles in everyday life. Due to the particle
diameter, the following are distinguished: PM10 are
fine grains with a diameter of up to 10 micrometres
and PM2.5 grains with a diameter not exceeding 2.5 micrometres. Dust is a transboundary pollutant, which means
that PM10 is transported up to 1000 km, while PM2.5 is transported up to 2500 km [19].
Toxic exhaust fumes, which are
generated while driving, also contribute to polluted air. The exhaust fumes are
released from the exhaust pipes, polluting the natural environment, adversely
affecting the functioning of society with attendant problems, for example, with
the respiratory tract. Toxic exhaust gases include carbon monoxide (CO),
hydrocarbons (HC), nitrogen oxides (NOx), sulfur oxides (SOx), solid particles
(PM) [25].
Environmental pollution is
associated with the unfavourable phenomena that
currently occur in the natural environment. These include smog, ozone hole,
acid rain, and the greenhouse effect; all of these phenomena have an impact on
the environment and human health.
The problem of air pollution caused
by using transport has been analysed in many
publications. Idzior et al. presented the problem
related to air pollution by particulate matter PM10
and PM 2.5 in urban agglomerations [8], while Sówka
[23] analysed road transport as a source of air
pollution in cities [28]. The study [27] investigates the impact of pollution
caused by various means of transport. And the works [11, 31] include the
prevention of air pollution in the transport sector is important for the future
improvement of air quality.
2. AIR POLLUTION IN POLAND
Smog in Poland is a
common phenomenon, every year more cities are polluted by this phenomenon.
Against the background of the European Union, Poland comes out negatively when
it comes to polluted air [2]. Smog occurs cyclically, but it is most noticeable
in the heating season (autumn-winter) due to many negative factors such as
burning in stoves with poor quality coal, burning rubbish or rapidly developing
car transport. In Poland’s large cities, industrial plants, coal-fired
power plants, households and transport are sources of polluted air [26].
Examples of provinces
belonging to the most polluted are Śląskie
and Łódzkie [29]. Pollution accumulates
in highly urbanised cities; an exemplary city is
Krakow. Smog in Krakow is a serious problem that negatively affects the health
of its society and environment, mainly in the autumn and winter period. In
2016, in Krakow, the level of PM10 pollution for the
average daily concentration standard was as high as 188 times [26].
Considering the
information contained in the Directive of the European Parliament and of the
Council of 21 May 2008 on cleaner air quality for Europe, the maximum allowable
average annual standard for PM10 dust concentration
is 40 µg/m³, and for PM2.5
it is 25 µg/m³ [12]. A summary of the
annual average of the ten most polluted cities in Poland is presented in Table 1,
and the ranges of permissible concentrations for individual pollutants are
included in Table 2.
Tab. 1
A comparison of the
annual average of the ten most polluted cities in Poland [30]
|
City together with the province |
The concentration level of PM2.5
impurities |
The concentration level of PM10
impurities |
|
Żywiec - voiv. śląskie |
43 µg/m³ |
58 µg/m³ |
|
Pszczyna - voiv. śląskie |
43 µg/m³ |
58 µg/m³ |
|
Rybnik - voiv. śląskie |
40 µg/m³ |
53 µg/m³ |
|
Wodzisław Śląski - voiv.
śląskie |
39 µg/m³ |
53 µg/m³ |
|
Opoczno - voiv. łódzkie |
39 µg/m³ |
53 µg/m³ |
|
Sucha Beskidzka - voiv. małopolskie |
39 µg/m³ |
53 µg/m³ |
|
Krakow - voiv.
małopolskie |
37 µg/m³ |
51 µg/m³ |
|
Skawina - voiv. małopolskie |
37 µg/m³ |
51 µg/m³ |
|
Nowy Sącz - voiv. małopolskie |
36 µg/m³ |
50 µg/m³ |
|
Niepołomice - voiv. małopolskie |
36 µg/m³ |
45 µg/m³ |
Tab. 2
The range of permissible
concentrations of individual pollutants [15]
|
Air quality index |
PM10 |
PM2,5 |
O3 |
NO2 |
SO2 |
C6H6 |
CO |
|
Very good |
0-20 |
0-13 |
0-70 |
0-40 |
0-50 |
0-6 |
0-3 |
|
Good |
20.1-50 |
13.1-35 |
70.1-120 |
40.1-100 |
50.1-100 |
6.1-11 |
3.1-7 |
|
Moderate |
50.1-80 |
35.1-55 |
120.1-150 |
100.1-150 |
100.1-200 |
11.1-16 |
7.1-11 |
|
Sufficient |
80.1-110 |
55.1-75 |
150.1-180 |
150.1-200 |
200.1-350 |
16.1-21 |
11.1-15 |
|
Bad |
110.1-150 |
75.1-110 |
180.1-240 |
200.1-400 |
350.1-500 |
21.1-51 |
15.1-21 |
|
Very bad |
>150 |
>110 |
>240 |
>400 |
>500 |
>51 |
>21 |
Referring to the
above-mentioned annual average for the ten most polluted cities in Poland, we
noted that the obtained measurements exceed the maximum permissible dust
concentrations specified in the directive. The main reason for air pollution is
low emissions, which is related to the heating of apartments, and transport and
industry contribute to exceeding the standards.
4. METHODS OF TESTING AIR POLLUTANT
EMISSIONS FROM TRANSPORT SOURCES
Each city or country in
the world deals with the improvement of air quality with the help of a fixed
measurement station that analyses and measures the level of PM10,
PM2.5 particulate matter and other air pollutants.
The methodology of these measurements is included in the Directive of the
European Parliament and of the Council of 21 May 2008 on ambient air quality
and cleaner air for Europe [6]. The rules for the location of measuring
stations are also indicated in the Regulation of the Minister of the Environment
of 13 September 2012 on the assessment of the levels of substances in the air [21].
The Inspection of
Environmental Protection uses two methods to measure suspended dust: the
gravimetric method and the reference method. The advantages
of these methods are a very high accuracy and the automatic methods. These
methods are
equivalent to the gravimetric method. The gravimetric (manual) method is
performed for 24 hours; it consists of the use of dust collectors wherein
filters are placed to suck the air. Every two weeks, 14 disposable filters are
put on and the device changes them automatically. Before inserting the filter
into the extractor, the filters are weighed and reweighed after 14 days in the
laboratory. On this basis, the dust concentrations are calculated. This method
is used in Poland, Europe and the United States. However, in the automatic
method, automatic metres which measure the
concentration of dust on an ongoing basis are used, thanks to which we can
obtain a given measurement result every hour [15].
Currently, there is one
measuring station in Pila belonging to the Chief Inspector of Environmental
Protection. It measures individual pollutants (PM10, NO2, CO) and is located on Kusocinski
Street. The measuring station is shown in Figure 1.
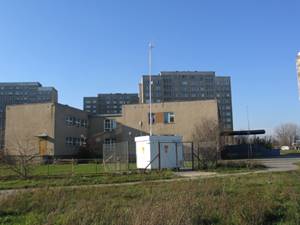
Fig. 1. Measuring
station in Pila at Kusocinskiego Street [4]
5. RESEARCH
5.1. Purpose of research
This study aimed to
measure air pollutant emissions from transport sources in eight places in the
city of Pila. The Laser Air Quality Monitor-SDL607
device (Figure 2) was used to perform the measurements, designed to measure
specific pollutants (PM10 and PM2.5).
The sensor is designed to measure PM2.5 and PM10 dust, measure pollutants using laser light and collect
air samples that were analysed. The sensor has the parameters listed in Table 3.
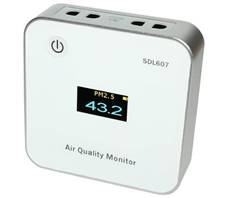
Fig. 2.
Laser Air Quality Monitor - SDL607 [18]
Tab. 3
SDL607 device parameters [18]
|
SDL607 device parameters |
|
|
PM2.5 measurement
range |
0-999.9 µg/m³ |
|
PM2.5 resolution |
0.1 µg/m³ |
|
The detection range of the PM10 |
0-999.9 µg/m³ |
|
PM10 resolution |
0.1 µg/m³ |
|
The minimum size of the detected particle |
0.3 µg/m³ |
5.2. Subject of study
The subject of this
research is the emission of air pollutants from transport sources in Pila, it
aims to show that road transport is a significant source of environmental
pollution, harmful to human health. This study was carried out in the city of
Pila, and precisely in 8 selected places, the measurements were compared
between individual places and the overall results from the CIEP
measuring station. The places where the tests were carried out and the location
of the CIEP measuring station are presented in the
figure below.
Pila is a city in
northwestern Poland, in the Wielkopolska Province, Pilski County. Most of which are forests, parks and lakes.
It belongs to a city with a well-developed technical infrastructure. Thanks to
it, there are many opportunities for the development of the economy. In the
Pila poviat, the electronic industry, agri-food processing and tourism are available, which are
important elements for visiting tourists due to the landscape views. There are
also shopping and service centres. Pila is located
near national roads no. 10 and 11 and provincial roads no. 179, 180 and 188. It
crosses the road and railroads leading from the coast to the south, to Poznań, Gorzów, and
even Germany, and from Szczecin and Świnoujście
to Bydgoszcz, Toruń and Warsaw. In 2011, the
construction of the bypass in Pila was completed; the bypass was to improve
traffic between settlements, bypassing the city itself. Furthermore, it is
worth mentioning the well-developed railway infrastructure, which enables connection
with major Polish cities. The city's infrastructure provides its inhabitants
with good living conditions, which increases the standard of living [9].
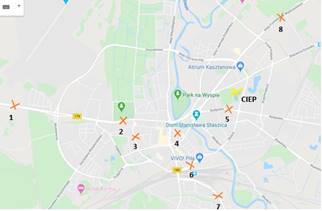
Fig. 3. Map of Pila with marked places of the
performed examination [14]
When selecting places in
Pila for the study of air pollutant emissions from transport sources, specific
factors were considered, such as heavy traffic, the very centre
of the city, places near shopping malls, schools, supermarkets, streets leading
to the city of Pila, as well as streets surrounded by single-family houses. On
this basis, the emission of pollutants in the city of Pila was analysed.
The study was divided
into two stages: the first stage concerned measurements made at the turn of
November and December, and the second stage, in February and March.
Measurements were taken 24 hours a day, seven days a week for each point
selected. Measurements were made on both sides of the street, on the left and
on the right, considering the specified distances: at the very edge of the
street, 1 m from the street, 2 m, 3 m and 4 m. During the test, accompanying
measurements were made too, such as traffic volume, traffic conditions
atmospheric conditions (wind force, direction and pressure). Figure 4 shows the
scheme of making measurements relative to the road while maintaining
appropriate distances.
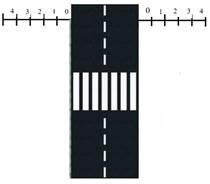
Fig. 4.
Diagram of the road with defined distances when taking measurements [5]
5.3. Findings
The first stage of the
research was carried out at the turn of November and December, and the second
stage in February and March, in eight selected locations in Pila. The
measurement results are presented in the table below, divided into PM2.5 and PM10 pollutants. During
the research, measurements for PM10 pollution were analysed by the measurement station in Pila – CIEP. In addition, the strength and direction of the wind,
pressure and traffic volume per 1 hour were considered, and the results of PM10 were compared with the results of CIEP.
Data are the weekly average for each sampling point and the specified
pollutant.
Tab. 4
Weekly average of
measurements for PM2.5 pollution for the first series
of measurements
|
Measurement point/time |
Point
1 |
Point
2 |
Point
3 |
Point
4 |
Point
5 |
Point
6 |
Point
7 |
Point
8 |
|
00:00 |
16.06 |
13.59 |
23.40 |
16.88 |
24.84 |
18.39 |
26.62 |
21.84 |
|
01:00 |
15.80 |
13.00 |
20.31 |
18.35 |
21.59 |
18.88 |
24.13 |
19.49 |
|
02:00 |
16.71 |
12.35 |
17.87 |
16.55 |
19.02 |
16.56 |
21.91 |
17.39 |
|
03:00 |
15.04 |
10.64 |
17.43 |
16.22 |
18.73 |
15.97 |
21.94 |
16.53 |
|
04:00 |
14.37 |
9.72 |
21.56 |
15.38 |
21.54 |
14.51 |
25.80 |
19.58 |
|
05:00 |
14.63 |
9.42 |
21.21 |
16.00 |
23.19 |
15.79 |
26.73 |
21.38 |
|
06:00 |
15.85 |
10.45 |
20.14 |
17.06 |
22.91 |
15.95 |
26.29 |
20.37 |
|
07:00 |
16.10 |
11.75 |
17.43 |
17.17 |
20.42 |
15.81 |
24.00 |
19.12 |
|
08:00 |
16.08 |
13.03 |
17.96 |
17.60 |
20.76 |
17.18 |
25.87 |
20.35 |
|
09:00 |
15.61 |
13.64 |
20.58 |
16.85 |
22.89 |
17.76 |
26.93 |
20.54 |
|
10:00 |
16.06 |
15.75 |
21.05 |
18.96 |
25.96 |
18.58 |
29.61 |
20.96 |
|
11:00 |
17.95 |
17.46 |
19.53 |
19.80 |
25.45 |
18.65 |
28.65 |
21.62 |
|
12:00 |
18.96 |
18.92 |
18.18 |
20.47 |
23.77 |
19.87 |
27.05 |
22.29 |
|
13:00 |
19.48 |
14.69 |
16.69 |
23.04 |
21.31 |
19.74 |
26.16 |
18.29 |
|
14:00 |
18.10 |
14.03 |
13.58 |
19.20 |
16.50 |
17.50 |
20.69 |
17.83 |
|
15:00 |
16.66 |
15.95 |
12.97 |
18.52 |
14.79 |
16.25 |
20.28 |
16.58 |
|
16:00 |
18.48 |
14.56 |
15.24 |
21.60 |
19.22 |
17.30 |
24.83 |
19.54 |
|
17:00 |
20.35 |
15.95 |
18.22 |
21.74 |
22.59 |
19.88 |
29.92 |
22.47 |
|
18:00 |
19.58 |
16.35 |
20.41 |
20.28 |
25.44 |
19.76 |
33.34 |
25.62 |
|
19:00 |
20.93 |
18.83 |
23.57 |
22.09 |
27.59 |
22.22 |
35.24 |
26.58 |
|
20:00 |
21.13 |
20.84 |
26.66 |
21.45 |
29.36 |
24.56 |
36.68 |
28.90 |
|
21:00 |
20.24 |
22.80 |
25.51 |
22.22 |
28.95 |
23.01 |
33.39 |
27.71 |
|
22:00 |
19.80 |
20.48 |
24.45 |
20.80 |
27.33 |
24.09 |
30.93 |
27.45 |
|
23:00 |
18.40 |
22.82 |
24.73 |
20.01 |
27.59 |
22.88 |
33.07 |
29.83 |
Tab. 5
Weekly average of
measurements for PM10 pollution for points 1-4 for
the first series of measurements
|
Measure- ment
point / time |
Point 1 |
Point 2 |
Point 3 |
Point 4 |
||||||||
|
Results |
CIEP |
Standard deviation |
Results |
CIEP |
Standard deviation |
Results |
CIEP |
Standard deviation |
Results |
CIEP |
Standard deviation |
|
|
00:00 |
22.24 |
31.77 |
6.73 |
17.34 |
23.50 |
4.35 |
26.54 |
29.12 |
1.82 |
22.39 |
29.10 |
4.75 |
|
01:00 |
22.44 |
30.10 |
5.41 |
17.10 |
21.90 |
3.39 |
23.27 |
25.68 |
1.71 |
22.87 |
28.25 |
3.80 |
|
02:00 |
21.07 |
26.73 |
4.00 |
15.10 |
19.17 |
2.88 |
21.41 |
24.22 |
1.98 |
22.00 |
25.45 |
2.44 |
|
03:00 |
19.36 |
26.28 |
4.90 |
13.00 |
19.30 |
4.45 |
20.11 |
20.45 |
0.24 |
21.16 |
23.38 |
1.57 |
|
04:00 |
19.60 |
24.56 |
3.51 |
12.61 |
14.60 |
1.40 |
23.99 |
20.30 |
2.61 |
20.70 |
22.33 |
1.15 |
|
05:00 |
20.27 |
25.23 |
3.51 |
12.89 |
14.38 |
1.06 |
24.41 |
21.89 |
1.79 |
22.36 |
22.93 |
0.40 |
|
06:00 |
21.87 |
23.53 |
1.17 |
12.94 |
15.67 |
1.93 |
23.04 |
20.63 |
1.71 |
22.44 |
21.76 |
0.48 |
|
07:00 |
21.60 |
25.08 |
2.46 |
15.73 |
17.55 |
1.29 |
21.80 |
19.30 |
1.77 |
22.77 |
23.93 |
0.82 |
|
08:00 |
21.33 |
25.02 |
2.61 |
17.54 |
18.93 |
0.98 |
22.07 |
20.39 |
1.19 |
22.36 |
25.00 |
1.87 |
|
09:00 |
20.27 |
25.37 |
3.60 |
18.64 |
18.58 |
0.04 |
23.80 |
21.76 |
1.44 |
22.06 |
25.60 |
2.51 |
|
10:00 |
22.39 |
17.75 |
3.28 |
20.10 |
17.34 |
1.95 |
24.69 |
20.10 |
3.24 |
23.74 |
20.53 |
2.27 |
|
11:00 |
23.89 |
19.27 |
3.27 |
23.99 |
19.23 |
3.36 |
23.33 |
23.93 |
0.43 |
24.94 |
25.05 |
0.08 |
|
12:00 |
23.56 |
19.35 |
2.97 |
24.17 |
18.89 |
3.74 |
21.89 |
16.26 |
3.98 |
24.70 |
24.68 |
0.01 |
|
13:00 |
24.11 |
20.12 |
2.83 |
19.41 |
16.27 |
2.22 |
19.10 |
11.08 |
5.67 |
26.37 |
22.13 |
3.00 |
|
14:00 |
22.71 |
18.40 |
3.05 |
17.17 |
14.11 |
2.16 |
14.90 |
13.50 |
0.99 |
26.01 |
18.66 |
5.20 |
|
15:00 |
22.17 |
17.04 |
3.63 |
15.61 |
13.01 |
1.84 |
14.70 |
12.04 |
1.88 |
22.81 |
16.27 |
4.63 |
|
16:00 |
23.57 |
18.70 |
3.44 |
17.66 |
12.67 |
3.53 |
17.04 |
16.40 |
0.45 |
24.00 |
19.04 |
3.51 |
|
17:00 |
25.20 |
21.14 |
2.87 |
20.39 |
15.23 |
3.65 |
20.43 |
21.04 |
0.43 |
26.74 |
23.13 |
2.56 |
|
18:00 |
23.37 |
22.96 |
0.29 |
20.43 |
18.53 |
1.34 |
22.31 |
25.10 |
1.97 |
26.04 |
25.63 |
0.29 |
|
19:00 |
25.14 |
27.49 |
1.66 |
21.29 |
21.76 |
0.33 |
26.47 |
27.77 |
0.92 |
28.21 |
29.34 |
0.80 |
|
20:00 |
26.81 |
28.96 |
1.52 |
24.14 |
25.20 |
0.75 |
29.87 |
31.07 |
0.85 |
28.20 |
30.69 |
1.76 |
|
21:00 |
24.73 |
26.44 |
1.21 |
25.61 |
25.57 |
0.03 |
28.14 |
31.54 |
2.40 |
27.77 |
30.09 |
1.64 |
|
22:00 |
24.83 |
23.33 |
1.06 |
24.80 |
26.20 |
0.99 |
27.87 |
32.53 |
3.29 |
26.21 |
27.93 |
1.21 |
|
23:00 |
22.79 |
21.37 |
1.00 |
25.93 |
29.78 |
2.73 |
28.29 |
33.86 |
3.94 |
24.87 |
26.06 |
0.84 |
Tab. 6
Weekly average of
measurements for PM10 pollution for points 5-8 for
the first series of measurements
|
Measure- ment
point / time |
Point 5 |
Point 6 |
Point 7 |
Point 8 |
||||||||
|
Results |
CIEP |
Standard deviation |
Results |
CIEP |
Standard deviation |
Results |
CIEP |
Standard deviation |
Results |
CIEP |
Standard deviation |
|
|
00:00 |
27.19 |
30.92 |
2.64 |
23.29 |
30.48 |
5.09 |
27.93 |
30.92 |
2.11 |
25.47 |
29.63 |
2.94 |
|
01:00 |
23.19 |
25.82 |
1.86 |
22.44 |
29.08 |
4.70 |
25.37 |
25.82 |
0.31 |
22.03 |
24.80 |
1.96 |
|
02:00 |
21.64 |
25.17 |
2.49 |
20.16 |
25.33 |
3.66 |
23.54 |
25.17 |
1.15 |
20.94 |
23.77 |
2.00 |
|
03:00 |
21.04 |
21.43 |
0.28 |
19.16 |
24.47 |
3.75 |
24.56 |
21.43 |
2.21 |
19.80 |
19.62 |
0.13 |
|
04:00 |
24.19 |
19.27 |
3.47 |
18.07 |
22.19 |
2.91 |
28.32 |
19.27 |
6.40 |
21.43 |
16.90 |
3.20 |
|
05:00 |
26.01 |
20.46 |
3.93 |
19.20 |
22.51 |
2.34 |
29.19 |
20.46 |
6.18 |
23.84 |
17.74 |
4.31 |
|
06:00 |
26.27 |
21.83 |
3.14 |
19.20 |
20.94 |
1.23 |
28.59 |
21.83 |
4.78 |
24.48 |
19.24 |
3.71 |
|
07:00 |
23.30 |
21.99 |
0.93 |
20.60 |
22.53 |
1.37 |
27.65 |
21.99 |
4.00 |
23.90 |
19.80 |
2.90 |
|
08:00 |
24.49 |
21.94 |
1.80 |
22.36 |
23.37 |
0.71 |
28.75 |
21.94 |
4.81 |
23.70 |
20.53 |
2.24 |
|
09:00 |
26.07 |
22.39 |
2.61 |
21.83 |
23.72 |
1.34 |
30.91 |
22.39 |
6.03 |
24.28 |
20.97 |
2.34 |
|
10:00 |
29.18 |
26.14 |
2.15 |
21.89 |
14.77 |
5.03 |
32.67 |
26.14 |
4.61 |
25.72 |
23.59 |
1.51 |
|
11:00 |
29.70 |
27.71 |
1.40 |
21.93 |
16.60 |
3.77 |
31.72 |
27.71 |
2.83 |
26.01 |
25.43 |
0.41 |
|
12:00 |
27.11 |
20.38 |
4.76 |
23.84 |
17.58 |
4.43 |
30.32 |
20.38 |
7.03 |
24.50 |
18.62 |
4.16 |
|
13:00 |
24.20 |
16.20 |
5.66 |
23.94 |
17.73 |
4.39 |
29.10 |
16.20 |
9.12 |
24.31 |
13.82 |
7.42 |
|
14:00 |
19.29 |
16.81 |
1.75 |
21.29 |
16.20 |
3.60 |
23.92 |
16.81 |
5.03 |
24.21 |
14.61 |
6.78 |
|
15:00 |
18.04 |
17.07 |
0.69 |
20.06 |
14.41 |
3.99 |
22.65 |
17.07 |
3.94 |
21.85 |
14.44 |
5.23 |
|
16:00 |
21.80 |
20.40 |
0.99 |
19.64 |
15.27 |
3.09 |
26.83 |
20.40 |
4.55 |
23.74 |
16.97 |
4.79 |
|
17:00 |
25.61 |
23.46 |
1.53 |
23.11 |
18.37 |
3.35 |
30.77 |
23.46 |
5.17 |
25.31 |
20.69 |
3.27 |
|
18:00 |
28.14 |
26.30 |
1.30 |
22.79 |
21.11 |
1.18 |
33.93 |
26.30 |
5.40 |
29.12 |
24.46 |
3.30 |
|
19:00 |
30.16 |
28.59 |
1.11 |
23.10 |
25.30 |
1.56 |
36.54 |
28.59 |
5.62 |
30.88 |
26.40 |
3.17 |
|
20:00 |
32.34 |
30.49 |
1.31 |
27.56 |
28.31 |
0.54 |
38.74 |
30.49 |
5.83 |
31.78 |
29.84 |
1.37 |
|
21:00 |
31.29 |
29.87 |
1.00 |
27.34 |
27.06 |
0.20 |
34.79 |
29.87 |
3.48 |
31.70 |
30.49 |
0.86 |
|
22:00 |
29.59 |
29.76 |
0.12 |
28.30 |
26.27 |
1.43 |
33.27 |
29.76 |
2.48 |
32.02 |
32.70 |
0.48 |
|
23:00 |
31.36 |
30.37 |
0.70 |
26.53 |
25.06 |
1.04 |
35.66 |
30.37 |
3.74 |
34.45 |
34.06 |
0.28 |
After analysing the obtained measurements, it can be observed
that the degree of pollution did not reach the maximum, bad value assumed for PM10 > 200 µg/m3,
and PM2.5 > 120 µg/m3.
The pollution level was classified to the level of moderate and good quality.
Comparing the obtained measurements with the measurements from CIEP, we observed that they were varied, everything
depended on the day and the factors contributing to it. The highest values were
achieved in the mornings and evenings, where the heating of houses contributed
the most to the pollution level, in winter, it is normal that more coal was
burned in domestic stoves. Exhaust emissions also contributed to higher values,
sometimes in rush hours, the values increased, depending on which street the
pollutant emissions were measured on. The values were much higher from Monday
to Friday than on weekends. After analysing the
measurements, we observed that the values were greater when measuring the
measurements along the road, whereas the further we moved away, the smaller the
values became, the reason for this was the escaping exhaust fumes, that is, they had a shorter distance to the device used to measure
the measurements. The exception was point 7, the measured values on the right
side were the opposite, that is, the closer to the road, the smaller the value,
and the further it is, the reason for this are single-family houses located
there. The results from CIEP were similar to the
results in point 5, due to its proximity to the measurement.
The wind force had a
great influence on the measurement value because the higher the wind force, the
lower the pollution value, as then the dust was blown by the wind and the
pollution did not accumulate around itself. Moreover, the amount of traffic
influenced the amount of pollution.
The second stage of the
research was carried out at the turn of February and March. As in the first
measurement, during the research, measurements for PM10
pollution were similarly analysed by the measurement
station in Pila – CIEP. In addition, the
strength and direction of the wind, pressure and traffic volume per 1 hour were
considered, and the standard deviation from the given measurements was
calculated as well. Data are the weekly mean for every single point and the
specified pollutant.
Tab. 7
Weekly average of
measurements for PM2.5 pollution for the second
series of measurements
|
Measurement point/time |
Point
1 |
Point
2 |
Point
3 |
Point
4 |
Point
5 |
Point
6 |
Point
7 |
Point
8 |
|
00:00 |
10.87 |
11.70 |
10.83 |
12.30 |
10.77 |
11.25 |
11.15 |
10.48 |
|
01:00 |
12.03 |
14.25 |
14.62 |
12.55 |
11.87 |
14.24 |
12.90 |
11.73 |
|
02:00 |
11.64 |
13.76 |
11.31 |
13.48 |
12.28 |
10.25 |
12.80 |
11.40 |
|
03:00 |
10.20 |
11.86 |
12.42 |
12.91 |
12.46 |
10.83 |
13.26 |
10.50 |
|
04:00 |
9.71 |
13.70 |
12.24 |
11.36 |
11.45 |
13.74 |
12.32 |
9.31 |
|
05:00 |
10.64 |
11.07 |
11.61 |
10.20 |
10.42 |
12.06 |
10.71 |
9.50 |
|
06:00 |
10.10 |
11.29 |
11.21 |
9.01 |
9.34 |
11.88 |
10.92 |
9.74 |
|
07:00 |
9.76 |
10.41 |
12.32 |
8.82 |
9.62 |
12.04 |
11.61 |
8.27 |
|
08:00 |
9.83 |
12.40 |
15.11 |
9.87 |
9.48 |
14.73 |
11.71 |
9.02 |
|
09:00 |
12.89 |
13.33 |
15.19 |
11.38 |
9.88 |
16.28 |
12.08 |
9.86 |
|
10:00 |
11.59 |
11.44 |
14.37 |
8.97 |
9.20 |
14.89 |
11.40 |
8.26 |
|
11:00 |
9.82 |
11.66 |
11.83 |
9.21 |
8.26 |
12.68 |
10.80 |
8.09 |
|
12:00 |
9.81 |
11.23 |
11.44 |
8.93 |
8.68 |
12.24 |
10.96 |
7.98 |
|
13:00 |
9.79 |
11.14 |
11.70 |
11.07 |
9.74 |
12.43 |
12.12 |
9.19 |
|
14:00 |
9.38 |
11.68 |
12.03 |
12.50 |
8.70 |
14.55 |
10.89 |
10.44 |
|
15:00 |
10.31 |
11.66 |
12.34 |
12.62 |
10.17 |
14.21 |
11.16 |
10.47 |
|
16:00 |
8.90 |
10.56 |
10.44 |
12.21 |
9.60 |
12.73 |
10.80 |
9.20 |
|
17:00 |
8.59 |
10.64 |
11.03 |
9.95 |
8.91 |
12.25 |
10.51 |
8.19 |
|
18:00 |
8.64 |
10.70 |
11.45 |
11.44 |
9.85 |
12.80 |
11.22 |
8.89 |
|
19:00 |
11.64 |
13.37 |
12.51 |
11.07 |
11.01 |
11.66 |
13.40 |
8.95 |
|
20:00 |
14.53 |
15.82 |
15.02 |
11.14 |
11.79 |
16.32 |
15.97 |
10.20 |
|
21:00 |
14.42 |
17.31 |
16.72 |
14.28 |
12.37 |
15.29 |
16.23 |
10.93 |
|
22:00 |
11.80 |
14.17 |
13.39 |
13.46 |
14.05 |
12.12 |
18.30 |
13.08 |
|
23:00 |
11.09 |
12.13 |
12.34 |
10.82 |
14.05 |
11.79 |
16.41 |
11.05 |
Tab. 8
Weekly average of
measurements for PM10 pollution for points 1-4
for the second series of measurements
|
Measure- ment
point / time |
Point 1 |
Point 2 |
Point 3 |
Point 4 |
||||||||
|
Results |
CIEP |
Standard deviation |
Results |
CIEP |
Standard deviation |
Results |
CIEP |
Standard deviation |
Results |
CIEP |
Standard deviation |
|
|
00:00 |
12.29 |
17.60 |
3.76 |
13.21 |
17.60 |
3.10 |
12.06 |
17.60 |
3.92 |
13.76 |
16.69 |
2.07 |
|
01:00 |
13.73 |
19.52 |
4.09 |
16.01 |
19.52 |
2.48 |
15.79 |
19.52 |
2.64 |
14.03 |
17.89 |
2.73 |
|
02:00 |
12.73 |
21.26 |
6.03 |
14.99 |
21.26 |
4.43 |
13.06 |
21.26 |
5.80 |
14.97 |
17.30 |
1.65 |
|
03:00 |
11.64 |
18.01 |
4.51 |
13.04 |
18.01 |
3.52 |
13.46 |
18.01 |
3.22 |
14.26 |
17.64 |
2.39 |
|
04:00 |
11.40 |
16.90 |
3.89 |
15.11 |
16.90 |
1.26 |
13.66 |
16.90 |
2.29 |
12.89 |
17.00 |
2.91 |
|
05:00 |
12.13 |
13.87 |
1.23 |
11.94 |
13.87 |
1.36 |
13.03 |
13.87 |
0.59 |
11.21 |
13.90 |
1.90 |
|
06:00 |
11.36 |
10.66 |
0.50 |
12.91 |
10.66 |
1.60 |
12.31 |
10.66 |
1.17 |
10.26 |
12.00 |
1.23 |
|
07:00 |
11.13 |
11.73 |
0.43 |
12.34 |
11.73 |
0.43 |
13.79 |
11.73 |
1.45 |
10.17 |
9.71 |
0.32 |
|
08:00 |
11.97 |
15.48 |
2.48 |
14.24 |
15.48 |
0.88 |
16.47 |
15.48 |
0.70 |
11.46 |
10.26 |
0.85 |
|
09:00 |
14.20 |
16.27 |
1.46 |
15.16 |
16.27 |
0.79 |
16.84 |
16.27 |
0.40 |
12.66 |
10.60 |
1.45 |
|
10:00 |
13.04 |
16.93 |
2.75 |
13.07 |
16.93 |
2.73 |
15.89 |
16.93 |
0.74 |
10.34 |
11.39 |
0.74 |
|
11:00 |
11.16 |
13.29 |
1.51 |
12.96 |
13.29 |
0.23 |
13.07 |
13.29 |
0.15 |
10.31 |
10.56 |
0.17 |
|
12:00 |
11.09 |
11.63 |
0.38 |
12.44 |
11.63 |
0.58 |
12.77 |
11.63 |
0.81 |
10.04 |
8.16 |
1.33 |
|
13:00 |
12.21 |
11.09 |
0.80 |
13.14 |
11.09 |
1.45 |
12.94 |
11.09 |
1.31 |
12.47 |
10.28 |
1.55 |
|
14:00 |
13.10 |
9.99 |
2.20 |
13.59 |
9.99 |
2.55 |
13.87 |
9.99 |
2.75 |
14.11 |
11.98 |
1.51 |
|
15:00 |
12.99 |
10.96 |
1.43 |
14.46 |
10.96 |
2.47 |
13.74 |
10.96 |
1.97 |
14.27 |
8.62 |
4.00 |
|
16:00 |
11.59 |
10.94 |
0.45 |
13.16 |
10.94 |
1.57 |
11.84 |
10.94 |
0.64 |
14.00 |
7.89 |
4.32 |
|
17:00 |
10.57 |
9.83 |
0.53 |
12.19 |
9.83 |
1.67 |
12.57 |
9.83 |
1.94 |
11.34 |
9.73 |
1.14 |
|
18:00 |
9.80 |
10.13 |
0.23 |
12.16 |
10.13 |
1.43 |
12.77 |
10.13 |
1.87 |
12.74 |
9.67 |
2.17 |
|
19:00 |
12.91 |
12.71 |
0.14 |
15.03 |
12.71 |
1.64 |
14.13 |
12.71 |
1.00 |
12.73 |
10.21 |
1.78 |
|
20:00 |
16.07 |
17.61 |
1.09 |
17.67 |
17.61 |
0.04 |
16.73 |
17.61 |
0.63 |
12.41 |
13.14 |
0.52 |
|
21:00 |
16.36 |
21.97 |
3.97 |
19.44 |
21.97 |
1.79 |
18.50 |
21.97 |
2.45 |
15.77 |
16.49 |
0.51 |
|
22:00 |
13.41 |
18.11 |
3.32 |
15.91 |
18.11 |
1.56 |
15.10 |
18.11 |
2.13 |
14.83 |
14.93 |
0.07 |
|
23:00 |
12.43 |
16.53 |
2.90 |
13.96 |
16.53 |
1.82 |
13.94 |
16.53 |
1.83 |
11.93 |
16.64 |
3.33 |
Tab. 9
Weekly average of
measurements for PM10 pollution for points 5-8 for
the second series of measurements
|
Measure- ment
point / time |
Point 5 |
Point 6 |
Point 7 |
Point 8 |
||||||||
|
Results |
CIEP |
Standard deviation |
Results |
CIEP |
Standard deviation |
Results |
CIEP |
Standard deviation |
Results |
CIEP |
Standard deviation |
|
|
00:00 |
12.70 |
16.69 |
2.82 |
12.47 |
17.60 |
3.63 |
13.10 |
16.69 |
2.54 |
12.13 |
16.69 |
3.22 |
|
01:00 |
13.49 |
17.89 |
3.11 |
12.07 |
19.52 |
5.26 |
14.80 |
17.89 |
2.18 |
13.03 |
17.89 |
3.43 |
|
02:00 |
13.63 |
17.30 |
2.60 |
11.53 |
21.26 |
6.88 |
15.00 |
17.30 |
1.63 |
12.77 |
17.30 |
3.20 |
|
03:00 |
13.73 |
17.64 |
2.77 |
12.23 |
18.01 |
4.09 |
15.24 |
17.64 |
1.70 |
12.20 |
17.64 |
3.85 |
|
04:00 |
12.64 |
17.00 |
3.08 |
14.97 |
16.90 |
1.36 |
14.39 |
17.00 |
1.85 |
10.89 |
17.00 |
4.32 |
|
05:00 |
11.50 |
13.90 |
1.70 |
13.03 |
13.87 |
0.59 |
12.59 |
13.90 |
0.93 |
10.79 |
13.90 |
2.20 |
|
06:00 |
10.43 |
12.00 |
1.11 |
13.29 |
10.66 |
1.86 |
12.97 |
12.00 |
0.69 |
10.74 |
12.00 |
0.89 |
|
07:00 |
11.06 |
9.71 |
0.95 |
13.87 |
11.73 |
1.51 |
12.96 |
9.71 |
2.29 |
9.67 |
9.71 |
0.03 |
|
08:00 |
24.09 |
10.26 |
9.78 |
16.59 |
15.48 |
0.78 |
13.29 |
10.26 |
2.14 |
10.16 |
10.26 |
0.07 |
|
09:00 |
11.07 |
10.60 |
0.33 |
17.57 |
16.27 |
0.92 |
13.60 |
10.60 |
2.12 |
11.17 |
10.60 |
0.40 |
|
10:00 |
10.20 |
11.39 |
0.84 |
16.06 |
16.93 |
0.62 |
13.24 |
11.39 |
1.31 |
9.53 |
11.39 |
1.31 |
|
11:00 |
9.19 |
10.56 |
0.97 |
13.80 |
13.29 |
0.36 |
12.39 |
10.56 |
1.29 |
9.40 |
10.56 |
0.82 |
|
12:00 |
9.76 |
8.16 |
1.13 |
13.66 |
11.63 |
1.43 |
12.41 |
8.16 |
3.01 |
9.11 |
8.16 |
0.67 |
|
13:00 |
11.60 |
10.28 |
0.93 |
14.40 |
11.09 |
2.34 |
14.01 |
10.28 |
2.64 |
10.64 |
10.28 |
0.25 |
|
14:00 |
10.80 |
11.98 |
0.84 |
16.54 |
9.99 |
4.64 |
12.57 |
11.98 |
0.42 |
12.43 |
11.98 |
0.31 |
|
15:00 |
11.47 |
8.62 |
2.02 |
15.87 |
10.96 |
3.47 |
12.71 |
8.62 |
2.90 |
12.41 |
8.62 |
2.69 |
|
16:00 |
11.11 |
7.89 |
2.28 |
14.56 |
10.94 |
2.56 |
12.49 |
7.89 |
3.25 |
11.20 |
7.89 |
2.34 |
|
17:00 |
10.77 |
9.73 |
0.74 |
13.91 |
9.83 |
2.89 |
11.77 |
9.73 |
1.44 |
9.74 |
9.73 |
0.01 |
|
18:00 |
11.10 |
9.67 |
1.01 |
14.63 |
10.13 |
3.18 |
12.93 |
9.67 |
2.30 |
10.40 |
9.67 |
0.52 |
|
19:00 |
12.67 |
10.21 |
1.74 |
13.29 |
12.71 |
0.40 |
15.31 |
10.21 |
3.61 |
10.63 |
10.21 |
0.29 |
|
20:00 |
13.36 |
13.14 |
0.15 |
18.29 |
17.61 |
0.47 |
18.36 |
13.14 |
3.69 |
11.71 |
13.14 |
1.01 |
|
21:00 |
14.04 |
16.49 |
1.73 |
17.47 |
21.97 |
3.18 |
18.27 |
16.49 |
1.26 |
12.91 |
16.49 |
2.53 |
|
22:00 |
15.41 |
14.93 |
0.34 |
14.03 |
18.11 |
2.89 |
19.99 |
14.93 |
3.58 |
15.41 |
14.93 |
0.34 |
|
23:00 |
14.87 |
16.64 |
1.25 |
13.36 |
16.53 |
2.25 |
20.04 |
16.64 |
2.40 |
13.81 |
16.64 |
2.00 |
After analysing the results, we observed a significant
improvement in the air quality of PM2.5 and PM10 pollutants. Measurements made in the second stage are
much lower than in the autumn-winter period (November-December). Comparing the
received measurements and the measurements of CIEP,
showed that they were similar. The obtained measurements from PM10 were higher than PM2.5. The
level of air quality was good and very good, which is a significant improvement
over the first stage. Measurements in the eight selected locations in Pila were
very similar. Higher level measurements were obtained mostly in rush hours and
morning hours when the traffic was much higher. The level of pollution in the
evening hours was much lower than in the winter. The highest values of
pollutants were noted along the road, both in the case of PM10
and PM2.5 on the left and right sides. Only in the
case of point 6, the values of the measurements on the right were sometimes
opposite, as was the case in the winter months due to household smoking. Of
course, the weather conditions, pressure, wind direction and strength, as well
as the intensity of cars, contributed to the negative functioning of the
environment due to exhaust fumes from exhaust pipes, negatively affecting the
air quality, also contributed to the measurement values. The differences between measurement
1 and 2 are presented in the diagrams below. Example
comparison of the two stages is presented in the charts below.
Summarising the stages of the November-December
and February-March studies on PM2.5 and PM10 pollutants, we noticed significant differences between
the measurements. In the first stage, the measurements were much higher than in
the second stage. Only in one case, during the night hours, the measurement
results were more favourable in the winter. This may
be due to the proximity of the park and the lack of residential buildings. Out
of the eight selected places in Pila, the areas in the city centre,
that is, the place next to shopping malls, schools or main roads in the city
with the highest traffic density, take the highest values of pollution. The
wind force was of great importance for the measurement value because the higher
the wind force, the lower the pollution values were, as the dust is blown by
the wind and the pollution does not accumulate around itself. The direction of
the wind was also important depending on which side the wind was blowing, the
values changed dynamically.
The comparison of both stages with
the use of the above charts made it possible to illustrate and prove that the
measurements performed in the second stage, that is, February-March, were lower
than the measurements from the first stage, November-December. The main reason
was the season of the year, which is home heating.
Fig. 6. Difference
between measurement 1 and 2 – PM2.5
Fig. 7. Difference
between measurement 1 and 2 – PM10
Fig. 8. Comparison of
the first stage with the second stage – PM2.5
pollution for point 2
This article aimed to
study air pollutant emissions from transport sources in Pila. This is an
important and recurring environmental topic. Road transport has a huge impact
on the source of air pollution. The main assumption of this work was to show
the places most endangered by the emission of air pollutants, based on which it
is possible to propose development directions for improving the air condition
in Pila. The emission of pollutants has a decisive influence on the state of
air quality. The study on air pollutant emissions from transport sources in
Pila showed that there are no places particularly endangered by exhaust gas
emissions in Pila. This is confirmed by the range of permissible concentrations
for individual pollutants; the level was in the very good and moderate range,
depending on the month of the study.
This study presents in
detail selected places in Pila, which were examined 24 hours a day, 7 days a
week with specific assumptions. From the conducted research, which was divided
into two stages, it can be concluded that the results of the research carried
out at the turn of November and December were much higher than at the turn of February
and March. The main reason was the heating period. While the traffic of cars
during the study was similar to each other, it is difficult to relate to the
intensity of cars, which are the source of pollutant emissions. The study
showed that proposals to improve the directions of air quality development
should be introduced. It is a very important aspect of the environment and
society, minimising the emission of pollutants is not
as difficult as it seems, limiting the use of a means of transport and replacing
it, for example, with a bicycle, is already to some degree related to the
improvement of air quality.
References
1.
Air pollution. Available at:
https://encyklopedia.pwn.pl/haslo/zanieczyoszenia-powietrza;4000235.html.
2.
Adamkiewicz Lukasz, Natalia Matyasik. 2019. „Smog w Polsce i jego
konsekwencje”. Working Paper 5. Warsaw: Polish Economic Institute. [In Polish: „Smog in Poland”
and its consequences”].
3.
Al‐Mofleh Anwar, Soib Taib, Wael
A. Salah. 2010. “Malaysian energy demand and emissions from the
transportation sector”. Transport
25(4): 448-453.
4.
Data of the measuring station in Pila. Available at:
http://powiekieta.gios.gov.pl/pjp/current/station_details/info/920.
5.
Diagram of the roadway. Available at:
https://www.cezao.pl/pl/p/Podlogowa-mata-jezdnia-do-nauki-poruszania-sie-po-drodze-BRD/2838.
6.
Directive 2008/50/EC of the European Parliament and of the Council of
May 21. 2008 on ambient air quality and cleaner air for Europe. Journal of Laws
UE L 152 of June 11. 2008.
7.
Ekologia: czasem
po dymie poznasz, czym sąsiad
pali. Available at:
http://nettg.pl/news/140549/ekologia-czasem-po-dymie-poznasz-czego-sasiad-pali/
[In Polish: Ecology: sometimes you can tell by the smoke what your
neighbor is smoking].
8.
Idzior Marek, Edward Czapliński, Mateusz Bor. 2017.
„Wpływ transportu samochodowego na zanieczyszczenie powietrza
pyłem zawieszonym PM10 i PM 2,5”. Autobusy: technika, eksploatacja, systemy
transportowe 6. [In Polish: „Impact of road transport
on air pollution by PM10 and PM2.5
dust”].
9.
Infrastruktura w mieście
Piła. Available at:
https://www.powiat.pila.pl/opowiecie/informacje/infrastruktura. [In Polish:
Infrastructure in the city of Piła].
10. Jacyna M., J. Merkisz. “Proecological
approach to modelling traffic organization in national transport system”.
Archives of Transport 2(30): 43-56.
11.
Li X., Q. Zhang, Y. Zhang, B. Zheng, K. Wang, Y. Chen, T.J. Wallington, W.J. Han, W. Shen, X.Y.
Zhang, et al. 2015. “Source contributions of urban PM2.5
in the Beijing-TianjinHebei region: Changes between
2006 and 2013 and relative impacts of emissions and meteorology”. Atmos. Environ. 123: 229-239.
12. Łyczko Piotr. Jakość
powietrza w Polsce na tle Unii Europejskiej. Available
at: https://powietrze.malopolska.pl/baza/jakosc-powietrza-w-polsce-na-tle-unii-europejskiej/.
[In Polish: Air quality in Poland
compared to the European Union].
13. Makan Hemisha,
Gert J. Heyns. 2018.
„Sustainable supply chain initiatives in reducing greenhouse gas emission
within the road freight industry”. Journal
of Transport and Supply Chain Management 12(a365):
1-10. ISSN 2310-8789.
14. Mapa Piły.
Available at:
https://www.google.pl/maps/place/Pi%C5%82a/data=!4m2!3m1!1s0x4703e43e19ce785d:0x64dc72cbc93a28bd?sa=X&ved=2ahUKEwiJwp-S1_fpAhUulosAQH8hUulosAQH8gUulosAccess.
[In Polish: Map of the town of Piła].
15. Metody pomiaru
zanieczyszczeń. Available at:
https://powietrze.gios.gov.pl/pjp/content/show/1000919. [In Polish: Methods of
measuring].
16. Mickevicius T., S. Slavinskas,
S. Wierzbicki, K. Duda.
2014. „The effect of diesel-biodiesel blends on the performance and
exhaust emissions of a direct injection off-road diesel engine”. Transport 29(4): 440-448.
17. Niemiec Witold, Sylwia Sadowska, Oktavia
Niemiec. 2010.
Wybrane
zagadnienia ochrony środowiska w turystyce. Rzeszów: Publishing House of
the Rzeszów University of Technology. [In
Polish: Selected issues of environmental
protection in tourism].
18. Operating manual of the
device – Laser Air Quality Monitor SDL607.
19. Podstawowa charakterystyka
zanieczyszczeń powietrza.
Available at: http://www.ekoprognoza.pl/index.php?id=120&id2=114 [In
Polish: Basic characteristics of air pollutants].
20.
Pyłka-Gutowska Ewa. 2004. Ekologia
z ochroną środowiska. Oświata Publishing House. 2004. [In Polish: Ecology with environmental
protection].
21.
Rozporządzenie
Ministra Środowiska z dnia 13 września 2012 r. w sprawie dokonywania
oceny poziomów substancji w powietrzu. Dz.U. 2012 poz. 1032 [In Polish: Regulation of the Minister of the
Environment of September 13. 2012 on assessing the levels of substances in the
air. Journal of Laws of 2012. items 1032. 1119].
22. Schmidt Marie, Stefan Voss. 2017.
„Advanced systems in public transport”. Public Transport 9(1-2) Special Issue: 3-6.
23.
Sówka Izabela. 2017. „Transport drogowy jako
źródło zanieczyszczenia powietrza w miastach”. Czysta Energia 1-2. [In Polish:
“Road transport as a source of air pollution in cities”].
24. Szczepańska Joanna. Działalność człowieka, a środowisko cz. II.
Available
at: https://www.wios.lodz.pl/files/docs/r07xiix18.pdf/.
[In Polish: Human
activity and the environment part. II].
25. Toksyczność spalin.
Available at:
https://docplayer.pl/3867501-Laboratorium-podstaw-silnikow-i-napedow-spalinowych-cwiczenie-6-diagnostyczne-pomiary-toksycznych-skladnikow-spalin.html.
[In Polish: Toxicity of exhaust gases].
26. Wojtal Remigiusz. 2004. „Zanieczyszczenie powietrza w
miastach w aspekcie ruchu drogowego”. Transport miejski i regionalny. [In Polish: “Air
pollution in cities in terms of road traffic”].
27. Yang D.Y.,
S.J. Zhang, T.L. Niu, Y.J. Wang, H.L. Xu, K.M. Zhang, Y. Wu. 2019. “High-resolution mapping of
vehicle emissions of atmospheric pollutants based on large-scale real-world
traffic datasets”. Atmos. Chem.
Phys. 19: 8831-8843.
28.
Yifeng Xue,
Cao Xizi, Ai Yi, Xu Kangli,
Zhang Yichen. 2020. “Primary Air Pollutants
Emissions Variation Characteristics and Future Control Strategies for
Transportation Sector in Beijing, China”.
Sustainability
12(10): 4111. DOI: https://doi.org/10.3390/su12104111.
29.
Zanieczyszczone
miasta. Available at: https://300gospodarka.pl/news/raport-29-ze-100-najMost-zanieczyszczonych-miast-europy-jest-w-polsce.
[In Polish: Polluted cities].
30.
Zanieczyszczone
powietrze w Polsce. Available at:
https://alertsmogowy.pl/rankingi/qfmt/najbrudszym-powiekieta-w-polsce-ranking-2019.html. [In Polish: Polluted air in Poland].
31. Zhang S.J., Y. Wu, X.M. Wu, M.L. Li., Y.S. Ge, B. Liang, Y.Y. Xu, Y. Zhou,
H. Liu, L.X. Fu,
et al. 2014. “Historic and future trends of vehicle emissions in Beijing.
1998-2020: A policy assessment for the most stringent vehicle emission control
program in China”. Atmos. Environ.
89: 216-229.
32. Źródła zanieczyszczeń
powietrza, pochodzenie antropogeniczne. Available at:
https://www.niebieskiatmoludek.pl/wp-content/uploads/2014/04/prezentacja_warszataty-nauczyciele-20141.pdf/.
[In Polish: Sources of air pollution, anthropogenic origin].
33. Źródła zanieczyszczeń powietrza,
pochodzenie naturalnego. Available at: https://encyklopedia.pwn.pl/haslo/zanieczyoszenia-powietrza;
4000235/. [In Polish: Sources of air polluoisetion,
natural origin].
34. Źródła zanieczyszczeń.
Available at:
https://www.oddechtozycie.pl/2019/10/15/zrodlazanieczyszczeniapowietrza/. [In
Polish: Sources of air pollution].
Received 28.01.2021; accepted in revised form 09.04.2021
![]()
Scientific
Journal of Silesian University of Technology. Series Transport is licensed
under a Creative Commons Attribution 4.0 International License