Article
citation information:
Kamiński, W. Comparison of selected
railway lines in Poland using the Analytical Hierarchy Process method. Scientific Journal of Silesian University of
Technology. Series Transport. 2020, 108,
73-84. ISSN: 0209-3324. DOI: https://doi.org/10.20858/sjsutst.2020.108.7.
Wojciech
KAMIŃSKI[1]
COMPARISON
OF SELECTED RAILWAY LINES IN POLAND USING THE ANALYTICAL HIERARCHY PROCESS
METHOD
Summary. The volume of passenger and freight transport on a
given railway line depends on many socio-economic factors. Therefore, before
starting an investment on a railway line, various analyses are carried out
regarding the choice of the line and the scope of works. This article presents
the calculation of weights determining the impact of specific socio-economic
factors on the volume of rail passenger and freight transport using the
Analytical Hierarchy Process (AHP) method. Thereafter, a comparison was made of
12 railway lines located in various regions of Poland in terms of their use in
both passenger and freight transport. Half of the analysed railway lines are
main lines, while the other part are local lines. The comparison made it
possible to arrange the selected lines regardless of their category.
Keywords: railway transport, passenger transport, freight
transport, AHP method, logistics
1. INTRODUCTION
Many railway
lines in Poland are currently being modernised or revitalised. The rail
passenger and freight transport system are very complex. Therefore, before
making a decision about the functioning of individual railway lines, which are
part of the railway system, many multi-criteria analyses are carried out. These
analyses allow the consideration of various economic, environmental and social
factors.
The purpose of this article is to compare selected railway lines located in
Poland, taking into account, factors affecting the volume of transport.
Socio-economic factors affect passenger transport. In turn, the volume of
freight transport depends mainly on the location of large production plants at
the railway line with their own sidings or using station holds. The impact of
selected factors on freight transport has not yet been analysed. To enable
comparison of railway lines considering various factors, the weights of these
factors were first determined using the AHP (Analytical Hierarchy Process) method. For
each factor, the weight was obtained in the range of 0 to 1. The values
determined in this way were later used to compare railway lines. The AHP method
was also used in further calculations, however, the existing comparative scale
was used to avoid expert assessment.
The AHP
method was developed in 1970 by Thomas L. Saaty. Since then, this method has
been constantly modified and is constantly developing [6]. These modifications
allow adjusting the AHP method into a specific, analysed problem, considering
its specificity [3]. This method is based on the assessment of the impact of
the human psyche and on mathematical calculations. The AHP method supports
making various complex decisions with a certain number of possible variants.
The problem solved by this method is included in many aspects, which is
manifested in determining the weights of individual factors included in the
assessment criteria of a particular variant. All decision options are assessed
using benchmarking [10]. This method has been used in many different fields,
including business, industry, logistics during supply chain management [5, 8, 9]
and transport. During this research on rail passenger transport, the AHP method
was used, among others, to analyse the needs of various groups of passengers [16].
This method is useful for studying complex processes. There are many factors in
the transport process, such as: economic, social, technical and environmental,
therefore, it is a complex process [12]. The AHP method is particularly useful
when there is a hierarchy of evaluation criteria with different impacts on the
analysed objective or expected benefits. This method can be used when the
assessment criteria are defined not in quantitative but in qualitative terms,
however, subjective judgments of the decision-maker are introduced. In this
case, the credibility of the information based on which the experts make the
assessment should also be considered [2]. In order to avoid subjectivity in
this case, attempts were made to introduce the fuzzy set theory into the AHP
method, and thus, expand the traditional method [17]. This subjectivity does
not occur in the case of full comparability of the analysed variants. With the
help of AHP analysis, due to its universality, it is also possible to compare
other methods used for calculations in various fields [14]. The application of
the AHP method involves building a hierarchical model, followed by an
assessment, that is, pairwise comparison of criteria and decision variants, and
ultimately allows classification of decision variants [18]. The disadvantage of
AHP analysis is the considerable complexity in the case of a large number of
criteria or decision variants. This makes it necessary to make a large number
of pairwise comparisons. For this purpose, attempts were made to improve this
method so that it can be easily used with very large amounts of data for
analysis [7]. In these calculations, it can be seen that a greater number of
criteria with the same number of decision variants results in more complex
comparison matrices.
2. DETERMINATION OF THE INFLUENCE OF
SOCIO-ECONOMIC FACTORS ON THE VOLUME OF PASSENGER TRANSPORT
The following hierarchy of problems
was adopted:
- first level: assessment of a particular railway line
in passenger traffic,
- level two: nine socio-economic factors affecting the
volume of passenger transport,
- level three: possible assessment and comparison of any
railway lines in Poland.
Matrices containing compared pairs
of socio-economic factors affecting the volume of transport for both passenger
and freight transport were developed by persons involved in rail transport,
representatives of railway infrastructure manager, passenger long-distance
carrier and a freight carrier.
2.1. Determining the weight of socio-economic factors using the AHP analysis
The volume of passenger transport on
a particular railway line depends on the distribution of the population and the
transport needs of the area through which the railway line passes. During the
analysis, socio-economic factors were taken into account, such as the size of
cities located along the railway line, the number of registered vehicles per
1000 inhabitants, the number of economic entities broken down by the size of
enterprises (expressed by the number of employees), the accessibility of
residents to the railway line, the number of beds in facilities, beds in
communes at the railway line, number of commuters and average number of bus and
tram connections from the city centre to the railway station. The matrix
containing comparisons of socio-economic factors affecting the volume of
passenger transport is presented in Tab. 1. The elements on the diagonal of
this matrix have a value of 1, as a comparison of two factors with each other.
Above the diagonal, is the result of comparing two criteria with each other.
However, the inverse of these comparisons is recorded below the diagonal [15].
The weights of individual
socio-economic factors affecting the volume of rail passenger transport were
determined based on a pair-of-pair comparison matrix. These weights are
presented in Tab. 2. The sum of received weights for all factors is 1.
2.2. Checking the correctness of the obtained
results
After determining the weights using
the AHP analysis, the correctness of the results is obtained by checking the
principle of constancy of preferences. In this method, it is necessary to
obtain adequate conformity of assessments, expressed by the value of the
compatibility ratio of the CI comparison matrix and the CR compliance ratio.
For their calculation, it is necessary to determine in advance the
inconsistency coefficient λmax [4]. Most often, the pair-wise comparison
matrix is not perfectly consistent. In some cases, it is not possible to
achieve the required consistency. Therefore, research was carried out in this
regard using optimisation models aimed at increasing the consistency of the
matrix [11]. When calculating the inconsistency coefficient λmax, the product of the sum of grades and the
weight obtained should be calculated for each socio-economic factor. Then,
after adding up the obtained values, a λmax is obtained. Thereafter, the compliance index
was calculated in accordance with formula (1) using the obtained value of the
inconsistency coefficient.
![]() (1)
(1)
where:
λmax – inconsistency coefficient,
n
– matrix size,
r
– the indicator depends on the size of the matrix (for n = 9 this value
is r = 1.45).
Tab. 1
Matrix of comparisons by pairs of socio-economic factors affecting the
volume of passenger rail transport
|
Factor |
Popul. [pe.] |
No. of veh. / 1000 pe. |
Bus. ent. up to 9 pe. |
Bus. ent. 10 - 49 pe |
Bus. ent. over 50 pe. |
Av. of inh. to the line. [pe./km] |
No. of beds [pe.] |
No. of comm. [pe.] |
Av. no. of con. in a day [con.] |
Sum |
|
Popul. [pe.] |
1.00 |
7.00 |
3.00 |
3.00 |
3.00 |
0.33 |
3.00 |
0.33 |
5.00 |
25.67 |
|
No. of veh. / 1000 pe. |
0.14 |
1.00 |
0.14 |
0.20 |
0.20 |
0.11 |
0.33 |
0.11 |
0.33 |
2.57 |
|
Bus. ent. up to 9 pe. |
0.33 |
7.00 |
1.00 |
3.00 |
3.00 |
1.00 |
5.00 |
1.00 |
5.00 |
26.33 |
|
Bus. ent. 10 - 49 pe. |
0.33 |
5.00 |
0.33 |
1.00 |
1.00 |
0.33 |
3.00 |
0.33 |
3.00 |
14.33 |
|
Bus. ent. over 50 pe. |
0.33 |
5.00 |
0.33 |
1.00 |
1.00 |
0.33 |
3.00 |
0.33 |
3.00 |
14.33 |
|
Av. of inh. to the line. [pe./km] |
3.00 |
9.00 |
1.00 |
3.00 |
3.00 |
1.00 |
7.00 |
1.00 |
7.00 |
35.00 |
|
No. of beds [pe.] |
0.33 |
3.00 |
0.20 |
0.33 |
0.33 |
0.14 |
1.00 |
0.14 |
1.00 |
6.49 |
|
No. of comm. [pe.] |
3.00 |
9.00 |
1.00 |
3.00 |
3.00 |
1.00 |
7.00 |
1.00 |
7.00 |
35.00 |
|
Av. no. of con. in a day [con.] |
0.20 |
3.00 |
0.20 |
0.33 |
0.33 |
0.14 |
1.00 |
0.14 |
1.00 |
6.35 |
|
Sum |
8.68 |
49.00 |
7.21 |
14.87 |
14.87 |
4.40 |
30.33 |
4.40 |
32.33 |
166.08 |
Subsequently, the
compliance ratio was calculated according to formula (2).
![]() (2)
(2)
where:
CI
– compliance index,
r
– the indicator depends on the size of the matrix.
If the values of both coefficients
are less than 0.1 it means that the assessments made are consistent, which was
achieved in the analysed case.
Tab. 2
Obtained weights of individual socio-economic factors affecting the
volume of passenger rail transport
|
Factor |
Popul. [pe.] |
No. of veh. / 1000 pe. |
Bus. ent. up to 9 pe. |
Bus. ent. 10 - 49 pe. |
Bus. ent. over 50 pe. |
Av. of inh. to the line. [pe./km] |
No. of beds [pe.] |
No. of comm. [pe.] |
Av. no. of con. in a day [con.] |
Sum |
|
Weig. |
0.155 |
0.016 |
0.159 |
0.086 |
0.086 |
0.211 |
0.039 |
0.211 |
0.038 |
1.000 |
3. DETERMINATION OF THE INFLUENCE OF FACTORS ON
THE VOLUME OF FREIGHT TRANSPORT
The following hierarchy of problems
was adopted:
- first level: Assessment of a particular railway line
in freight traffic,
- level two: four factors affecting the volume of
freight transport,
- level three: possible assessment and comparison of any
railway lines in Poland.
3.1. Determining the weight of factors using
the AHP analysis
The volume of freight transport on a particular railway line depends on the location of plants along this
line that can generate full-length shipments and the possibility of using the
line in transit traffic. During the analysis, the following factors were taken
into account: the number of sidings (both station sidings and less frequent
route sidings were considered), the number of stations holds and the occurrence
of transit traffic. The matrix containing comparisons of socio-economic factors
affecting the volume of freight is presented in Tab. 3.
The weights of individual factors
affecting the volume of rail freight transport were determined based on a
pair-of-pair comparison matrix. These weights, which sum is 1, are presented in
Tab. 4.
Tab. 3
Matrix of comparisons by pairs of factors affecting the volume of rail
freight transport
|
Factor |
Number of sidings |
Number of stations holds |
Transit traffic |
Sum |
|
Number of sidings |
1.00 |
1.00 |
3.00 |
5.00 |
|
Number of stations holds |
1.00 |
1.00 |
3.00 |
5.00 |
|
Transit traffic |
0.33 |
0.33 |
1.00 |
1.67 |
|
Sum |
2.33 |
2.33 |
7.00 |
11.67 |
Tab. 4
Obtained weights of individual factors affecting the volume of rail
freight transport
|
Factor |
Number of sidings |
Number of stations holds |
Transit traffic |
Sum |
|
Weig. |
0.429 |
0.429 |
0.143 |
1.000 |
3.2. Checking the correctness of the obtained
results
After
determining the weights of factors affecting the volume of freight using the
AHP analysis, as in the case of determining the weights of factors affecting
passenger transport, the correctness of the results obtained was checked.
The
compliance index value was then calculated in accordance with formula (1). For
the analysed number of factors (n = 3), the value of the index depending on the
size of the matrix is r = 0.58. For freight, the values of both factors are
less than 0.1, so the assessments made are consistent. Due to the small number
of factors affecting the volume of rail freight that was considered, and the
high consistency of the assessments, the values obtained for both the
compliance index and the compliance ratio are 0.
4. COMPARISON OF SELECTED RAILWAY LINES
The
comparison was made of 12 railway lines located in different regions of Poland.
The analysis was carried out for 6 voivodships, choosing from one of the 2
railway lines in accordance with the principle that, however, one from the
analysed railway lines is the main line, while the other is a local line. The
analyzed railway lines are presented in Fig. 1. On the map, the analysed main
railway lines are marked in bold solid line, whereas the local railway lines
are marked in bold dashed line.
During
comparing the individual socio-economic factors on selected railway lines, the
existing comparative scale was used. Evaluation of pairwise comparison of
specific railway lines for each factor is expressed by the ratio VA/VB, while the
inverse value in the matrix expresses the ratio VB/VA. For this purpose, data on
socio-economic factors affecting the volume of passenger transport was used.
The source of data are reports published by the Central Statistical Office
(CSO). One of the factors, the residents' availability to the railway line, was
calculated using the CSO data. These data are presented in Tab. 5.
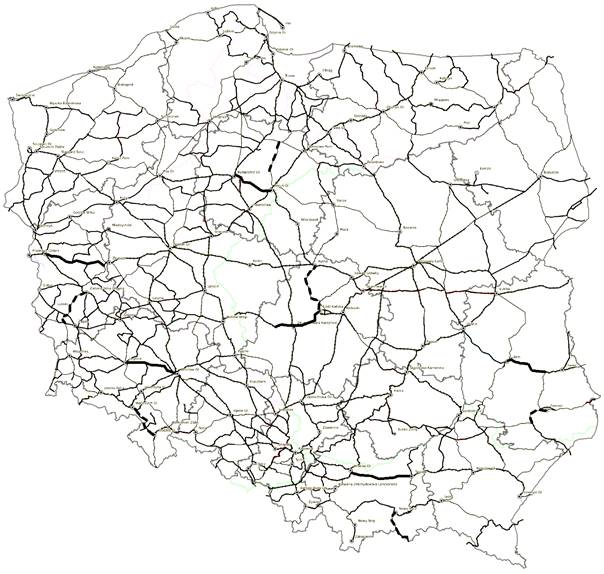
Fig. 1. Location of analysed railway lines
in Poland [13]
In turn,
for freight transport, factors affecting its volume related to the existing
infrastructure (sidings and station holds) and transit traffic were determined.
These data are shown in Tab. 6.
Using the VA/VB ratio, the
lines were compared for all factors relating to passenger transport and for the
factor determining the number of sidings responsible for freight traffic. Due
to the use of the existing, specific comparative scale, for these factors, it
was not necessary to calculate the compliance index and the compliance ratio,
which are then zero. In the case of the factor which is the number of stations
holds, a comparative scale should have been introduced due to the lack of holds
on some railway lines and the need to avoid zero value in the denominator.
Additionally, a comparative scale should have been introduced for transit
traffic in freight transport given only descriptively.
Tab. 5
Factors
affecting the volume of passenger transport
|
Section |
Popul. [pe.] |
No. of veh. / 1000 pe. |
Bus. ent. up to 9 pe. |
Bus. ent. 10 - 49 pe. |
Bus. ent. over 50 pe. |
Av. of inh. to the line. [pe./km] |
No. of beds [pe.] |
No. of comm. [pe.] |
Av. no. of con. in a day [con.] |
|
Wroc. Gł. - Legnica |
758013 |
637.22 |
135152 |
3641 |
985 |
3591.72 |
13296 |
73076 |
285.62 |
|
Kłodz. Gł. - Wał. Gł. |
184290 |
557.68 |
20654 |
577 |
141 |
1185.58 |
2601 |
12719 |
8.33 |
|
Bydg. Gł. - Tor. Gł. |
572163 |
559.15 |
68354 |
2330 |
698 |
3516.38 |
8115 |
43327 |
210.00 |
|
Grudziądz - Chełmża |
111431 |
523.75 |
9684 |
369 |
115 |
1954.70 |
1425 |
3813 |
31.33 |
|
Lublin - Rejowiec |
388645 |
579.17 |
48982 |
1514 |
418 |
2735.39 |
4526 |
41053 |
34.86 |
|
Zam. W. - Zwierzyn. |
76677 |
519.60 |
8541 |
279 |
90 |
1919.04 |
2544 |
7084 |
23.89 |
|
Zbąszynek - Rzepin |
40853 |
634.42 |
6528 |
227 |
54 |
356.75 |
2566 |
6295 |
2.64 |
|
Żary - Ziel. Góra |
185775 |
627.69 |
26129 |
897 |
208 |
1514.98 |
1534 |
21145 |
28.10 |
|
Łódź Kal. - Sieradz |
863521 |
728.76 |
107563 |
4303 |
925 |
10267.10 |
9521 |
57623 |
74.15 |
|
Łódź Kal. - Kutno |
828287 |
718.48 |
102150 |
3985 |
903 |
10864.94 |
8965 |
53155 |
86.56 |
|
Krak. Gł. - Tarnów |
948204 |
587.11 |
163658 |
6068 |
1421 |
5268.79 |
35440 |
123357 |
80.00 |
|
N. Sącz - Muszyna |
104896 |
447.03 |
13308 |
527 |
143 |
987.71 |
4755 |
11364 |
69.13 |
4.1. Socio-economic factors affecting the
volume of passenger transport
During
comparing railway lines in terms of their use in passenger transport, a matrix
of comparisons was created for each socio-economic factor and pairwise
comparison of all railway lines was made. A total of 9 comparison matrices were
performed during the analysis. Then, after analysis in pairs of railway lines
in terms of all socio-economic criteria, values were added for each line. For
this purpose, the weights obtained in Tab. 2 were used and the sum of the
product of the values obtained for each of the factors and the weights obtained
was calculated.
4.2. Factors affecting the volume of freight
When
comparing lines in terms of utilisation in freight transport, a pair comparison
matrix was created for the criterion of the number of sidings using the VA/VB ratio. For
the factor, which is the number of stations holds, a comparative scale was
introduced due to the lack of holds on some railway lines and the need to avoid
zero value in the denominator. To compare the line in terms of this criterion,
it was assumed when a line without any hold was combined with a line with one
hold, value 5, while with a line with two holds, value 9, and when comparing a
line with one station hold with a line with two holds, value 5 was assumed. The
introduction of this comparative scale was associated with the need to check
the correctness of the results obtained and to calculate the compliance index
and compliance ratio. Both values obtained are less than 0.1. In addition, a
comparative scale should have been introduced for transit traffic in freight
transport given only descriptively. Here, it was assumed when comparing the
line on which freight transit traffic does not occur with the railway line on
which such traffic runs a value of 5. In this case, the compliance indicator
and compliance factor were also checked for the results obtained. After
analysis in pairs of railway lines in terms of criteria affecting freight
transport, values were added for each line. The sum of the product of the
obtained values was calculated for each of the factors and weights obtained in
Tab. 4.
Tab. 6
Factors
affecting the volume of freight transport
|
Section |
Number of sidings |
Number of stations holds |
Transit traffic |
|
Wrocław Gł. - Legnica |
2 |
2 |
occurs |
|
Kłodzko Gł. - Wałbrzych Gł. |
2 |
1 |
lack |
|
Bydgoszcz Gł. - Toruń Gł. |
2 |
1 |
occurs |
|
Grudziądz - Chełmża |
1 |
0 |
lack |
|
Lublin - Rejowiec |
4 |
1 |
occurs |
|
Zamość Wsch. - Zwierzyniec |
4 |
1 |
occurs |
|
Zbąszynek - Rzepin |
1 |
1 |
occurs |
|
Żary - Zielona Góra |
4 |
2 |
lack |
|
Łódź Kaliska - Sieradz |
3 |
2 |
occurs |
|
Łódź Kaliska - Kutno |
3 |
0 |
occurs |
|
Cracow Gł. - Tarnów |
5 |
2 |
occurs |
|
Nowy Sącz - Muszyna |
1 |
0 |
occurs |
4.3. Comparison of the analysed
railway lines in general
Both
passenger and freight trains are carried out on the analysed railway lines.
Hence, the obtained values during comparisons of lines in terms of passenger
and freight transport using the AHP method were added to each other. Tab. 7
presents the results obtained for the analysed railway lines, separately for
passenger and freight transport, and the sum of these results, considering all
transport on these lines.
Tab. 7
The
results of the comprehensive comparison of analysed railway lines
|
Section |
Passenger transport |
Freight transport |
General |
|
Cracow Gł. - Tar. |
0.208 |
0.152 |
0.360 |
|
Łódź
Kal. - Sieradz |
0.163 |
0.126 |
0.289 |
|
Wroc. Gł. - Legnica |
0.150 |
0.112 |
0.262 |
|
Łódź
Kal. - Kutno |
0.160 |
0.061 |
0.221 |
|
Bydg. Gł. - Tor. Gł. |
0.101 |
0.068 |
0.169 |
|
Lublin - Rejowiec |
0.071 |
0.095 |
0.166 |
|
Żary - Ziel. Góra |
0.038 |
0.127 |
0.165 |
|
Zam. W. - Zwierzyn. |
0.022 |
0.095 |
0.117 |
|
Kłodz. Gł. - Wał. Gł. |
0.028 |
0.056 |
0.084 |
|
Zbąszynek - Rzepin |
0.011 |
0.054 |
0.065 |
|
N. Sącz - Muszyna |
0.026 |
0.034 |
0.060 |
|
Grudziądz - Chełmża |
0.023 |
0.022 |
0.045 |
5. CONCLUSIONS
The
calculations carried out using the AHP analysis allowed determining the weight
of factors affecting the volume of both passenger and freight rail transport.
Subsequent comparison, considering the same criteria using predetermined
weights, allowed the assessment of selected railway lines in terms of their use
in passenger and freight traffic.
The highest
rating in terms of both passenger and freight transport (0.360) was received by
the main railway line connecting Cracow with Tarnów. The main lines from
Łódź to Sieradz (0.289) and from Wrocław to Legnica
(0.262) also received a high overall rating. Furthermore, the local line
connecting Łódź with Kutno received a high overall rating
(0.211). The main railway lines, apart from the main line connecting Zbąszynek
with Rzepin, which passes through very sparsely populated areas, received a
high rating in terms of use in passenger traffic. However, when it comes to
using the line in freight traffic, the local railway line from Żary to
Zielona Góra received a high rating. There are small passenger services
on this line, however, it allows access to plants generating high freight
traffic. The lowest score in terms of freight traffic was given to the route
from Grudziądz to Chełmża, where freight traffic is practically
non-existent due to lack of demand.
This
analysis has shown that it is possible to make a comparison of selected rail
lines taking into account factors affecting the volume of passenger and freight
transport using the AHP analysis. When comparing railway lines, the existing
comparative scale was used in almost all criteria, thus, avoiding expert
evaluations wherever possible.
References
1.
Cejka J., M.
Telecky. 2019. “Influence of Economic and Political Factors on the Public
Rail Transport”. Communications -
Scientific Letters of the University of Zilina (Komunikacie) 21(2): 13-17.
2.
Deng Xinyang, Deng
Yong. 2019. „D-AHP method with
different credibility of information”. Soft Computing.
23(2): 683-691. ISSN: 1433-7479. DOI: https://doi.org/10.1007/s00500-017-2993-9.
3.
Deng Xinyang, Hu
Yong, Deng Yong, Mahadevan Sankaran. 2014. „Supplier selection using AHP methodology extended by D numbers”.
Expert Systems with Applications 41(1): 156-167. ISSN: 0957-4174. DOI:
https://doi.org/10.1016/j.eswa.2013.07.018.
4.
Dong Yucheng,
Zhang Guiqing, Hong Wei-Chiang, Xu Yinfeng. 2010. „Consensus models for AHP group decision
making under row geometric mean prioritization method”. Decision
Support Systems 49(3): 281-289. ISSN: 0167-9236. DOI:
https://doi.org/10.1016/j.dss.2010.03.003.
5.
Gaudenzi Barbara,
Antonio Borghesi. 2006. „Managing
risks in the supply chain using the AHP method”. The
International Journal of Logistics and Management 17(1): 114-136. ISSN:
0957-4093. DOI: https://doi.org/10.1108/09574090610663464.
6.
Ishizaka Alessio,
Ashraf Labib. 2011. „Review of
the main developments in the analytic hierarchy process”. Expert
Systems with Applications 38(11): 14336-14345. ISSN: 0957-4174. DOI:
https://doi.org/10.1016/j.eswa.2011.04.143.
7.
Ishizaka Alessio,
Craig Pearman, Philippe Nemery. 2012. „AHPSort: an AHP-based method for sorting problems”. International
Journal of Production Research 50(17): 4767-4784. ISSN: 1366-588X. DOI: https://doi.org/10.1080/00207543.2012.657966.
8.
Jacyna-Gołda
Ilona, Mariusz Izdebski, Emilian Szczepanski. 2016. „Assessment of the
method effectiveness for choosing the location of warehouses in the supply
network”. Challenge of Transport Telematics, TST 2016. Communications in Computer and Information
Science 640: 84-97.
9.
Jacyna-Gołda
Ilona, Mariusz Wasiak, Mariusz Izdebski, Konrad Lewczuk, Roland Jachimowski,
Dariusz Pyza. 2016. „The evaluation of the
efficiency of supply chain configuration”. Proceedings of the 20th
International Scientific Conference Transport Means 2016. Transport Means - Proceedings of the International Conference:
953-957.
10.
Jaskowski
Piotr, Slawomir Biruk, Robert Bucon. 2010.
„Assessing contractor selection
criteria weights with fuzzy AHP method application in group decision environment”.
Automation in Construction 19(2): 120-126. ISSN: 0926-5805. DOI:
https://doi.org/10.1016/j.autcon.2009.12.014.
11.
Kou Gang, Lin
Changsheng. 2014. „A cosine
maximization method for the priority vector derivation in AHP”. European
Journal of Operational Research 235(1): 225-232. ISSN: 0377-2217. DOI:
https://doi.org/10.1016/j.ejor.2013.10.019.
12.
Nosal Katarzyna,
Katarzyna Solecka. 2014. „Application
of AHP method for multi-criteria evaluation of variants of the integration of
urban public transport”. Transportation Research Procedia
3: 269-278. ISSN: 2352-1465. DOI: https://doi.org/10.1016/j.trpro.2014.10.006.
13.
Ogólnopolska
Baza Kolejowa. “Railmap – mapa kolejowa”. Avaliable at:
https://www.bazakolejowa.pl/index.php?dzial=mapa#6/52.000/18.000. [In Polish:
Nationwide Railway Base].
14.
Peng Yi, Kou Gang,
Wang Guoxun, Wu Wenshuai. 2011. „Ensemble
of software defect predictors: an AHP-based evaluation method”. International
Journal of Information Technology & Decision Making 10(1): 187-206.
ISSN: 1793-6845. DOI: https://doi.org/10.1142/S0219622011004282.
15.
Russo Rosaria de
F.S.M., Camanho Roberto. 2015. „Criteria
in AHP: A Systematic Review of Literature”. Procedia Computer
Science 55: 1877-0509. ISSN: 1063-6706. DOI:
https://doi.org/10.1016/j.procs.2015.07.081.
16.
Sivilevicius
Henrikas, Maskeliunaite Lijana. 2010. „The criteria for identifying the quality of passengers transportation
by railway and their ranking using AHP method”. Transport
25(4): 368-381. ISSN: 1648-3480. DOI: https://doi.org/10.3846/transport.2010.46.
17.
Xu Zeshui, Liao
Huchang. 2014. „Intuitionistic
Fuzzy Analytic Hierarchy Process”. IEEE Transactions on Fuzzy
Systems 22(4): 749-761. ISSN: 1063-6706. DOI:
https://doi.org/10.1109/TFUZZ.2013.2272585.
18.
Żurek
Jan, Olaf Ciszak, Robert Cieślak, Marcin Suszyński. 2011. „Ocena i wybór robota
przemysłowego metodą AHP”. Archiwum Technologii Maszyn i Automatyzacji 31(2): 201-211. ISSN: 2450-9469. [In Polish: „Assessment and
choice of an industrial robot with the use of AHP method”. Archives of
Mechanical Technology and Materials].
Received 05.03.2020; accepted in revised form 15.06.2020
![]()
Scientific
Journal of Silesian University of Technology. Series Transport is licensed
under a Creative Commons Attribution 4.0 International License