Article
citation information:
Verner, J., Sejkorová, M.,
Veselík, P. Volatile organic compounds in motor vehicle interiors under various
conditions and their effect on human health. Scientific Journal of Silesian University of Technology. Series Transport.
2020, 107, 205-216. ISSN: 0209-3324.
DOI: https://doi.org/10.20858/sjsutst.2020.107.16.
Jan VERNER[1], Marie SEJKOROVÁ[2], Petr VESELÍK[3]
VOLATILE
ORGANIC COMPOUNDS IN MOTOR VEHICLE INTERIORS UNDER VARIOUS CONDITIONS AND THEIR
EFFECT ON HUMAN HEALTH
Summary. The aim of this paper is to estimate the mass
concentrations of volatile organic compounds (VOCs) such as benzene (B),
toluene (T), ethylbenzene (E) and m-, p-, o-xylenes (X) inside of the
driver-compartment of motor vehicles. The results were compared with the Czech
limits for indoor environments and the external concentrations. The experiments
were carried out on various routes with different methods of ventilation. The
volatile emissions detected inside the vehicle were investigated in the city of
Brno, Czech Republic. Cabin air was collected using desorption tubes and the
samples were analysed by thermal desorption gas chromatography with a flame
ionisation detector coupled with a mass detector. VOC concentrations detected
in the cabin of the vehicle ranged from 2.93 µg.m-3 to 7.96
µg.m-3 for benzene, 1.42 µg.m-3 to 4.38
µg.m-3. for toluene, 44.06 µg.m-3 to 152.00
µg.m-3 for ethylbenzene and 63.07 µg.m-3 to
479.62 µg.m-3 for xylenes. The indoor limit value for benzene,
according to the Czech standard, is 7 µg.m-3. Levels of
toluene were consistently below the Czech hourly standard, whose value
according to the Czech standard is 300 µg.m-3. According to
our findings, various methods of ventilation are an important factor
influencing the BTEX pollution levels within the interior of the vehicle. In
addition, this paper presents the influence results of benzene on the health of
passengers inside the cabin of the vehicle. The results show that all age
categories, especially children under the age of two, are exposed to increased
health risks.
Keywords: benzene, BTEX, descriptive statistics, health
risk assessment, vehicle, volatile organic compounds (VOCs)
1. INTRODUCTION
Emissions from transport vehicles is an important factor affecting the environment [1-4]. Volatile Organic Compounds (VOCs) present in the air in urban areas cause considerable concerns. Large urban areas suffer under the onslaught of increased traffic, which is a major source of VOCs. Mobile and fixed sources emit large amounts of VOCs. Vehicles can contribute up to 35% of ground-level concentrations of VOCs [5]. VOCs are correlated with traffic density during morning and evening commute peaks [6]. Benzene, toluene, ethylbenzene and xylenes (BTEX) are the major and most studied components in motor vehicles.
According to Cao [7], most VOCs are known or suspected carcinogens. Benzene is a well-known carcinogen, while ethylbenzene and styrene are classified as potential carcinogens in humans and toluene is not classified as carcinogenic in humans by the International Agency for Research on Cancer. For example, leukaemia is associated with exposure to benzene. Benzene is one component of gasoline. Higher content of benzene in fuel affects ambient VOC level [6]. Due to its harmful health effect, reduction of benzene in gasoline is an endeavour to reduce benzene levels throughout the world. The emission factor of individual BTEX varied under identical driving modes. The average emission factor of total VOCs at low speed (30 km.h-1) was the largest among those tested [8]. The concentration of VOCs within the compartment of the vehicle depends on several factors.
Another source that affects interior vehicle VOC levels includes tobacco smoke, spills of chemicals within the vehicle or climate and altitude changes. New cars have relatively higher interior VOCs levels than older vehicles [9], depending on the materials used in their interiors. VOCs are linked with interior sources such as upholstery or plastic mouldings, carpets, seating surfaces, foam cushions, paint and sealants [10, 11]. Hydrocarbons are more present in the summer. In winter, the concentrations are similar to external concentrations [12].
Certain environmental factors influence VOC values such as temperature, humidity or airflow velocity [8]. The use of air conditioning was investigated and may reduce BTEX within the cabins of cars. Reducing interior temperature decreased VOCs pollution levels [9]. However, as stated by Chen et al. [10], concentrations of BTEX were found to be higher in air-conditioned buses than non-air conditioned buses, because reduced natural ventilation prompts an increase in air conditioner pollution. According to Dirks et al. [11], windows left open are the best solution for maintaining low in-cabin air pollution levels, although recirculation should be used in anticipation of congested conditions.
Movement of transport in cities is due to the slow movement of vehicles during morning and evening rush hours [13]. Some studies [14, 15] found that in-vehicle concentrations of VOC during increased traffic periods were up to eight times higher than appropriate ambient levels. During the summer, vents or windows remain open or closed depending upon the use of air conditioning.
This paper evaluates two typical ventilation methods in vehicles that affect interior concentrations of BTEX. The article describes the design of actual measurements at selected locations and on a selected sample of passengers commuting to the city of Brno. The aim of this study was to assess the exposure of passengers to BTEX substances on their journeys by car along commuter routes in the metropolitan area of Brno.
Brno is situated at an altitude
of 497 m in the Czech Republic. The population of Brno approximates
377,000 and population density is approximately 1,759 km-2. During
the measurements on each track, meteorological parameters and traffic density
were also studied. Since benzene is a carcinogenic substance, the effect of
benzene on human health was studied in this work. The scope of the case study
and the use of the methods are described in the next part of this article.
Initially, the focus centres on the specification of the methods used
and their results, which was later presented and discussed.
2. MATERIALS AND METHODS
In the first step of the study, measurements were made of BTEX. Measurement was carried out in three localities with different intensity load transport. Two urban routes and a rural route were chosen for this study. Along these routes, no significant source of VOCs exists that would affect the measurement. This also confirms studies [13] carried out on similar localities in Brno.
When the
routes were selected, traffic loads were determined at selected locations. Data
on traffic density are sourced from the national traffic census by the Road and
Motorway Directorate of the Czech Republic. Routes location, traffic intensity,
sampling time and the sampling scheme are summarised in Tables 1 and 2. As
mentioned in the introduction, the effect of ventilation in vehicles plays an
important role, therefore, measurements were carried out in two modes,
with open and closed ventilation.
Tab. 1
Density of transport (vehicles per 24 hours) on study routes
|
Location |
Density of
transport (vehicles per 24 hours) |
|
Brno- town
centre |
36,000 |
|
Arboretum
Lesná |
25,000-
40,001 |
|
Lipůvka-Blansko |
7,001-10,000 |
Tab. 2
Summary of the sampling scheme
|
Drive
mode |
Routes |
Time
sampling [s] |
Volume
of air sampled [l] |
Temperature
in cabin [°C] |
|
Ventilation open |
Lipůvka-Blansko |
900 |
3.002 |
22 |
|
Ventilation closed |
Blansko-Lipůvka |
900 |
3.004 |
22 |
|
Ventilation open |
Arboretum-Lesná |
900 |
3.002 |
22 |
|
Ventilation closed |
Lesná-Arboretum |
900 |
3.004 |
22 |
|
Ventilation open |
Brno-town centre |
900 |
3.004 |
22 |
|
Ventilation closed |
Brno-town centre |
900 |
3.002 |
22 |
2.1. Location Brno – town
centre
Brno-centre of city (route A – 3.90 km long) is a typical urban location representative. According to data from the Transport Research Center (TRC), it is in an area with a density of traffic at 36,000 vehicles per 24 hours-1. The main source of VOCs is transportation consisting mainly of private motor vehicles. Fig. 1 illustrates the route of measurement. Measurements were carried out in the streets of Pionýrská, Kotlářská, Úvoz, Hlinky, Veletržní and at the Mendelovo náměstí. Sampling was carried out under two driving modes, during both on and off ventilation.
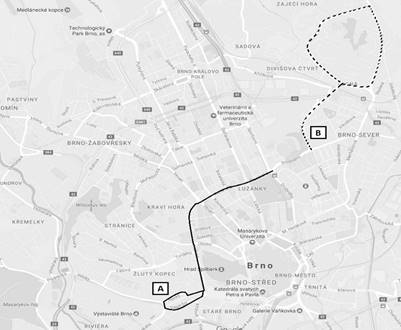
Fig. 1. Location of the sampled routes A, B
2.2. Location Arboretum -
Lesná
Arboretum - Lesná (route B – 5.10 km long) was chosen with regard to a busy nearby road with a density of traffic at 25,001 to 40,000 vehicles 24 hours-1. There is a high proportion of greenery, located in the Botanical Gardens and Arboretum of Mendel University. The main source of VOCs is freight transport. Brno - Lesná is a typical residential neighbourhood, so other sources of VOCs are from the use of garden techniques. Sampling was carried out in two driving modes, during on and off ventilation. Paths of measurement are shown in Fig. 1.
2.3. Location Lipůvka-Blansko
Lipůvka - Blansko (route
C – 13.15 km long) is the third location selected for the measurement of
VOCs. It is a route between the two municipalities, along which travels 7,001
to10,000 vehicles 24 hours-1. It is the main route for commuters
into Brno. This location was chosen owing to its lower density of traffic.
Sampling was carried out in two driving modes, during on and off ventilation.
Path of measurement is shown in Fig. 2.
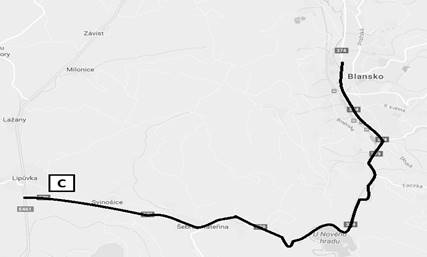
Fig. 2. Location of the sampled route C
2.4. Air sampling and
analysis
At these locations, air
samples inside the vehicle were taken during the two ventilation modes-open and
closed ventilation. The sampling was performed from 4th April to 9th
May in 2018. Measurements were carried out each day on all of the routes and
samples were collected twice, once during peak (7:00-9:00) and again at
(15:00-17:00) hours.
Samples were collected in the passenger area of the vehicle approximately 1.3 m above the floor level. Ambient pressure was between 1,008.2-1,009 hPa. The air sample was collected by pump Aircheck2000 (SKC manufacturer), which was attached to a sorption tube, Markes TD Stainless steel tubes packed with Carbograph 2TD (40/60 mesh) to analyse aromatic and volatile substances. The amount of sorbent was 400 mg per analytical cycle. Sample flow rate of air was controlled at 200 ml.min-1. The sampling period was 900 s. The volume of removed sample was about 3 litres. Following this, the sorption sample tube was removed and replaced. Samples of ambient air with volatile compounds were removed from sorption tubes and subsequently desorbed according to the method 5991-1500EN. Agilent see the description below. The summary of the sampling scheme is shown in Table 2.
For desorption of BTEX from sorption tubes was used the methodology 5991-1500EN Agilent. Thermal desorber Agilent 7667 was used with the following temperature program for thermal desorption of samples. Subsequently, desorbed samples were analysed by gas chromatography-tandem mass spectrometry.
Evaluation of the samples was
carried out on a gas chromatograph Agilent 7890B with two series-connected columns
HP-5ms Ultra Inert (each with a length of 15 m, internal diameter
250 µm and a thickness of 0.25 µm grounded phase).
Calibration of the instrument was carried out of BTEX Mixtures with the
nitrogen Certificate Supplied by SIAD composition. Linearity was guaranteed for
benzene concentration in 8 μg.m-3 of air.
The mass spectrometer Agilent 7000 was used for the detection of these substances: m,p-xylene, o-xylene, toluene, ethylbenzene, benzene.
2.5. Health risk assessment
The following part of this
paper describes results from the risk analysis. For the purpose of this study,
a case study based on the following parameters was created from real-time data.
The assessment of health risks conducted in this paper is based on the method
designed by the United States Environmental Protection Agency (US EPA) [16] and
the method materials used in the Czech Republic such as Manual for
Prevention in Medical Practice, part VIII - basic assessment of health risks [17].
This method is based on the calculation of the average daily inhalation dose,
lifelong average dose and the characteristics of the carcinogenic risk. The
analysis was based on the following formulas. Main formulas for determined
annual population cancer risk in the population exposed is equation 1:
![]() (1)
(1)
where: APCR is annual population cancer risk in the population exposed, ELCR is individual lifetime cancer risk relating to given exposure (above population background), AP is number of exposed persons, 70 is the considered number indicating the average life expectancy in the Czech Republic.
Based on the US EPA [16] method, exposure in this paper assessed to be chronic and equation 2 was used. US EPA [17] also recommends an adjusted calculation where IUR (value for benzene is 6x10⁻⁶ [µg.m-3]) is multiplied by ten for the age up to 2 years old, or by three for the age of 2-16, as seen in equation 3:
![]() (2)
(2)
![]() (3)
(3)
where: EC is exposure concentration [µg.m-3], CA is benzene concentration in air [µg.m3], ET is exposure time [hours/day], EF is exposure frequency [days/year], ED is exposure duration [years], AT is averaging time - lifetime (24 hours/day x 365 days/year x 70 years) [hours].
For the calculation of the exposure time and frequency, equation 4 was recommended by Huzlík [11]. Based on the assignment of the following data to formula 4, the exposure time and frequency was obtained. The size of the population potentially exposed to carcinogenic effects was found to be 6,643,183 people. This amount matches the amount of all those holding driving licenses in the Czech Republic. For the purposes of calculation of the period of exposure, the results of the national traffic count conducted in 2010 in the Czech Republic by the Road and Motorway Directorate. For the purposes of calculation of exposure lengths, the roads were divided into highways with an average speed of 100 km.h-1 and other roads with an average speed of 60 km.h-1.
![]() (4)
(4)
where:
![]() is the length of the i-th summing section of the freeways from the
total number of N counting sections of freeways [km],
is the length of the i-th summing section of the freeways from the
total number of N counting sections of freeways [km], ![]() traffic intensity on the i-th summing section of the freeways from
the total number of the N counting
sections of the freeways
traffic intensity on the i-th summing section of the freeways from
the total number of the N counting
sections of the freeways
[vehicles.day-1], ![]() is the average velocity
of traffic flow on freeway [km.h-1],
is the average velocity
of traffic flow on freeway [km.h-1], ![]() is the length of the
j-th summing section of other roads from the total number of M counting sections of other roads [km],
is the length of the
j-th summing section of other roads from the total number of M counting sections of other roads [km],
![]() is traffic intensity on the j-th summing section of the other roads
from the total number of the M
counting sections of the other roads [vehicles.day-1],
is traffic intensity on the j-th summing section of the other roads
from the total number of the M
counting sections of the other roads [vehicles.day-1], ![]() is the average velocity of traffic flow on other roads [km.h-1],
1.3 is correction factor (30% of road lengths not counted), SDr is number of drivers of passenger
cars in the Czech Republic.
is the average velocity of traffic flow on other roads [km.h-1],
1.3 is correction factor (30% of road lengths not counted), SDr is number of drivers of passenger
cars in the Czech Republic.
3. RESULTS AND DISCUSSION
The statistical values of data analysis of BTEX for each ventilation mode open/closed on routes are shown in Figs. 3, 4 and 5. Various studies have reported different results. The levels of BTEX measured in this study in the two transportation modes were higher than those found in other studies [19, 20], but concentration of benzene was lower, respectively. Hydrocarbon concentration depended on the route taken and transit density as well [21]. In this study, average value of benzene was about 11% lower than permitted by the Czech legislation whose value, according to the Czech standard is 7 µg.m-3. The levels of toluene were consistently below the Czech hourly standard, whose value, according to the Czech standard, is 300 µg.m-3.
According to Hong-Li et al. [22], it is clear that multiple causes exist for higher concentrations of BTEX such as motor vehicles technology, traffic situation, type of fuel, etc. Emissions of BTEX, VOCs respectively in the cabin of vehicles are contingent on ventilation modes and changes in the engine such as idle of engine.
Fig. 3. Concentration of BTEX on route A with different ventilation mode
Fig. 4. Concentration of BTEX on route B with varied ventilation modes
Fig. 5. Concentration of BTEX on route C with varied ventilation modes
Noordin et al. [23] confirmed that BTEX concentration inside the vehicle cabin decreases significantly as time goes on, and a used vehicle would have less BTEX than a new one, because of the ventilation. In the submitted study, the mean concentration of BTEX in vehicles exceeds concentrations of VOCs investigated in residential indoor air in same localities [13]. Route B recorded the highest mean exposure level for benzene 7.96 µg.m-3 while route C presented the lower mean value 3.35 µg.m-3 for mode with closed ventilation. Route A had higher concentration of benzene than route C during open ventilation mode. Route C presented a generally higher level of concentrations for most BTEX.
Driving speed and traffic density are factors that might explain the different values in vehicle BTEX levels on each route. BTEX are commonly present in indoor air and their concentrations vary among indoor environments and seasons. While route A had a high level of traffic density, route B had its main part of the track in a quiet residential area. Route C had slow driving speed. This is caused by the torturous road contours and thus more frequent braking and acceleration. Increasing the speed of ventilation in the cabin of the vehicle would decrease the level of BTEX. Air recirculation was observed as the most effective measure to lower air pollutant concentrations in the study [24].
Also, Kim et al. [25] used
automobiles under various conditions such as cold engine off and ventilation
off, exterior air ventilation with idling warm engine and internal air
recirculation with idling warm engine. The results showed that BTEX strongly
depended upon changes in engine and ventilation modes in vehicle
interiors. The mean concentrations of benzene, toluene, xylene, ethylbenzene in
the cabin were measured 16.73 μg.m-3,
66.02 μg.m-3, 14.20 μg.m-3,
6.78 μg.m-3, respectively. Interior BTEX concentrations
were found to be almost twice the outside concentrations. In our study, we
found half or quarter's concentration values for benzene and toluene, in
comparison with the results of the study of Kim et al. [25]. However, the
concentrations of ethylbenzene and xylenes were up to 20 times higher on all
evaluated routes. The vicinity of the monitored roads registered no significant
source of these substances. The higher levels of ethylbenzene and xylenes,
especially on routes B and C, may have been caused by the driving mode, such as
increased shifting, irregular operation and (above all) the road profile.
Profile Route B was a slight climb and Route C was characterised by multiple
turns. As a result of these factors, there was more frequent acceleration,
hence, the production of ethylbenzene and xylenes.
The BTEX concentrations in the study [20] also changed significantly under various ventilation conditions (fan off and recirculation (RC) off (I), fan on and RC off (II), and fan on and RC on (III)). Under ventilation condition (I) and (III), BTEX concentrations were higher than the concentration under ventilation condition (II). The result indicated that introducing outside air into vehicle interiors under condition (II) lowered their BTEX concentrations. The results of the study [19] are consistent with our results. Lower concentrations of BTEX with open ventilation were also reported.
The aim of the study was also to determine how periods spent in the car increase the probability of oncological disease occurrence for passengers. The result of equation 4, that is, 99.2 car-hours, represents the average time spent by the personal automobile transport passengers’ stay on roads in the Czech Republic per year. The results for each age category are shown in Table 4. The table also describes the travel time for the passengers in the vehicle.
The ELCR value represents a theoretical increase in the probability of cancer by about 0.71 cases of cancer per million inhabitants. Population risk (APCR) reports 0.067 cancer cases per year, which may cause the exposure level of the evaluated substance above the general occurrence in the monitored population. Similar results were obtained by the author from a study [26] conducted in Mecca. Three selected sites concluded that the risk of cancer was between 0.02 and 1.16 cases per million. These findings reveal that BTEX emissions do not pose serious health threats to adult commuters.
Tab. 4
Calculated values of carcinogenic risk
|
EC<2 [µg.m-3] |
EC2-16 [µg.m-3] |
EC16-70 [µg.m-3] |
ELCR |
APCR |
|
0.0043 |
0.01 |
0.043 |
7.1x10⁻⁷ |
0.067 |
Level of benzene, toluene, ethylbenzene, m,p-xylene and o-xylene was measured in this study [27] and the authors observed that the concentrations of all indoor and outdoor samples surpassed the cancer risk limit for benzene. In this study [28], BTEX showed a seasonal variation, with higher concentrations during winter than in summer. BTEX compounds also showed higher records in the morning and in evening rush hours. Concentrations of BTEX observed decreased during midday, probably because of decreased traffic volume. This study showed no serious threat of chronic non-cancer health effects.
3. CONCLUSIONS
This study evaluated the
concentration of BTEX in vehicle interiors. Vehicle interior concentrations of
benzene were found to differ between routes. The mean interior vehicle
concentration of BTEX exceeds concentrations of VOCs investigated in identical
localities during previous years.
Driving with opened ventilation was found to be more effective in reducing BTEX concentration inside vehicles. Emission exhaust gases are one of the main sources and factors responsible for elevated concentrations of BTEX in vehicle interiors.
This study also considers exposures of BTEX for passengers in the Czech Republic based on the measurement of data under actual driving conditions for two months in the city of Brno. Measurement data served to evaluate the study case in considering health risk. From the results, it is clear to see that the mean human cancer risk over a period of 70 years is estimated to be 7.1x10⁻⁷, or 0.71 in a million, due to the inhalation of benzene. A population risk of 0.067 cancer cases per year may cause the exposure level of assessed BTEX to be above the general occurrence in the subject population.
However,
taking into account the hazards BTEX, we can say that every contribution to the
increase in daily levels of benzene, to which humans are exposed, is
unacceptable. In addition, as far as the risk of air dilution in the urban
area is concerned, it is largely sufficient to guarantee their protection.
References
1.
Sejkorova Marie, Branislav Sarkan, Radovan
Madlenak, Jacek Caban, Andrzej Marczuk, Jan Verner, Jaroslava Hyrslova. 2018. „Effect of ferrocene addition to a gas oil on smoke
opacity and engine noise”. Przemysl
Chemiczny 97(8): 1312-1315.
2.
Verner Jan, Marie Sejkorova. 2018. „Comparison of CVS and PEMS measuring devices used
for stating CO2 exhaust emissions of light-duty vehicles during WLTP testing
procedure”. Engineering for Rural
Development 17: 2054-2059.
3. Yehliu
K., R.L.Vander Wal, O. Armas, A.L. Boehman. 2012. „Impact of fuel formulation on the nanostructure and
reactivity of diesel soot”. Combustion
and Flame 159(12): 3597-3606. DOI: https://doi.org/10.1016/j.combustflame.2012.07.004.
4.
Duran J., L. Pradenas, V.
Parada. 2019. „Transit network design with pollution minimization”.
Public Transport 11: 189-210.
5.
Yan C., M. Zheng, Q. Yang, Q. Zhang, X. Qiu, Y.
Zhang, Y. Zhu. 2015. „Commuter
exposure to particulate matter and particle-bound PAHs in three transportation
modes in Beijing, China”. Environmental
pollution 204: 199-206. DOI: https://doi.org/10.1016/j.envpol.2015.05.001.
6.
Cao X., Z. Yao, X. Shen, Y. Ye, X. Jiang. 2016. „On-road emission characteristics of VOCs from
light-duty gasoline vehicles in Beijing, China”. Atmospheric environment 124: 146-155. DOI: https://doi.org/10.1016/j.atmosenv.2015.06.019.
7.
Yang W., Q. Zhang, J. Wang, C. Zhou, Y. Zhang, Z.
Pan. 2018. „Emission characteristics and ozone formation
potentials of VOCs from gasoline passenger cars at different driving
modes”. Atmospheric Pollution
Research 9(5), 804-813. DOI: https://doi.org/10.1016/j.apr.2018.01.002.
8.
Faber J., K. Brodzik, A. Gołda-Kopek, D.
Łomankiewicz. 2013. „Air
Pollution in New Vehicles as a Result of VOC Emissions from Interior
Materials”. Polish Journal of
Environmental Studies 22(6): 1701-1709.
9.
Yue T., X. Yue, F. Chai, J. Hu, Y. Lai, L. He, R.
Zhu. 2017. „Characteristics of volatile organic
compounds (VOCs) from the evaporative emissions of modern passenger
cars”. Atmospheric environment
151: 62-69. DOI: https://doi.org/10.1016/j.atmosenv.2016.12.008.
10. Chen
X., G. Zhang, Q. Zhang, H. Chen. 2011. „Mass concentrations of BTEX
inside air environment of buses in Changsha, China”. Building and Environment 46(2): 421-427. DOI: https://doi.org/10.1016/j.buildenv.2010.08.005.
11. Dirks
K., N. Talbot, J. Salmond, S. Costello. 2018. „In-cabin vehicle carbon monoxide concentrations
under different ventilation settings”. Atmosphere 9(9): 1-14. DOI: https://doi.org/10.3390/atmos9090338.
12.
Geiss O., S. Tirendi, J., Barrero-Moreno, D.
Kotzias. 2009. “Investigation of volatile organic compounds and
phthalates present in the cabin air of used private cars”. Environment international 35(8):
1188-1195. DOI: https://doi.org/10.1016/j.envint.2009.07.016.
13.
Huzlik J. 2012. “Těkavé
organické látky v městském
ovzduší”. [In Czech: “Volatile organic compounds in
urban air”]. Proceedings of the 5th
Czech-Slovak Conference on Transport, Health and the Environment. Blansko,
Czech, 31. October - 2. November 2012.
14.
Golhosseini M., H. Kakooei, S. Shahtaheri,
M.A.N.S.O.U.R. Rezazadeh-Azari, K. Azam. 2013. „Evaluation of volatile organic compounds levels
inside taxis passing through main streets of Tehran”. International Journal of Occupational
Hygiene 5(4): 152-158.
15.
Bakhtiari R., et al. 2018. „Investigation of in-cabin volatile organic
compounds (VOCs) in taxis; influence of vehicle's age, model, fuel, and
refueling”. Environmental Pollution
237: 348-355. DOI: https://doi.org/10.1016/j.envpol.2018.02.063.
16.
US EPA. 2009. Risk
Assessment Guidance for Superfund (RAGS). Volume I: Human Health Evaluation Manual (Part F, Supplemental Guidance
for Inhalation Risk Assessment). Washington, D.C. Publication
EPA-540-R-070-002.
17.
Provazník K., L. Komárek. 2004. Manuál prevence v
lékařské praxi. [In Czech: Manual of prevention in
medical practice]. Charles University. Faculty of Medicine and State
Institute of Public Health Prague. ISBN 80-7168-942-4.
18. US EPA.
2005. Supplemental guidance for assessing
susceptibility from early-life exposure to carcinogens. Washington, D.C.
Publication EPA/630/R-03/003F.
19.
Do D.H., H. Van Langenhove, S.I. Chigbo, A.N.
Amare, K. Demeestere, C. Walgraeve. 2014. „Exposure to volatile organic compounds: Comparison
among different transportation modes”. Atmospheric Environment 94: 53-62. DOI: https://doi.org/10.1016/j.atmosenv.2014.05.019.
20.
Xu B., Y. Wu, Y. Gong, S. Wu, X. Wu, S. Zhu, T.
Liu. 2016. „Investigation of volatile organic compounds
exposure inside vehicle cabins in China”. Atmospheric Pollution Research 7(2): 215-220. DOI: https://doi.org/10.1016/j.apr.2015.09.005.
21. Donchenko
V., Y. Kunin, A. Ruzski, L. Barishev, Y. Trofimenko, V. Mekhonoshin. 2016. „Estimated atmospheric emission from motor transport
in Moscow based on transport model of the city”. Transportation Research Procedia 14:
2649-2658. DOI: https://doi.org/10.1016/j.trpro.2016.05.423.
22.
Hong-li W. el al. 2017. „Volatile organic compounds (VOCs) source profiles
of on-road vehicle emissions in China”. Science of the Total Environment 607: 253-261. DOI: https://doi.org/10.1016/j.scitotenv.2017.07.001.
23.
Noordin N. H., el al. 2018. „Preliminary Analysis of Benzene, Toluene,
Ethylbenzene, O-Xylene (BTEX) and Formaldehyde inside Vehicle Cabin”. Journal of
Mechanical Engineering 5(6): 80-99.
24. Xu B., X. Chen, J. Xiong. 2018. „Air quality inside motor vehicles' cabins: a review”. Indoor and Built Environment 27(4):
452-465. DOI: https://doi.org/10.1177/1420326X16679217.
25. Kim K. H., et al. 2016. „Measurements of major VOCs released into the closed cabin environment of
different automobiles under various engine and ventilation scenarios”. Environmental Pollution 215: 340-346. DOI: https://doi.org/10.1016/j.envpol.2016.05.033.
26. Habeebullah T.M. 2015. „Risk assessment of exposure
to BTEX in the Holy City of Makkah”. Arabian
Journal of Geosciences 8(2): 1155-1162.
27. Hamid H.H.A., N.S. Jumah, M.T. Latif, N. Kannan. 2017. „BTEXs in indoor and outdoor
air samples: source apportionment and health risk assessment of benzene”.
Journal of Environmental Science and
Public Health 1(1): 49-56.
28. Al-Harbi M. 2019. „Characteristic of atmospheric BTEX
concentrations and their health implications in urban environment”. Applied Ecology and Environmental Research
17(1): 33-51.
Received 03.03.2020; accepted in revised form 17.05.2020
![]()
Scientific
Journal of Silesian University of Technology. Series Transport is licensed
under a Creative Commons Attribution 4.0 International License