Article
citation information:
Synák, F., Rievaj, V.,
Kučera, M., Šebök, M., Skrúcaný, T. Effect of repeated
vehicle braking on the warming of selected parts of the vehicle. Scientific Journal of Silesian University of
Technology. Series Transport. 2020, 107, 183-196. ISSN: 0209-3324. DOI: https://doi.org/10.20858/sjsutst.2020.107.14.
František SYNÁK[1],
Vladimír RIEVAJ[2], Matej
KUČERA[3],
Milan ŠEBÖK[4], Tomáš SKRÚCANÝ[5]
EFFECT
OF REPEATED VEHICLE BRAKING ON THE WARMING OF SELECTED PARTS OF THE VEHICLE
Summary. The friction brakes convert a significant part of a
vehicle’s kinetic energy into thermal energy. Some of its parts is
distributed to the places around the brakes, and another part is accumulated in
several vehicle components. This article is focused on the measurement of
temperature increase of selected vehicle components during re-deceleration.
These components include brake discs, brake pads, calliper, wheel rim and tire
side in the area of its bead and tread. The measurements were performed during
the repeated braking of a fully-loaded vehicle according to ECE Regulation No
13 - type I.
Keywords: repeated braking, temperature, brake, heat,
road safety
1. INTRODUCTION
The purpose of friction brakes during vehicle motion is to convert part
of the vehicle’s kinetic energy to another energy [1], and thus, enable the
vehicle to stop or slow down [2]. In the vehicle’s friction brakes,
specifically, where the brake pads contact the friction disc, kinetic energy is
primarily converted into thermal energy [3, 4]. Heat is further distributed to
the other parts of the vehicle as well as to ambient air [5].
Heat accumulated in the friction disc and brake pads can increase the
coefficient of friction to some extent [6]. However, after exceeding a certain
heat value, which is usually 350°C for constant temperature and 800°C
for peak temperature, permanent adverse changes in a material can occur [7]. As
a result of too high temperatures, a vitreous layer can occur, so the
coefficient of friction between the disc and pad is decreased. The disc can
also change its shape, it can be corrugated [8]. Furthermore, concerning the
brake pad, it can lead to separation or destruction of friction lining
resulting in the loss of brake control [9].
Heat from the brake pads also runs to the brake calliper. There is a
piston mounted which is extruded by brake fluid [10]. Therefore, brake fluid is
similarly being heated. An important parameter of brake fluid is its boiling
point. Since it is a hydroscopic fluid, it absorbs moisture through the rubber
gaskets and hose’s sides. The moisture accumulated in the brake fluid
reduces its boiling point [11]. If the brake fluid is heated at boiling point,
the water contained is being transformed into steam. Instead of fluid, steam is
compressible, thus, heating the brake fluid above its boiling point can weaken
the brake control. Wet boiling point, that is, the brake fluid’s boiling
point in a vehicle, usually varies about 170°C [12].
The cycle of heating further includes the rims of wheels as well as tire
beads. The tire bead is the only place where the rim has a connection with the
tire [13]. In the case of excessively high temperatures, there could be a lack
of connection between the rim and tire bead, and it would adversely affect the
vehicle features [14]. Heating of tire disc and rim causes heating of air in
the tire, and it can have an effect on the increase of pressure in the tire
[15].
This article focuses on the impact of vehicle intense deceleration on
the temperature of brake disc and pads, brake calliper, rim of a wheel as well
as on tire beads and sides. The measurements were performed during a vehicle
driving according to the amended methodology of ECE Regulation No 13 - type I
testing. This regulation sets the conditions of brake efficiency testing
during re-deceleration [16]. The results, therefore, reflect the testing status
under legislative conditions.
Significant consideration was given to the warming of brakes during
repeated braking in scientific publications [28, 29, 30]. However, this
research is predominantly focused only on the brake disc itself, or even on the
brake pad [8, 31, 32]. Therefore, the purpose of this article is to measure the
temperature of the other vehicle parts that are being warmed during repeated
braking. Since some of the components are not part of the braking system, yet they
are affected by it and determine the efficiency of braking.
Such research can likewise be done via mathematical modelling as seen in
the publications [6,8,32,33]. The results published in this article were
gathered trough real measurements, although it can be said that the results
from mathematical modelling are not too diverse from those gathered via real
measuring [32].
It can be expected that particular components of the brake disc will
have different temperatures depending on their distance from the centre [31]. To
achieve sufficient accuracy, the brake disc’s temperature will be
measured in the centre of its friction surface [34, 36]. Such accuracy supports
the fact that the measurement in this article is focused on the vehicle
operation, and not on the material from which the components are made
[35].
It is assumed that the components at which the temperature is measured,
will reach a limit temperature but they will not be destructed or permanently
damaged.
2. METHODOLOGY
2.1. Measurement procedure
The general binding ECE Regulation
No 13H describes uniform provisions concerning the approval of passenger cars
in terms of deceleration. Besides other tests, the regulation also provides
type I testing. While testing, the service brakes are tested by being
decelerated 15 times and released with the vehicle loaded under conditions
listed in Tab. 1.
Tab. 1
Test conditions
according to ECE 13, type I
|
V1 (km.h-1) |
V2 (km.h-1) |
Δt (s) |
n |
|
80% Vmax ≤ 120 |
0,5 V1 |
45 |
15 |
where:
V1 is initial speed at the beginning
of deceleration,
V2 is speed at the end of
deceleration,
Vmax is maximum vehicle speed,
n is number of deceleration,
Δt is duration of braking cycle, that
is, time taken between the beginning of one deceleration and the following
beginning of another deceleration [16].
If parameters of a vehicle are not
able to keep the prescribed duration, the regulation permits to make this time
longer. There must always be at least 10 s available for the initial speed of
braking stabilisation.
To enable the temperatures to be
distributed in the required measurement points at the measurement accuracy
acceptable, it was necessary to keep the wheels stable during temperature
measurements [17]. The methodology according to ECE No 13, I has been adjusted
to this situation and, similarly to the situation at which mechanical energy
that is transformed into heat during deceleration would have reached the same
value as for unadjusted methodology. Therefore, the zero speed and the
following relation were needed (1):
![]() (1)
(1)
where:
ΔEKEHK is the difference of kinetic energies at
the beginning and at the end of one braking cycle according to ECE No 13 H,
ΔEKMSR is the difference of kinetic energies at
the beginning and at the end of one surrogate braking cycle.
Equation 1 can be detailed as
follows (2):
![]() (2)
(2)
where:
m is vehicle mass,
V1 is initial speed at the beginning
of braking according to ECE No 13 H,
V2 is speed at the end of braking
according to ECE No 13 H,
VA is initial speed wanted at the
beginning of surrogate braking cycle,
VB is speed at the end of the
surrogate braking cycle. VB
= 0 [18].
After having the values substituted
(3):
![]() (3)
(3)
After having the initial speed
wanted VA (4):
![]() (4)
(4)
To maintain the amount of energy
transformed, the initial braking speed of 103.9 km.h-1 was
calculated.
Time is very important for the
distribution of heat. To maintain the time of mechanical energy transformation
to thermal energy, it is necessary to maintain the same time of deceleration
(5):
![]() (5)
(5)
where:
b is deceleration required according
to ECE No 13 H, 3m.s-2,
Dv is speed difference at the
beginning and at the end of deceleration [m.s-1],
t is time needed for achieving the
change required while deceleration b [19].
Deceleration time can be calculated
via Equation 6, by substituting the values according to ECE Regulation No 13, Equation
5:
 (6)
(6)
After having the time of
deceleration t (7):
 (7)
(7)
The deceleration was repeated 15
times at the initial driving speed of 103.9 km.h-1 up to the final
stopping. Duration of one deceleration was 5.56 s.
Fig. 1 depicts the actual course of
driving speed depending on time.
Fig. 1. Course of driving speed depending on time
2.2 Introduction of parameters into
the dynamometer
The measurements were performed at
the cylinder test station MAHA MSR 1050. Measuring under laboratory conditions
was provided with higher accuracy when compared to road traffic measuring [20].
Fig. 2 shows the vehicle during its measuring at the cylinder test station MAHA
MSR 1050.
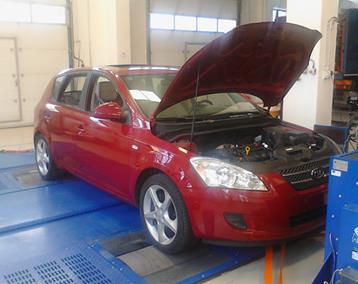
Fig. 2. Vehicle used for measuring and MAHA MSR 1050
The cylinders of the cylinder test
station can both be decelerated and accelerated. To have the cylinder values at
the level of a situation in which a vehicle is real-road driving, it is
necessary to introduce these values into the cylinder test station’s
control computer. The values are achieved by the coasting deceleration
measurement of vehicle resistance under the conditions of Standard EN 30 0556.
Such measurement relies on a vehicle with prescribed laden mass which is
accelerated up to the speed about 110 km.h-1; disconnection between
the engine and wheels and on the recording of vehicle coasting. Fig. 3 depicts
the vehicle deceleration during measurement.
Fig. 3. Vehicle deceleration during coasting deceleration
measurement
The recorded vehicle speed that
depends on the time of disconnection between the engine and wheels is further
introduced into the cylinder test station’s computer. Based on these
values and measurement results, the computer sets the values of deceleration or
acceleration directly at the cylinders during particular driving modes. Thus,
the cylinder test station can fully provide a road driving simulation.
2.3. Vehicle used for measurements
The measurements were performed with
the Kia Ceed. Its technical parameters are given in Tab. 2.
Tab. 2
Technical
parameters Kia Ceed [21]
|
Engine |
1.6 CVVT |
|
Year of construction |
2007 |
|
Engine power |
92 kW/6200 min-1 |
|
Engine torque |
154 Nm/4200 min-1 |
|
Transmission |
5 gearbox, manual |
|
Type of bodywork |
Hatchback |
|
Overall mass |
1,730 kg |
|
Front brakes |
disc, air-cooled, ribbed |
|
Outer diameter of brake
disc |
280 mm |
|
Size of brake pads l x w x
d |
130 x 58.1 x 16.7 mm |
2.4. Device used for temperature
measurement
The temperatures of selected vehicle
parts were measured via FLIR E60 Thermal Imaging Camera shown in Fig. 4.
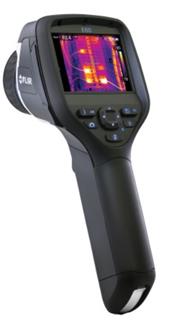
Fig. 4. Device used for temperature measurement [22]
Table 3 shows the technical
parameters of the device used.
Tab. 3
The
technical parameters of FLIR E60 [23]
|
Ir resolution (array size) |
76,800 (320 x 240) |
|
Temperature range |
-20 to 650°C |
|
Accuracy |
±2% rdg. or 2°C |
|
Thermal sensitivity |
<0.05°C (50mK) |
|
Frame refresh |
60 Hz |
|
Field of view |
25° x 19°; Optional lenses available |
2.5. Measurement course
The vehicle brakes were heated up to
the operational temperature by deceleration repetition [24, 25, 26]. Then, the
pedometer sensor was fitted to the brake pedal and its screen was located in
the driver’s field of view to enable them to see the value of brake pedal
force at every moment (Fig. 5).
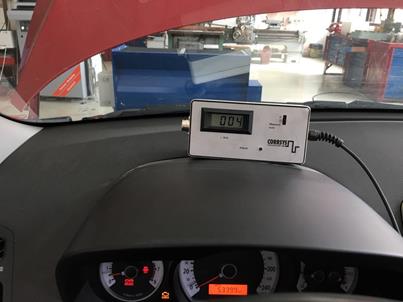
Fig. 5. Pedometer sensor CORSYS
The brake pedal force at which the
deceleration had achieved the parameters calculated was known. After having the operational temperature
of brakes [27], the pictures by the thermographic camera were taken and the
vehicle was accelerated up to the speed of 103.9 km.h-1. Afterwards,
using the fifth transmission gear, the driver depressed the brake pedal sharply
in that force as had been measured during prescribed deceleration. When
the engine had its speed under 900 min-1, the driver depressed
the clutch to avoid the engine’s switching off. Then, the
thermographic camera took the pictures when the wheels were stabilised and the
driver again accelerated the vehicle up to the speed of 103.9 km.h-1.
The whole cycle was repeated 15 times and the time of one cycle was 45 s.
3. RESULTS
Fig. 6 shows the temperatures of
measured points before the beginning of the measurement. The temperature is
given in °C.
As seen from the comparison of both Figs.
6 and 7, before measuring and after heating, the highest temperature was on the
wheel disc, in the area of its nave. After the fifteenth measurement, the
highest temperature could be seen in the area of the brake disc.
The tables below show the
temperatures of the components’ surface after particular measurements.
The results from 1st up to 7th measurement are given in Tab.
4, while Tab. 5 shows the measurements from 8th and 15th.
For better transparency, Fig. 8
shows the measurement results in the form of a graph.
As seen from the Fig. 8, the highest
growth in temperature, from 41.6°C up to 566.7°C, relates to the
surface of the brake disc. Such result is predominantly due to the brake
disc’s feature of absorbing thermal energy that is converted from kinetic
energy and shifting such energy further. The brake pad has the same
feature even though it had lower temperatures. This resulted from
the measurement methodology since the temperature was measured opposite to
the side when there is a connection with the friction area of the brake disc.
The same course of temperature can also be seen in the surface of the brake
calliper.
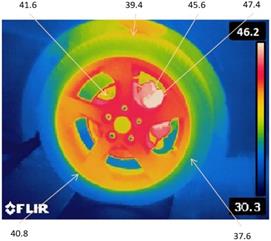
Fig. 6. Initial temperatures
Fig.7 shows the temperatures of
particular components after the final (15th) measurement
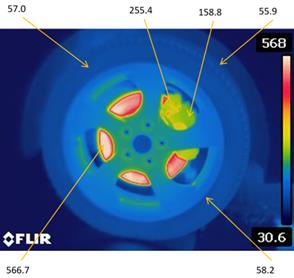
Fig. 7. Temperatures after the final measurement
Tab. 4
Measurement
results no. 1-7
|
Measurement |
0 |
1 |
2 |
3 |
4 |
5 |
6 |
7 |
|
Brake disc [°C] |
41.6 |
100.9 |
149.4 |
230.2 |
288.5 |
301.4 |
348.1 |
415.2 |
|
Tire tread [°C] |
39.4 |
44.2 |
45.2 |
46.9 |
48.7 |
50.2 |
51.4 |
52.4 |
|
Tire side [°C] |
37.6 |
43.1 |
43.4 |
43.9 |
45.8 |
48.0 |
48.7 |
49.8 |
|
Rim [°C] |
40.8 |
41.5 |
41.6 |
42.8 |
43.2 |
45.2 |
46.5 |
48.1 |
|
Brake pad [°C] |
45.6 |
47.6 |
57.9 |
61.5 |
78.1 |
96.3 |
119.9 |
139.0 |
|
Calliper [°C] |
47.4 |
48.8 |
54.5 |
59.1 |
63.1 |
70.8 |
86.0 |
92.1 |
Tab. 5
Measurement
results no. 8-15
|
Measurement |
8 |
9 |
10 |
11 |
12 |
13 |
14 |
15 |
|
Brake disc [°C] |
417.3 |
464.4 |
512.2 |
552.5 |
555.0 |
557.1 |
565.1 |
566.7 |
|
Tire tread [°C] |
53.2 |
53.9 |
54.2 |
54.6 |
54.7 |
55.0 |
55.3 |
55.9 |
|
Tire side [°C] |
50.7 |
51.3 |
52.2 |
52.7 |
53.2 |
54.5 |
55.9 |
57.0 |
|
Rim [°C] |
48.7 |
49.6 |
52.3 |
53.7 |
54.9 |
55.2 |
55.7 |
58.2 |
|
Brake pad [°C] |
151.3 |
177.2 |
192.1 |
206.7 |
221.3 |
227.9 |
237.1 |
255.4 |
|
Calliper [°C] |
99.0 |
121.9 |
127.9 |
132.5 |
148.8 |
154.3 |
158.8 |
171.1 |
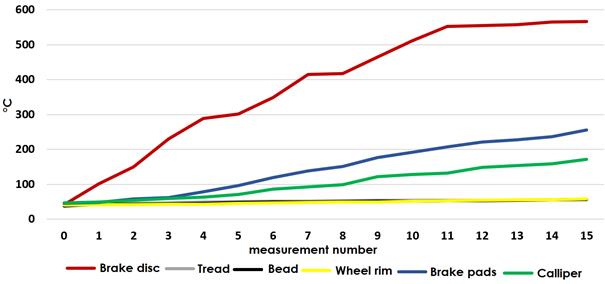
Fig. 8. Measurement results
4. Discussion and Conclusion
While the vehicle is decelerating,
its kinetic energy is predominantly converted into thermal energy that leads to
significant heating of particular components of the wheel and brake system.
Therefore, the parts of the vehicle heated during deceleration must be
constructed from high-temperature resistant materials to ensure the vehicle’s
ability to decelerate.
Using certified brake components
reduces the probability of failure in the braking system during natural
deceleration.
However, it is necessary to replace
brake fluid on a regular basis, since the fluid’s boiling point is
reduced over time. During the measurements mentioned in this article, the
temperature of the calliper was 171°C. It can be presumed that the brake
fluid may have a similar temperature. The value measured, thus, highlights the
need for regular review of the brake fluid’s boiling point, or as the
case may be its replacement every 3 years.
Concerning the brake disc
temperature, the temperatures measured in the publication [7] were similar to
the temperatures measured in this article. In the publication [7], a numerical
solution of the heat-friction problem for a brake pad–brake disc system
during repeated intermittent braking was obtained using the finite element
method. During simulations, the disc’s temperature was about 600°C, which
is similar to our measurements. However, in our case, there were 15
decelerations made, while in the case [7], there were only 10 with substantially
shorter duration of particular braking. Likewise in our measurements, an increase
in temperature after exceeding 500°C was significantly less precipitous.
Thus, there is an assumption that after reaching a certain temperature in the
brake disc and brake pad, the temperature ceases to rise considerably. However,
it can also lead to the damage of these brake components by the longer
influence of high temperatures. This could correspondingly affect the increase
in the temperature of the brake fluid [37].
The brake disc’s temperatures
of nearly 500°C were also reached during the measurements given in
[3]. Through mathematical modelling, there were performed 10 consecutive
decelerations during a period of about 150 s.
The brake disc’s temperatures
of over 500°C were also reached in the publication [36], where during
simulations, the decelerations were not repeated but continuous.
Higher temperatures in the brake
disc and brake pads, as seen in this research, were also measured in the
publication [35], specifically 650°C. In this case, components of
trucks’ braking system were tested and they are of higher strains.
In the other publications explored
[19, 28, 38], there were lower values in temperature measured during
measurements. The reason lies in the fact that in most cases, the braking is
not repeated as much as 15 times, or the decelerations are not performed at such
high driving speeds. Additionally, concerning the high values measured in this
article, another reason can demonstrate those as the vehicle decelerated was
fully loaded and the braking intensity was fairly high. Since the braking was
made until the vehicle stopped, cooling by air flowed was significantly
restricted at low speeds.
The temperatures measured had
comparably high values, however, not so high as to cause damages in vehicle
components. These values highlight the necessity to cover all those features of
particular components that are required by the relevant legislation.
Acknowledgements
This contribution was prepared based on the grant:
VEGA no. 1/0436/18 - Externalities in road transport, an origin, causes and
economic impacts of transport measures.
References
1.
Kapusta J., A. Kalašová. 2015.
„Motor vehicle safety technologies in relation to the accident
rates“. Communications in Computer and Information Science:
172-179.
2.
Shyrokau B., D.W. Wang, K. Augsburg, V. Ivanov. 2013. „Vehicle dynamics with
brake hysteresis”. Proceedings of the Institution of Mechanical Engineers, Part D: Journal of
Automobile Engineering 227(2): 139-150. DOI: 10.1177/0954407012451961.
3.
Ondruš J., J. Vrábel, E. Kolla. 2018. „The influence of
the vehicle weight on the selected vehicle braking characteristics“. Transport
means 2018. Part I: proceedings of the international scientific conference:
384-390. ISSN: 1822-296X 384-390.
4.
Hong Y., T. Jung, C. Cho. 2019. „Effect
of heat treatment on crack propagation and performance of disk brake with cross
drilled holes“. International journal of automotive technology
20(1): 177-185. DOI: 10.1007/s12239-019-0017-8.
5.
Vrábel J., J. Jagelčák, J.
Zámečník, J. Caban. 2017. „Influence of emergency
braking on changes of the axle load of vehicles transporting solid bulk
substrates“. 10th International Scientific Conference on
Transportation Science and Technology (TRANSBALTICA) 187: 89-99. DOI:
10.1016/j.proeng.2017.04.354.
6.
Grzes P. 2019. „Maximum temperature of the disc during repeated braking
applications“. Advances in mechanical engineering 11(3). ISSN:
1687-8132. DOI: 10.1177/1687814019837826.
7.
Adamowicz A. 2016. „Effect of convective cooling on temperature and
thermal stresses in disk during repeated intermittent braking“. Journal
of friction and wear 37(2): 107-112. DOI: 10.3103/S1068366616020021.
8.
Yevtushenko A.A., P. Grzes. 2010. „The
FEM-modeling of the frictional heating phenomenon in the pad/disc tribosystem
(a review)“. Numerical heat transfer part A-applications 58(3):
207-226. ISSN: 1040-7782. DOI: 10.1080/10407782.2010.497312.
9.
Ferodo. „Friction material data sheets“. Available at:
https://www.ferodo.com/support/commercial-vehicles/cv-friction-material-data-sheets.html.
10.
Janoško I., T. Polonec, R. Simor. 2010.
„Electronic encyklopedia of construction engines and vehicles“. 41st
International Scientific Conference of Czech and Slovak University Departments
and Institutions Dealing with the Research of Internal Combustion Engines: 232-238. ISBN:978-80-7372-632-4.
11.
Caban J., P. Droździel, J. Vrábel, B. Šarkan, A. Marczuk,
L. Krzywonos. 2016. „The research on ageing of glycol-based brake fluids
of vehicles in operation“. Advances in Science and Technology Research
Journal 10(32): 9-16.
12.
Avantor. „Safety data sheet“.
Avaliable: https://www.avantorsciences.com/stibo/search/sdsmix000168_us_en.pdf.
13.
Kadhem A., Y. Sadiq, M. Enad. 2018. The
effect of steel wire pre-tension on the tensile properties of bead ply in
rubber tires. 2nd International Conference on Engineering
Sciences-University-of-Kerbala
(ICES-UoK) 433. DOI: 10.1088/1757-899X/433/1/012077.
14.
Čulík K., A.
Kalašová, V. Harantová. 2019. „Creating a virtual
environment for practical driving tests. Communications in Computer and
Information Science 91049: 95-108. DOI: 10.1007/978-3-030-27547-1_8.
15.
Ivanov R. 2016. „Tire wear
modeling“. Transport Problems 11(3): 111-120. DOI:
10.20858/tp.2016.11.3.11.
16.
Regulation No 13-H of the Economic Commission
for Europe of the United Nations (UN/ECE) - Uniform provisions concerning the
approval of passenger cars with regard to braking [2015/2364].
17.
Wernik J. 2014. „Investigation of heat
loss from the finned housing of the electric motor of a vacuum pump“. Applied
sciences – Basel 7(12). DOI: 10.3390/app7121214.
18.
Ondruš J., E. Kolla. 2017.
“Practical use of the braking attributes measurements results”. 18th
International Scientific Conference on LOGI 134. DOI:
10.1051/matecconf/201713400044.
19.
Adamowicz, A. 2016. „Finite element
analysis of the 3D thermal stress state in a brake disk“. Journal of
theoretical and applied mechanics 54(1): 205-218. ISSN: 1429-2955.
20.
Stopka O., A. Šarkan. 2018.
„Quantification of road vehicle performance parameters under laboratory
conditions“. Advances in Science and Technology Research Journal
12(3): 16-23.
21.
Cars-Data. „Kia Ceed 1.6 CVVT“. Available at: https://www.cars-data.com/en/kia-ceed-1.6-cvvt-x-ecutive-specs/18902.
22.
Flrir. „Flir E60”.
Available at: https://www.flir.com/support/products/e60/#Specifications.
23.
Janura R., M. Gutten, D. Korenčiak,
M. Šebok. 2016. “Thermal processes in materials of oil
transformers”. International Conference on Diagnostic of Electrical
Machines and Insulating Systems in Electrical Engineering (DEMISEE): 81-84.
ISBN: 978-1-5090-1249-7.
24.
Sicinska K. 2019. “Age of a
passenger car and its influence on accidents with fatalities in Poland”. Transport
Problems 14(1): 105-11. DOI: 10.20858/tp.2019.14.1.10.
25.
Figlus T., L. Kuczynski. 2018.
“Selection of a semi-trailer for the haulage of long oversize loads,
taking into account an analysis of operational damage”. XI International Science-Technical
Conference Automotive Safety, IEEE Proceedings Paper. ISBN:
978-1-5386-4578-9.
26.
Koziol M., T. Figlus. 2017.
“Evaluation of the failure progress in the static bending of gfrp laminates
reinforced with a classic plain-woven fabric and a 3D fabric, by means of the
vibrations analysis”. Polymer
Composites 38(6): 1070-1085. DOI: 10.1002/pc.23670.
27.
Zhao S.D., Y. Yin, J.S. Bao, X.M. Xiao, et
all. 2019. “Analysis and correction on frictional temperature rise
testing of brake based on preset thermometry method”. Industrial
lubrication and tribology 71(7): 907-914. DOI: 10.1108/ILT-10-2018-0376.
28.
Wallis L., E. Leonardi, B. Milton, P. Joseph. 2002. “Air flow and
heat transfer in ventilated disc brake rotors with diamond and tear-drop
pillars”. Numerical Heat Transfer, Part A 41(6-7): 643-655.
29.
Talati F., S. Jalalifar. 2008. “Investigation of heat transfer
phenomena in a ventilated disk brake rotor with straight radial rounded
vanes”. Journal of Applied Sciences
8(20): 3583-3592.
30.
Belhocine A., M. Bouchetara. 2012.
„Thermal behavior of full and ventilated disc brakes of vehicles“. Journal
of mechanical sciented and technology 26(11): 3643-3652. DOI:
10.1007/s12206-012-0840-6.
31.
Adamowicz A., P. Grzes. 2011. „Influence
of convective cooling on a disc brake temperature distribution during
repetitive braking”. Applied thermal engineering 31(14-15):
2177-2185. DOI: https://doi.org/10.1016/j.applthermaleng.2011.05.016.
32.
Yevetushenko A., P. Grzes. 2011.
“Finite element analysis of heat partition in a pad/disc brake
system”. Numerical heat transfer, Part A: Applications 59(7). DOI:
https://doi.org/10.1080/10407782.2011.561098.
33.
Grzes P. 2017. “Determination of the
maximum temperature at single braking from the FE solution of heat dynamics of
friction and wear system of equations”. Numerical heat transfer part A
– Applications 71(7): 737-753. DOI: 10.1080/10407782.2017.1308711.
34.
Soderberg A., S. Andersson. 2009.
“Simulation of wear and contact pressure distribution at the pad-to-rotor
interface in a disc brake using general purpose finite element analysis
software”. Wear 267(12): 2243-2251. DOI:
10.1016/j.wear.2009.09.004.
35.
Gigan G., T. Vernersson, R. Lundén,
P. Skoglund. 2015. “Disc brakes for heavy vehicles: an experimental study
of temperatures and cracks”. Journal of Automobile engineering.
229(6): 684-707. DOI: 10.1177/0954407014550843.
36.
Adamowicz A., P. Grzes. 2011.
“Analysis of disc brake temperature distribution during single braking
under non-axisymmetric load”. Applied Thermal Engineering 31(6-7):
1003. DOI: ff10.1016/j.applthermaleng.2010.12.016ff.
37.
Kuranc A., G. Zajac, J. Szyslak, T.
Slowik, J. Vrábel, B. Šarkan, et all. 2018. “Boiling point of
the brake fluid based on alkyl ethers of alkylene glycols in vehicles being in
use”. Przemysl Chemiczny 97(12): 2102-2105. DOI:
10.15199/62.2018.12.17.
38.
Afzal A., M.A. Mujeebu. 2019. “thermo-mechanical
and structural performances of automobile disc brakes: a review of numerical
and experimental studies”. Archives of Computational Methods in
Engineering 26(5): 1489-1513. DOI: 10.1007/s11831-018-9279-y.
Received 15.02.2020; accepted in revised form 11.05.2020
![]()
Scientific
Journal of Silesian University of Technology. Series Transport is licensed
under a Creative Commons Attribution 4.0 International License