Article
citation information:
Skrzypczak, I., Kokoszka, W., Pytlowany, T., Radwański, W. Control charts monitoring for
quality concrete pavements. Scientific
Journal of Silesian University of Technology. Series Transport. 2020, 106, 153-163. ISSN: 0209-3324. DOI: https://doi.org/10.20858/sjsutst.2020.106.13.
Izabela
SKRZYPCZAK[1], Wanda KOKOSZKA[2],
Tomasz PYTLOWANY[3], Wojciech RADWAŃSKI[4]
CONTROL
CHARTS MONITORING FOR QUALITY CONCRETE PAVEMENTS
Summary. In this article, Control charts are employed to
analyse the strength quality control of ready-mixed concrete for rigid
pavement. The results of the study support that CUSUM
statistical analysis is more sensitive than the Shewhart
control chart. The CUSUM chart can detect the
continual changes in the concrete quality in a more accurate way. By combining
the CUSUM control chart and the Shewhart
control chart, higher accuracy of quality control analysis could be achieved,
in order words, for quality control performance when in built/pouring the
ready-mix concrete as rigid pavement.
Keywords: pavements, quality,
monitoring, CUSUM charts, Shewhart
charts
1. INTRODUCTION
The intent of a statistical control
chart of the quality of concrete pavements is to provide practitioners in the
field with clear and concise information that will
give them guidance on steps that they can take to construct a durable concrete
pavement. Moreover, this also motivates the exploration of various reliability
and durability related studies [1-7,16-21,26,28-30].
In keeping with this objective, the recommendations provided in code EN 206 [9] and the use of control charts in concrete
production are key references. Publicly funded construction of transportation
facilities in Poland is a multi-billion zlotys industry, which entrusts
taxpayer funds to state transportation agencies (GDDKiA)
and private contractors to provide durability and reliability of public roads.
Currently, the roads are expected to have assured quality.
Early
implementation of quality control charts in the transportation arena is a more
comprehensive approach to consider quality control as an element of quality
assurance. As taxpayers, we expect our investment to yield a long-lasting
transportation system. Improved quality reduces the costs associated with
re-work. These cost savings from improved quality have benefits for contractors
and agencies. Although quality control functions are commonly contractually
delegated to subcontractors, producers, fabricators and manufacturers, the
prime contractor must take the lead role in monitoring the effectiveness of
quality control at all levels during the construction process. Good quality can
only be achieved by a trained labour force utilising materials that conform to specifications, and
which are supported by a QC staff and program that provide timely feedback.
Continuous process improvement and prevention of defects should be the aim of
the contractor and material supply chain. It is far better to prevent defects
rather than become proficient at finding the cause of defects after the fact.
Open and timely communication between all parties is vital to an effective
quality control program based on, for example, quality control chart Acceptance
testing should be based upon samples, which have been obtained in a random
manner to remove any potential bias. Random sampling is also applicable to
contractor testing which will be evaluated using statistical process control (SPC) techniques. Random samples should be obtained in
accordance with EN 206 [9] or other code procedures.
The variability observed in concrete paving projects is attributable to four
sources: material, process, sampling, and testing (Figure 1). It is
important to note that every test result we examined includes these sources of
variability [10-12,14,22-25].
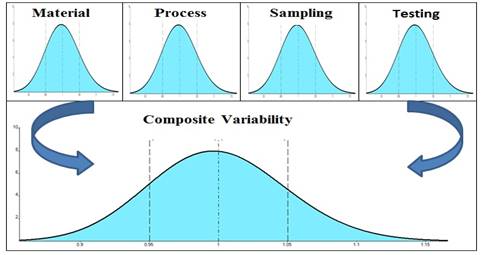
Fig. 1. Sources of
construction variability
Understanding the materials,
precision and bias of each test procedure is critical to proper interpretation
of quality control testing and acceptance testing. The term process control is
often used synonymously with quality control. Reducing variability in materials
and in processes is a focus of quality control efforts. Reduced variability
indicates a higher level of control. The same is true in sampling and testing
activities. We should strive to reduce the variability of our QC testing
activities:
- utilising the same technician,
especially within payment lots,
- all technicians should
be properly trained and certified,
- follow strict adherence
to testing procedures,
- testing equipment should be
calibrated and certified as necessary [10-12,14,22-25].
2. STATISTICAL PROCESS CONTROL
Control charts are
useful tools which when combined with some well-proven rules can assist
contractors in identifying changes in their materials and processes. The
primary purpose of using Statistical Process Control (SPC),
specifically control charts, is to identify change. Their function is not to
indicate whether a test result passes or fails the acceptance criteria, but
rather to indicate if the test result was unusual. Control charts are an effective
means for identifying the impact of assignable causes on the materials and/or
construction processes. Some agencies/contractors use moving average instead of
individual test results as a tool for trend evaluation. Once identified, the
materials and/or processes can be adjusted to account for the influence of the
assignable cause [10-12,14,22-25]. For example, a sharp reduction in air
content may indicate that the carbon content of the fly ash has changed,
requiring an increased dosage of air-entraining admixture [8,13]. Simply put, a
control chart provides a visual indication of whether a process is in control
(Figure 2).
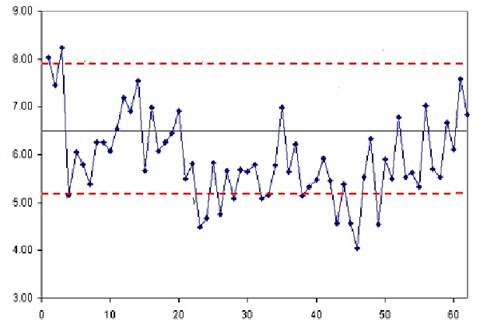
Fig. 2. Control chart for the average air void content according to [24]
3. THE CUSUM
CONTROL CHART
Cumulative Sum (CUSUM) charts
are proven techniques for improving productivity, effective in defect
prevention, prevent unnecessary process adjustments, provide diagnostic
information and provide information about process capability. CUSUM control charts are amongst some of the most important
management control tools. CUSUM control charts
directly incorporate all the information in the sequence of sample values by
plotting the cumulative sums of the deviations of the sample values from a
target value. The CUSUM chart presents the cumulative
sum and they combine information from several samples, thus, CUSUM charts are more effective than Shewhart
charts for detecting small process shifts. If the process remains in control at
the target mean value - μ0, the CUSUM defined in the above equation should vary randomly
about zero. However, if the mean shifts upward to some value μ1 > μ0,
then an upward or positive drift will develop in the cumulative sum (CUSUM). Conversely, if the mean shifts downward to some
value μ2 < μ0, then a downward or negative drift in CUSUM will develop [8,11-14,25,28].
Therefore, if a trend develops in the plotted points
– either upward or downward, we should consider this as evidence that the
process mean has shifted, and a search for some assignable cause should be
initiated. For determining whether the process is out of control, a formal
decision procedure can be laid down in the form of a truncated V-shaped mask
popularly known as V-mask [10,22,23].
CUSUM charts are more effective than Shewhart charts in detecting small and moderate-sized
sustained shifts in the parameters of the probability distribution of a quality
characteristic. Though in some cases, CUSUM charts
are very useful, they are not meant to replace the Shewhart
chart, which can be used to detect a wider assortment of effects due to
assignable causes. It is, therefore, frequently recommended that Shewhart control lines be used in conjunction with CUSUM charts. In Statistical Process Control (SPC) methods, the control charts are major tools used for
monitoring and improving manufacturing processes [10-12,14,22-25].
4. THE APPLICATION OF CUSUM CONTROL CHART
This study shows the Shewhart
control chart and the CUSUM chart applied to analyse contrete compressive
strength for monitoring the changes and variation factors of the trend of
quality concrete intended for building a road. In practical application, the
concrete strength quality will be accepted on the basis of each individual lot
and is established according to the requirements specified in the EN 206 [9] as well, in which, the Shewhart
control chart and CUSUM control chart is recommended
as the basis of quality statistical acceptance.
The Shewhart
control chart and the Tabular CUSUM chart can be
independently applied in the Acceptance control chart. However, distinctive
characteristics exist between the CUSUM and Shewhart control chart. In this respect, the Shewhart control chart does not take into account the
changes in the average value of continuous compressive strength under the same
construction project and the same mixing ration parameter required for
designing the concrete strength, instead, quality control and analysis are
executed for the total lot count of the current concrete displacement.
Unlike the Shewhart
control chart, the CUSUM statistic
analysis method has its own serial and cyclic features, meaning that CUSUM will make reference to the cumulative variation
amount of the average deviation target value obtained from previous samples. In
this way, it will be accumulated to current-term average sample count for
overall consideration in order to effectively evaluate the supplier’s
concrete quality control and stability in the material used in the same
construction site, the same strength mixing ratio, and the same design
strength.
Fig. 3. Shewhart
control chart: X-bar chart and range chart
The CUSUM
quality control chart comprises all the information provided for the average
compressive strength value of the concrete subject selected from the test batch
in appropriate time, for which the previous mean compressive strength value is
set asp,0 for use
as a referential or target value, and the mean compressive strength value of
the respective batch subsequently poured is set as ^1 in order to
continuously detect the minor deviations between each batch. The result of
relevant studies support that, with the quality subjected to normal
distribution (p,o2) and using 3o as the control scope, the trend and deviation pre-alert
of the cumulative and control charts are more sensitive than the Shewhart control chart. The development of the CUSUM method is to detect small shifts and fluctuations of
variables for the mean value in order to provide judgment that is more
sensitive when the mean compressive strength is beyond control.
In practice, the construction industry
usually uses the X-bar-R chart as the concrete strength evaluation method for
executing statistical quality control with the metering value of the pre-mixed
concrete. The purpose of the X bar chart is to measure the stability of the
mean concrete value, and the R-chart is to monitor the accuracy of the
measuring equipment (Fig. 3). In comparison, the CUSUM
chart is used to accumulate the deviation values between the average count of
each sample group and the overall groups to present the development of the
variation trend between the concrete lots. The change of the trend transition
variation can be used to immediately detect minor changes in strength.
The Shewhart
control chart does not take into account the changes in the average value of
continuous compressive strength under the same construction project and the
same mixing ration parameter required for designing the concrete strength;
instead, quality control and analysis are executed for the total lot count of
the current concrete displacement.
The CUSUM
Control Chart makes reference to the cumulative variation amount of the average
deviation target value obtained from previous samples. It will be cumulated to
current-term average sample count for overall consideration in order to
effectively evaluate the supplier’s concrete quality control and
stability in the material used in the same construction site, the same strength
mixing ratio and the same design strength.
The CUSUM
quality control chart comprises of all the information provided for the average
compressive strength value of the concrete subject selected from the test batch
in appropriate time, for which the previous mean compressive strength value is
set 35,04 MPa for use as a referential or target
value, and the mean compressive strength value of the respective batch
subsequently poured is set in order to continuously detect the minor deviations
between each batch.
All data for reference class C30/37 was presented in Table 1. The basic analysis for
formulating a CUSUM chart is as follows:
- Mean
Sample (MS): 45,0 MPa,
- Standard
Deviation (σ) : 5,02 MPa (Standard Deviation of compressive strength from
the initial production),
- Target
Mean Strength (TMS) = fck+2σ, according to [6],
so: TMS = 37 + 2(5,02)= 47,04 MPa.
Data for the CUSUM
plot are presented in Table 1. The column 1 of Table 1 represents concrete
class, column 2 represents the 28-day cube compressive strength (xt) and in column 3 the deviations (both positive and
negative) of TMS (47,04 MPa.) from xt
are calculated.
In general, upward slopes indicate an
increase in mean strength and standard deviation, and downward slopes reflect a
reduction. Minimum fluctuation of test strength of the target mean strength is
desirable. As per Fig. 3, the trend of the graph for the Conventional CUSUM plot shows an increase in the strength trend up to
sample no. 14, after which at sample no. 15 the strength falls below the
specified strength of 35 MPa.
Tab. 1
Calculation of CUSUM
charts
|
No. of samples |
28-Day Compressive Strength [MPa] |
xi-MS [MPa] |
CUSUM Plot [MPa] |
Cumulative sum [MPa] |
|
1 |
40,9 |
0,9 |
0,9 |
6,4 |
|
2 |
37,2 |
-2,8 |
-1,9 |
9,1 |
|
3 |
36,6 |
-3,4 |
-5,3 |
11,2 |
|
4 |
48,6 |
8,6 |
3,3 |
25,3 |
|
5 |
47,2 |
7,2 |
10,5 |
38 |
|
6 |
45 |
5 |
15,5 |
48,5 |
|
7 |
45,5 |
5,5 |
21 |
59,5 |
|
8 |
46,4 |
6,4 |
27,4 |
71,4 |
|
9 |
46,6 |
6,6 |
34 |
83,5 |
|
10 |
44,8 |
4,8 |
38,8 |
93,8 |
|
11 |
44,1 |
4,1 |
42,9 |
103,4 |
|
12 |
37,1 |
-2,9 |
40 |
106 |
|
13 |
43,1 |
3,1 |
43,1 |
114,6 |
|
14 |
40,2 |
0,2 |
43,3 |
120,3 |
|
15 |
34,4 |
-5,6 |
37,7 |
120,2 |
|
16 |
35,1 |
-4,9 |
32,8 |
120,8 |
|
17 |
40,8 |
0,8 |
33,6 |
127,1 |
|
18 |
47,9 |
7,9 |
41,5 |
140,5 |
|
19 |
32,8 |
-7,2 |
34,3 |
138,8 |
|
20 |
38,8 |
-1,2 |
33,1 |
143,1 |
|
21 |
42,5 |
2,5 |
35,6 |
151,1 |
|
22 |
42,9 |
2,9 |
38,5 |
159,5 |
|
23 |
41,4 |
1,4 |
39,9 |
166,4 |
|
24 |
41,1 |
1,1 |
41 |
173 |
|
25 |
32,1 |
-7,9 |
33,1 |
170,6 |
|
26 |
29 |
-11 |
22,1 |
165,1 |
|
27 |
32,9 |
-7,1 |
15 |
163,5 |
|
28 |
40,8 |
0,8 |
15,8 |
169,8 |
|
29 |
39 |
-1 |
14,8 |
174,3 |
|
30 |
41,2 |
1,2 |
16 |
181 |
|
31 |
40,9 |
0,9 |
16,9 |
187,4 |
Though there is again a recovery of
strength up to sample no. 17, the strength again falls below the specified
strength at sample no. 18. Thereafter, the CUSUM plot
shows a negative trend up to sample no. 30. This high degree of fluctuation of
mean strength and standard deviation reveals the fact that the system of
quality monitoring adopted by the RMC plant under study is inadequate. This
also increases the probability of rejection of the concrete by the client.
Fig.3.
Conventional CUSUM chart for compressive strength
To confirm whether a significant change
has occurred, a transparent mask, in the shape of a truncated “V”
is placed over the last CUSUM plotted with the
designated lead point shown in Fig. 2 superimposed over it. If the plot remains
inside the boundaries of the mask, no significant change has occurred, that is,
the concrete quality has not deviated from the desirable level significantly.
The deviations that have occurred are acceptable and these are due to
uncontrollable random factors. However, if the plot crosses a boundary, a
significant trend can be detected and action is required. This mask is applied
to the plot each time a new result is added and further check is made. The V
mask is drawn joining three straight lines, namely, the base of the truncated V
and the two inclined lines joining the base. The base is called the decision
interval (DI) and its length is 8.1 σ. The gradient of the two
symmetrically placed inclined lines is σ / 6 in the case of the mask meant
for detecting a significant change in mean, a being the plant standard
deviation. Application of V-Mask to CUSUM plot as a
daily monitoring tool [9,13].
In Fig. 4, it is observed that by putting
the lead point of the mask on sample no. 16, the CUSUM
plot sample numbers 1 to 4 go beyond the boundary of the mask, which is a
signal that a significant change has taken place in the compressive strength of
concrete or a significant change of concrete class, sample no. 3 (36,6 MPa).
The result of relevant studies support
that, with the quality subjected to normal distribution and using 3o as the control scope, the trend and deviation pre-alert
of the cumulative and control charts are sensitive control chart. The
development of the CUSUM method is to detect small
shifts and fluctuations of variables for the mean value in order to provide
more sensitive judgment when the mean compressive strength is beyond control.
In practice, the CUSUM
chart is used to accumulate the deviation values between the average count of
each sample group and the overall groups to present the development of
variation trend between the concrete lots. The change of the trend transition
variation can be used to immediately detect minor changes in strength.
Fig. 4. CUSUM chart for compressive strength without and with
V-Mask
5. CONCLUSIONS
Offering
products and services of the highest quality is essential for durability,
reliability and security of rehabilitated infrastructure investments, including
roads. Ensuring the proper quality of production and services requires constant
application of properly selected methods and tools enabling the analysis and
evaluation of the processes carried out. Quality control should be active and
not passive, therefore, it is extremely important to constantly monitor
processes, analyse their variability and test their
qualitative ability through the use of control charts.
The CUSUM chart
uses a cumulative variation value, therefore, it should be suitable for
application in the quality control of the concrete compressive strength.
According to practical test application results, this study proposes that the CUSUM control chart should be used in order to objectively
set the overall mean value as the average compressive strength of the concrete
for accumulating to the current compressive strength deviation value. When a continuous
deviation appears in the cumulative quantity of each group, it means that
change has happened to the quality of the concrete compressive strength during
the process and the acceptance and that the reasons must be sourced.
The CUSUM
control chart is used to detect the existence of minor deviation in the target
mean value, whereas, the conventional Shewhart
control chart exhibits more significant changes when a greater deviation exists
in the target mean value. Both have their advantages and weaknesses, and we
suggest that they should be used together. To achieve the stabilised
overall quality, the CUSUM allows for the use of the
V-Mask for compliance control so that the causative reasons may be identified
in advance in order to make appropriate process modification or adjustment.
References
1.
Ahmet Beycioğlu, Adil Gültekin, Hüseyin Yılmaz Aruntas,
Osman Gencel, Magdalena Dobiszewska,
Witold Brostow. 2017.
“Mechanical properties of blended cements at elevated temperatures
predicted using a fuzzy logic model”. Computers
and concrete 20(2): 247-255.
2.
Cihlarova D., P.
Mondschein, S. Capayova.
2018. “Compaction density determination of the road asphalt
layers”. Komunikacie (Communications - Scientific Letters of the
University of Zilina) 20(3): 61-66. ISSN:
1335-4205.
3.
Chakraborty Joyraj,
Andrzej Katunin. 2019. “Structural diagnosis of
rail vehicles and method for redesign”. Diagnostyka 20(1): 103-110. DOI: https://doi.org/10.29354/diag/100448.
4.
Czarnecki Lech, Piotr Wojciechowski. 2012. Modelling of
concrete carbonation; is it a process unlimited in time and restricted in
space?” ACI Materials Journal 109(3):
275-282.
5.
Czarnecki Lech, Piotr
Wojciechowski, Grzegorz Adamczewski. 2018. “Risk of concrete carbonation with mineral
industrial by-products”. KSCE Journal of Civil Engineering 22(2): 755-764
6. Deja
Jan. 2003. “Polish roads”. Review
of Road and Bridge Technique.
7.
Dobiszewska Magdalenia. 2017. “Waste materials used in making mortar and concret”. Journal
of Materials Education 39(5-6): 133-156.
8. Dutta Goutam,
Debasis Sarkar. 2008. Design and Application of
Risk Adjusted Cumulative Sum (RACUSUM) for Online
Strength Monitoring of Ready Mixed Concrete. Indian Institute of Management
Ahmedabad, India.
9.
EN
206: 2013 Concrete: Specification, Performance, Production and Conformity.
10.
Eugene
L. Grant, Richard
S. Leavenworth. 1988. Statistical
Quality Control. McGraw-Hill, USA. ISBN-10:
0070241171.
11.
Dong
Han, Fugee Tsung, Xijian Hu and Kaibo Wang. 2007.
“CUSUM and EWMA
Multi-Charts for detecting a range of mean shifts”. Statistica Sinica 17: 1139-1164.
12.
Fah Fatt Gan. 1991. “An optimal design of CUSUM quality control charts”. Journal of Quality
Technology 23: 279-286.
13. Gibb Ian, Tom A Harrison. 2010. Use of control charts in the production of concrete. DOI:10.13140/RG.2.1.3233.7045.
14.
Goel
Amrit L., S.M. Wu. 1973.
“Economically Optimum Design of CUSUM
Charts”. Management Science 19: 1271-1282.
15. Jasiczak
Józef. 1992. Kryteria kontroli
stabilizacji wytrzymałości betonu na ściskanie określane
metodami probabilistycznymi. [In
Polish: Criteria for controlling the
stabilization of concrete compressive strength determined by probabilistic
methods]. Poznan: WPP.
16.
Macioszek Elżbieta.
2017. “Analysis of Significance of Differences Between
Psychotechnical Parameters for Drivers at the Entries
to One-lane and Turbo Roundabouts in Poland”. In: G. Sierpiński
(Ed.). „Intelligent Transport
Systems and Travel Behaviour”. Advances
in Intelligent Systems and Computing 505: 149-161. Springer International Publishing Switzerland.
17.
Mackiewicz Piotr.
2015. “Analysis of stresses in concrete pavement under a dowel according
to its diameter and load transfer efficiency”. Canadian Journal of Civil Engineering 42(11): 845-853.
18.
Mackiewicz Piotr.
2015. “Finite-Element Analysis of Stress Concentration around Dowel Bars
in Jointed Plain Concrete Pavement”. Journal
of Transportation Engineering 141(6).
19.
Mackiewicz Piotr. 2014.
“Thermal stress analysis of jointed plane in concrete pavements”. App. Therm. Eng. 73: 1167-1174.
20. Matić B., D. Matić,
D. Ćosić, S. Sremac,
G. Tepić, P. Ranitović.
2013. „A model for the pavement temperature prediction at specified depth”.
Metalurgija
52(4): 505-508.
21. Matić B., D. Matić,
S. Sremac, N. Radović,
P. Vidikant. 2014. „A model for the pavement temperature prediction at specified
depth using neural networks”. Metalurgija 53(4): 665-667.
22. Montgomery Douglas C. 2008. Introduction to statistical quality
control. Wiley, New York. NIST/SEMATECH e-handbook of statistical methods.
23.
Montgomery Douglas C. 1980. “The Economic Design of
Control Charts: A Review and Literature Survey”. Journal of Quality
Technology 12: 75-87.
24.
Pavement interactive. Available at:
https://www.pavementinteractive.org/reference-desk/qc-qa/statistical-acceptance/control-charts/.
25.
Sarkar
D., B. Bhattacharjee. 2003. “Quality Monitoring
of Ready Mixed Concrete Using Cusum System”. Indian
Concrete Journal 7: 1060-1065. DOI: 10.1002/best.200810114.
26. Sheng Li, Zhaohui Liu.
2012. „Study on crack extension
of the AC layer of CRC+AC composite pavement”. Mechanika 18(2): 141-147. ISSN
1392-1207.
27.
Shih-Hui
Hsu. 2007. Quality Management, Future
Career Management Corporation. FCMC, Taipei.
28.
Shin-Yi
Chen. 2009. “The concrete is in charge of application and improvement of
drafting”. Concrete Technology
3. Taiwan Concrete Institute. Taipei.
29.
Sztubecka Małgorzta, Adam Bujarkiewicz, Jacek Sztubecki. 2016. “Optimization of Measurement Points Choice in Preparation of
Green Areas Acoustic Map”. Civil
and Environmental Engineering Reports 23(4): 137-144.
30.
Szydło
Antoni. 2004. Road pavements made of
cement concrete. Theory of dimensioning. Cracow: Polski
Cement.
Received 07.11.2019; accepted in revised form 15.01.2020
![]()
Scientific
Journal of Silesian University of Technology. Series Transport is licensed
under a Creative Commons Attribution 4.0 International License