Article
citation information:
Buczak, I., Giza, P., Janas, A.,
Kosiba, A., Sobinek, K., Rysak, M., Panicz, J., Płaneta, P., Lipień, K.,
Kogut, W., Masoumi, H.E. Socio-demographic and land use determinants of non-commute travel
generation in Cracow, Poland. Scientific
Journal of Silesian University of Technology. Series Transport. 2020, 106, 5-28. ISSN: 0209-3324. DOI: https://doi.org/10.20858/sjsutst.2020.106.1.
Izabela
BUCZAK[1],
Paulina GIZA[2], Aneta
JANAS[3],
Andrzej KOSIBA[4],
Katarzyna SOBINEK[5], Monika
RYSAK[6], Justyna
PANICZ[7],
Patrycja PŁANETA[8],
Krzysztof LIPIEŃ[9], Witold KOGUT[10], Houshmand E. MASOUMI[11]
SOCIO-DEMOGRAPHIC
AND LAND USE DETERMINANTS OF
NON-COMMUTE TRAVEL GENERATION IN CRACOW, POLAND
Summary. The circumstances of passengers’ decisions and
behaviours concerning non-commute urban travels in Eastern Europe is not
well-studied; most of the studies on this topic was done on Western societies.
This paper presents the results of a study on Cracow, Poland. This study is
based on a survey in two neighbourhoods of different urban forms in Cracow, one
with central structure with compact land use and the other a representative of
socialist urban form with big residential blocks and no central local places.
The survey was carried out from January to February 2019 with 426 inhabitants.
The results of the Ordinary Least Square models reveal that age, daily
activity, the place of shopping, frequency of shopping in the vicinity of
homes, and frequency shopping activities outside in farther places are
significantly correlated with the frequency of non-work trips in Cracow. The
sprawled decentral district produces a high correlation between shopping trips
outside the district and the overall non-work trip frequency, referring to the
failure of the socialist urban form to keep non-work trips inside the districts
by the presence of local facilities like shops and retail. It is discussed in
this paper that such correlations may be very much context-specific, as there
are some differences between the findings of this paper and those of international
findings in high-income and developing countries.
Keywords: urban transportation
planning, travel behaviour, non-work trip generation
1. INTRODUCTION
The existing studies about Eastern European cities
provide limited understanding of the determinants of home-based non-commute
urban travels. In other words, we don’t know what exactly defines the
characteristics of these urban trips. Like several Eastern and Central European
countries, Polish cities are less studied compared to their Western counterparts.
A literature review was done in this study, the results of which are presented
below, show that there is some data about non-work urban travels in Polish
cities, but it is difficult to integrate land use and urban form in analytic
studies based on these data. Moreover, the number of studies that provide
statistical models of non-commute trips using primary disaggregate data is
limited, hence, it is difficult to draw an inclusive conclusion about the
determinants of these urban trips. To be more specific, we do not know exactly
if the socio-economic factors or other determinants such as land use traits lay
significant effects on the number of home-based non-commute trips in Poland.
The goal of this study was to assess
the socio-demographic and build environment relationships with mode choice for
individual visitors found for non-work travel and contrast these outcomes with
establishment-level analysis of mode shares in Cracow, Poland. To do this, we
utilised a customer intercept survey at very different
establishments—convenience stores, restaurants, and bars. The analysis
depends on destination-based information, unlike a majority of the travel
behaviour research, which generally depends on data gathered from home areas.
Additionally, a couple of other studies control for specific land-use types.
This manuscript is continued by a
literature review of urban travel behaviour in Poland and existing data about
non-commute travels. Then, the methods including survey, data, case-study
areas, and analysis methods of this study are introduced, and findings are
presented in the form of descriptive statistics and model fit. Finally, the
relations between the empirical findings in Cracow, Poland with the
international studies, and well as the concluding remarks about urban and
transport planning in Poland were presented.
1. TRAVEL CHARACTERISTICS AND THE NON-COMMUTE
TRIPS
Recent urban transportation planning
literature has found various associations between transportation requirement
and different elements like the accessibility of facilities, the dimension of
motorisation, city structure, the pace of financial development, neighbourhood
culture, etc. [14,18,19].
It is still desirable to
investigate the connections among these components to have the capacity to get
a handle on present and future travel request in many geographical contexts,
especially Eastern Europe.
Individual travel choices are suppose to
be impacted by the places where people live and work. Many blame
“sprawl” for congestion and overuse of automobiles, and trust that
transit access, roads, the distance to shops and services, and spatial
attributes of the manufactured environment may all impact how people travel to
shops, to activities, and to other places not related to work travel. In any case,
it is widely acknowledged that such influences are complex. Some empirical
research recommends that there is a strong connection between the built
environment and non-commute travels, while other research, often using
different model specifications, data, or measures of travel, find little or no
relationship. This difference is partially because relationships between travel
and the built environment are undertheorized. „The
conceptualisation and operationalisation of “density”
provide a primary example. Development density is a basic planning concept, however, in practice,
it is complex and difficult to implement for use in controlling trip
characteristics” [7,11,23].
In the course of the past three
decades, a very large body of research has risen on how built environments
impacts travel. Studies have
analysed travel in numerous dimensions: the amount of trips, the frequency of
trips, trip goals, and trip lengths, and travel modes. Measures of the built
environment are incorporated as continuous objective measures, subjective
measures got from survey participants, or categorical measures derived by
specialists. Travel is normally analysed at either an aggregate level or a
disaggregate level. Aggregate analyses are typically performed to estimate mode
splits or vehicle miles travelled (VMT) at the level of TAZs, census tracts, or
metropolitan areas. Disaggregate analyses are typically actualising at the
level of the individual or household, and outcomes are often individual travel
mode choices or number of trips made by mode. Disaggregate analysis let for more complete
models, as there is finer detail in spatial, temporal, and personal information
[12]. Fig. 1 illustrates
the percentages of travels based on travel purposes in six international cities
with different cultures. As
seen, the share of non-work travels may differ dramatically in accordance with
the culture and geographies of the cities.
The share of such studies in
different regions and countries of the world is different. A large part of the studies done on urban
travel behaviour and especially the characteristics of the non-commute travels
are related to the USA. Although the territory of the USA is huge and diverse,
some similarities can be noticed in the communication behaviour of the population.
A lot of research has been done on this topic with most of them focused on
large and medium-sized cities and commute travels. All studies regarding
commute and not commute exchange such factors as age, sex, income, car
ownership, land use mix, street networks employment and emphasise the
importance of their role in shaping travel. Studies about preferences and dependencies on
non-work travel among Americans were carried out, inter alia, in California
(San Francisco Bay Area) and in Boston
[6].
Generalising research that has been
improved over the recent years; conclusions can be drawn about residential
travel behaviour: people with high income prefer to travel alone rather than
with someone else, prefering also the shared-ride mode than the transit mode. The more cars in the household, the less
likelihood of using one vehicle by several people. If someone lives on the
outskirts of the city, he uses more car to travel. Additionally, that person travels less on
non-work trips than a resident who lives in the centre [2].
Fig. 1. Share of the trip purposes based on time of the
day in six international cities
[22]
High
mobility of people contributes to the reduction of social and economic
differences between regions. It is also very beneficial from an economic point
of view. Several recent empirical studies
have shed light on the causal relationships that underlie the correlations
between a built environment and travel behaviour [13]. In
Europe, as in the United States, people do not change their place of residence
because of entertainment and other motivations like shopping and entertainment
but their main motive is usually proximity to workplace. This is something
common in parallel with Poland, where like several other European countries,
people would travel on a small distance rather than long trips. It is a
convenience to change the residence place when someone starts a new job. If one
gets employment in another city, he rents a flat there and moves permanently.
As it appears from the PageGroup survey in Europe, private car access to for example shopping has the most proponents. 66% of all respondents admitted that they usually choose a private means of transport. Over two fifths are in a way forced into the car - because they have limited possibilities of using public transport. In all of Europe, 34% of people use public transit, with most of them (75%) appreciating its effectiveness. An additional advantage of public transport means is their relatively low costs (60%) and speed of getting to different motivations (44%) – especially when you can commute by metro or high-speed train. For 40% of respondents, a significant advantage of public transport is to avoid parking problems. Among the surveyed countries: Austria and Switzerland exceed 90% satisfaction with public communication. The European average is lowered by Italians; only 54 per cent. People using public communication acknowledge its effectiveness.
In Poland, a series of deliberations
titled Comprehensive Travel Study (KBR) have been carried out mostly in large
cities. They concern surveys
in household and measurements of vehicles and travellers in private and public
transport. The intention is to learn about the daily transport user’s
behaviour of the inhabitants that pursue rational transport policy. On their basis is developing
transport model, which analyses the volume and conditions of traffic in the
road network and public transport depending on the changes in spatial
development (construction of a housing estate, shopping centre) and changes in
road infrastructure (construction of a road or tramway line) [22].
In Warsaw, six of such
surveys was carried out, the last of which was in 2015. The mobility rate of
Warsaw residential amounts to 1,99 trips. On a working day, almost 82 % of
residents make at least one trip per day. Residentials who do not travel so
much are elderly people (pensioners) and non- working and unemployed people.
Fig. 2 shows a chart of travellers and non- travellers by age.
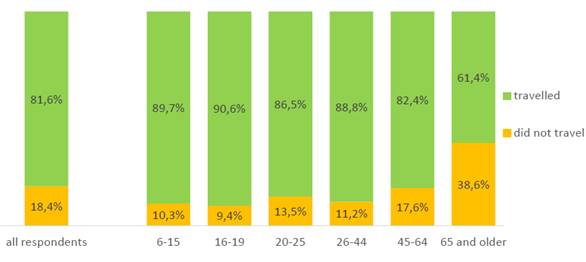
Fig. 2.
Travels performed by residents of Warsaw on a typical working day [22]
Based
on the chart (Fig. 3), the most frequent destination accounts for 44,1% trips
about motivation home – work and work – home. Next, the travel between
home and other destination 35,1% and 11,1% trips between home and place of
study. The remaining 9,7% are trips not
relevant to the home. Modal split shows (Fig. 4) that Warsaw residents
primarily travel by public transport (46,8%) or as a passenger car (31,7%).
Nearly, one in five (17,9%) trips are on foot and the rarest choice of
transport is a bike (3,1%). In all the destinations (also trips between home
and work), the choice of car in trips was purposeful by its ownership.
Three out of four
non-pedestrian travels are executed without having to change vehicles. Trips by mass transit
take place without transfers of 57,2%. The majority of trips of inhabitants of
Warsaw begin and end in Warsaw (95,5%). Only 4,5% of all trips have their
inception or destination outside Warsaw [21].
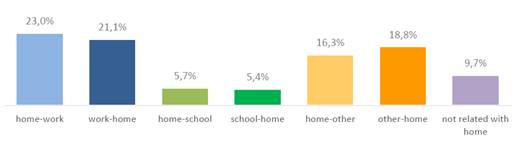
Fig. 3. Travel purposes
of Warsaw residents [22]
Fig. 4. Modal split
of the respondents [22]
In 2009, mobility
estimate of Wroclaw residents amounted to 1,87 trips (1,87 daily trips for
Wrocław inhabitants). The most trips by all day, on average 2,05 are
complied by people who have got more than two cars and residents who are 26-39
years of age. The busiest occupational group are persons working on their own
(enterprisers); they make an average of 2,59 trips daily. The house is the
basic travel destination of the inhabitants of Wroclaw and constitutes 45% of
all travels. Following destination is work, which accounts for 21% of trips [24].
Execution of the
2018 Comprehensive Travel Study shows that the mobility of inhabitants of
Wroclaw is as follows 1,7 trip/ day. The average number of cars in the
household in Wroclaw equal 0,5 (265 cars/ 1000 residents). The residents travel
by car most often (41%). While the second most frequently chosen mode of
transport is public transport (28%), then are trips on foot (24%) and travel by
bike (6%). 38% of all trips have a motivation home - work (20%) and work - home
(18%). The men often performed work and study trips. The reason for choosing
car transport in commuting is the convenience of use and short commuting time.
Whereas the reason for choosing public transport is more varied. Firstly, the
convenience of use, and secondly, the close location of stops, and third short
commuting time [8].
The fifth Comprehensive
Travel Study in Cracow was held in 2013. Based
on it, the most important indicators characterising Cracow’s transport
system were determined. 97.5% of the travels were
internal (takes place in the city of Cracow), while 2.5% was outside of the
city [3].
The survey shows that 57%
of households have access to at least one passenger car and 45% do not have a
car. The average number of home-based travels Is 2.02 trips per day. The
largest number of trips is made by people aged 30-39 (mobility rate 2.13). The
least number of trips is made by people after 60 years of age (mobility rate
1,42).
Travels about motivation
home-work (18,1%), work-home (15,8%) and other-home (19,8%), home-other (17,2%)
was the main destination of Cracow inhabitants. Public transport (36,3%) and
car (33,7%) was the dominant means of transport in the travels residents. The
share of pedestrian travel was 24, 8%. Moreover, the research indicated that
20% of residents reach Midtown by car. The reason for choosing a car is the
accessibility of travelling and the inappropriate offer of public transport and
“the nature of the work requiring the use of a car”. An incentive to opt
out of commuting to Midtown by car is the ability to reach public transport
quickly (37,1%), free parking near the city centre (36,7%) and increase of the
public transport frequency (28,3%) [20].
Primarily, the previous enactments about
Warsaw, Wroclaw, and Cracow shows that the non-commute travels in these cities
especially the home-based ones make a large percentage of the whole urban
travels. In spite of the fact that we possess these data, statistical analysis
is still needed to interpret the associations between different determinants of
trip behaviours, as well as the provenance of the mobility decisions. The
current data about Polish cities as such cannot be accurate about these
circumstances. Thus, the present study about Cracow as a typical large Polish
city was initiated.
1.1.
Research Questions and Hypotheses
The research questions
answered in this study are (1) what are the determinants of non-commute travel
generation (shopping and entertainment) in Cracow, Poland?, (2) What are the
differences in terms of travel generation in compact, central districts with
those of the sprawled, decentral districts?
The general hypothesis of
this study concerns the impact of various factors on the commute and
non-commute travel generation. Traffic generating factors is location;
individual factors and socio-economic considerations; transport aspects (modal
split, availability of alternative means of transport in relation to the car,
advantages and disadvantages of different modes of transport) or land use and
urban form (number of public and commercial services, amount of greenery,
distance from the destination).
1.2.
Case study areas
For the analysis of non-commute
travels in Cracow, two districts of the city were selected based on their
characteristics: Piasek Północ and Kurdwanów. Residential
area Piasek Północ is located in Stare Miasto district in the
central part of the historical part of Cracow, while the residential area
Kurdwanów is located on the edge of the city (south of the centre) in
Podgórze Duchackie district. In Stare Miasto district (including Piasek
Północ), 37 528 people live in a 5,59 km² area, so the
population density of the whole district is 6 710 inhab./km², while in
Podgórze Duchackie district (including Kurdwanów) 54 637
inhabitants live in 9,54 km², resulting in a population density of 5
435 inhab./km² [4].
Over the centuries, the districts of
Cracow have been influenced by historical events, including the Austrian
partitions or the German occupation. In 1991, 18 districts were established,
the territorial division of which is still valid today. The locations of the
analysed districts are presented against the background of the city of Cracow
in Fig. 5.
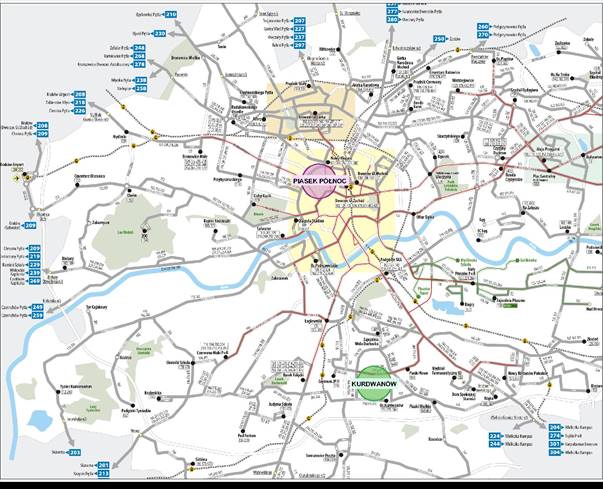
Fig. 5. The location of the two case-study areas: Kurdwanów and
Piasek Północ
The territorial development of
Cracow over the years is presented below. The map [15] from 1788 shows the location of the housing
estate in relation to the old town. Then, Piasek Północ was not
part of Cracow, however, it was annexed to the city in later eras. Due to its
history, the area accommodates many historical and cultural values for
centuries, the layout of the streets has remained unchanged. One can also
notice the effect of urban sprawl by connecting nearby villages to Cracow.
During the Four-Year Sejm (1788-1792), it was established that suburban areas
(including Jura Piasek) joined the city. Then the city was divided into four
circuits (the equivalent of districts), the second circulation included the
analysed area.
In the map from the 19th century
guide “Cracow and its surroundings” [16]. It can be noticed that the analysed Piasek
Północ estate was then defined as Przedmieście Piasek, which
was already entering the city limits. Piasek was the fourth district of Cracow
in 1891 as indicated in the book titled “Guide to Cracow and
surroundings” [17].
It is also interesting to present a public transportation network that depicts
the tramline run by the two bypasses of Cracow – Adam Mickiewicz Avenue
and Juliusz Słowacki Avenue.
The latest plan of
Cracow published in 1935 by the Polonia publishing house is the second edition
of the plan by Stanisław Wyrobek [1]. It can be noticed that Piasek Północ has slightly
changed since then, the street layout and building quarters are very similar to
the current state. Contributing to this may be the fact that during
the Second World War and the occupation, Polish Cracow was not destroyed and
devastated. One can also observe the differences in the aforementioned
tramlines. In this edition, it was not planned to be built along the alley, its
place was taken by a green belt in the middle of the street. A side map was
also inserted showing the surroundings of Cracow, where it is shown that
Kurdwanów does not belong to the city yet. In 1941, the German
occupation authorities extended the administrative boundaries of the city by
joining the surrounding municipalities and towns, creating districts of Cracow
from them, among others X – Borek Fałęcki in which
Kurdwanów is located [9].
In
1948, this extension was confirmed by Polish authorities. In the 1980s, on the
border of Wola Duchacka and Kurdwanów, a large housing estate began,
which adopted the name Kurdwanów Nowy (a central part of the estate was
created). Actual construction of the estate began in 1980. At that time, tens
of 5 and 11-storey blocks were built. Until the early nineties, the urban
structure of the housing estate was formed. Buildings were built after the era
of socialist urban planning, where they were popular affordable housing encouraged
by socialist approaches. Many new multi-family blocks erected in various
technologies and styles have been created and are still being built.
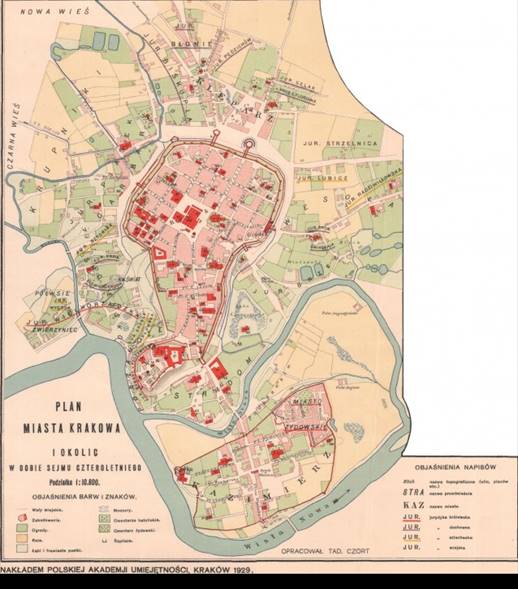
Fig. 6. Plan of the city of Cracow and the
surrounding area in the year 1788
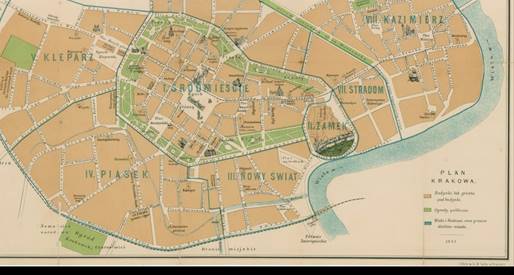
Fig. 7. Location of Piasek
Północ Cracow in the year 1891 [10]
Piasek Północ
is mainly characterised by multi-family housing in the form of urban block and
frontage along the street. All these create a dense downtown development, in
addition, are services on the ground floor of tenements. There is a negligible
amount of greenery there. The opposite can be seen in Kurdwanów, where
there are multi-family buildings, but in the form of modernist blocks or
detached houses. The service buildings are mainly free-standing buildings or
services on the ground floor. Green areas are green companion plants or small
parks and green squares.
In terms of public
transport service, both analysed areas are good. In the case of Piasek
Północ, there are five public transport stations (all serviced by
bus, including three serviced by tram). The arrival times and distance are
convenient for transport users. While in Kurdwanów, there are seven
stations (four serviced by bus and three serviced by tram). A huge
difference is in the case of the parking situation in the two areas. Piasek
Północ does not have enough space, so the number of parking spaces
is limited, whereas Kurdwanów does not suffer from this issue so much.
In the north-western part of the estate, there is a park and ride car park
integrated with trams.
Worthy of note is the
bicycle infrastructure. In Cracow, there is a city bike system named Wavelo. It
can be noted that there are four city bike stations in Piaski
Północ and three stations in Kurdwanów. In Kurdwanów, there are no
bicycle routes, only suggested roads are indicated, while in Piasek
Północ, there is a cycling route network.
The two areas were
selected for analysis due to the diversity in terms of land development, the
number of services, and the accessibility to public transport. An important
factor was also the proximity to the centre, which generates a large number of
tourists in Piasek Północ and the fact that there are many more
commercial and public services within walking access. These above
characteristics motivated selection of the two areas, aiming at having two
different case-study areas in terms of land use.
|
|
|
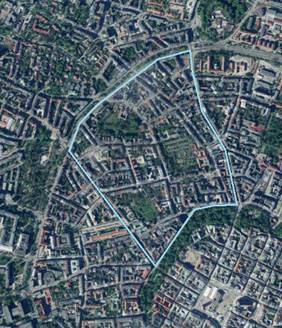
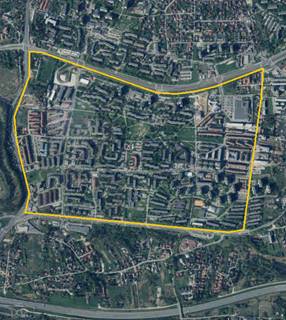
Fig. 8. The urban form and layout of
the two selected areas: up: Piasek Północ; bottom: Kurdwanów
|
|
|
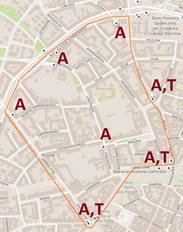
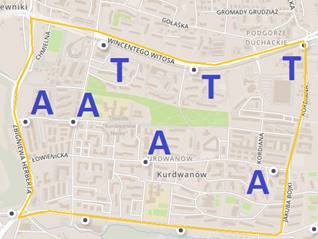
Fig. 9. Accessibility to bus stations (A) and
tram (T) in Piasek Północ (left) and Kurdwanów (right)
1.3.
Data and survey
The data used for this
study come from responses to questionnaires with 42 questions that included
information on urban travel behaviour of Cracow’s adults. The survey was
carried out from January to February 2019 on 426 inhabitants of the two neighbourhoods
in Cracow. Randomly selected persons on the streets of these neighbourhoods
were asked to participate in the interview. The two areas selected for the
survey differ in terms of spatial layout and structure as mentioned in the
previous section.
Piasek Północ
is a neighbourhood in a high-density area. It has a mix of residential,
business and commercial functions. There is also access to the public transport
system and good conditions for pedestrians. A little bit different is Kurdwanów.
It is a neighbourhood where building densities and the land use mixing are
lower. There residential locations dominate due to lack of retail facilities,
distance to the nearest shop is longer. However, there is access to public
transport system.
The questionnaire consisted
of four parts. The first one was related to socioeconomics. The survey asked
respondents among others about gender, age, and gross income. The second part
was focused on activities and special issues of inhabitants. The questions
referred to the frequency of travel and trip purpose. The mobility patterns
were the subject of the other part of the survey. Respondents were asked about transport
mode choice for commute and non- commute travel. The last part was focused on
perceptions, attitudes, and self-selections. The questions referred to
inhabitants’ feelings about their neighbourhood. Table 1 summarises the
variables developed based on the questions asked in the interviews.
Tab. 1
Summary of
variables
|
Section |
Variable number |
Variable |
Data Type |
Description |
|
Socioeconomic |
1 |
Gender |
Binary |
Male
or female. |
|
2 |
Age |
Continuous |
Reported
age of the respondent. |
|
|
3 |
Daily Activities |
Binary |
Work/study or none. |
|
|
4 |
Driving License Ownership |
Binary |
Possession
of a driving license by the respondent: yes or no. |
|
|
5 |
Car Ownership |
Categorical |
The
number of personal cars possessed by the respondent. |
|
|
6 |
Monthly Living Cost |
Continuous |
Reported
gross household monthly income. |
|
|
7 |
Daily Travel Cost |
Continuous |
Reported daily travel cost |
|
|
Activities and special issues |
8 |
Frequency
of Non- Commute Trips |
Continuous |
The
number of non-commute trips of the respondent during the past seven days. |
|
9 |
Shopping Place |
Binary |
The
place the respondent usually shops daily living stuff: inside the
neighbourhood or farther. |
|
|
10 |
Frequency
of Shopping Inside the Neighbourhood |
Continuous |
The
number of shopping inside the neighbourhood during the past seven days. |
|
|
11 |
Attractive
Shops in the Neighbourhood |
Binary |
Presence
of attractive shops in the neighbourhood of the respondent according to him/her:
yes or no. |
|
|
12 |
Frequency
of Shopping Outside the Neighbourhood |
Continuous |
The
number of shopping outside the neighbourhood during the past seven days. |
|
|
Mobility patterns |
13 |
Shopping/Entertainment
Mode Choice Inside the Neighbourhood |
Categorical |
Mode
choice for respondent’s shopping or recreational activities inside the
neighbourhood: car, on foot, bicycle, taxi, taxi apps, bus, train, tram. |
|
14 |
Shopping/Entertainment
Mode Choice Outside the Neighbourhood |
Categorical |
Mode
choice for respondent’s shopping or recreational activities outside the
neighbourhood: car, on foot, bicycle, taxi, taxi apps, bus, train, tram. |
|
|
15 |
Frequency of Commute Trips |
Continuous |
The
number of commute trips of the respondent during the past seven days. |
|
|
16 |
Commute Mode Choice |
Categorical |
Mode
choice for respondent’s commute trips: car, on foot, bicycle, taxi,
taxi apps, bus, train, tram. |
|
|
17 |
Reason for Mode Choice |
Categorical |
|
|
|
18 |
Frequency
of Public Transport Travels |
Categorical |
The
usual frequency of the respondent’s public transportation ridership
according to him/her: every day, a few times per week, a few times per month,
rarely, almost never. |
|
|
19 |
Reason for
Non-Public Transport Use |
Categorical |
The
respondents were asked “If you do not use public transit, what is the
reason?” Options: It is not comfortable, It is expensive, Station/bus
stop is far away, There is no public transport, It is slow Social problems, I
prefer my own car. |
|
|
20 |
Subjective
Security of Public Transport |
Categorical |
The
level of the securing of public transportation according to the
respondent’s perception: very secure, secure, medium, insecure, and
very insecure. |
|
|
21 |
Reason for
Public Transport Use |
Categorical |
The
respondents were asked “If you do use public transit, what is the
reason?” Options: It is not comfortable, It is cheap, Station/bus stop
is near, It is fast, I do not have a car. |
|
|
Perceptions, Attitudes & Self Selections |
22 |
Sense of
Belonging to the Neighbourhood |
Binary |
Respondent’s
perception about his/her sense of belonging to the neighbourhood: yes or no. |
|
23 |
Entertainment Place |
Binary |
The
place the respondent usually goes to entertainment activities: inside the
neighbourhood or farther. |
|
|
24 |
Residential Location Choice |
Categorical |
The
main reason of choosing the living place and the neighbourhood from the
following options: affordability, proximity to working place/school,
attractive surrounding environment, live here since I was born/my childhood, good public transport. |
|
|
25 |
Advantages of the Neighbourhood |
Categorical |
The
respondents were asked: “What kind of advantages does your
neighbourhood have?“ Options: Lots of public space, There is good
public transportation, Well connected to the centre. |
|
|
26 |
Disadvantages of the Neighbourhood |
Categorical |
The
respondents were asked: “What disadvantages does your neighbourhood
have?” Options: Lots of traffic jams, Polluted area, Lack of safety,
Loud at night, High costs of living. |
|
|
27 |
Last Relocation Time |
Continuous |
The
number of years passed from the last residential relocation of the
respondent. |
|
|
28 |
Personal Character |
Binary |
The
respondents were asked: “Which personal character is true about
you?” Options: I enjoy driving a car very much, I am pro-environment, I
work all the time, I strictly follow my hobbies, I am a social person: yes or
no |
1.4.
Analysis method
Based on the data
obtained as a result of the surveys, linear regression models were generated,
with the aim of finding the correlation between the frequency of home-based
non-work travels as an independent variable and the dependent variables that
were considered to be important according to the existing literature. The
modelling was continued by eliminating insignificant variables until a
satisfactory R² resulted. Three models associated with non-work travel
frequency was developed for individual areas. Each model was developed assuming
a confidence level equal to 95%.
2.1.
Descriptive statistics
In the linear regression model for non-commute travel generation model,
8 variables were used: 4 discrete and 4 continuous. These variables are
presented in Table 2.
Tab. 2
Description of variables
|
Variable |
Type |
Description |
|
Age |
continuous |
Person’s age |
|
FreqNonCommuteInDistrict |
continuous |
Frequency of non-commute travels
in district |
|
FreqNonCommuteOutside |
continuous |
Frequency of non-commute travels
in district |
|
NonCommuteTotal |
continuous |
Total number of non-commute trips |
|
DailyActivity |
dummy |
Daily activity: work or study (1),
no work or study (0) |
|
DistrictShoppingPlace |
dummy |
The most frequent place of
shopping: district (1), farther (0) |
|
AttractiveShops |
dummy |
Attractive shops In the
neighbourhood: present (1), not present (0) |
|
DomModeOutside |
dummy |
Dominant mode outside district:
car (1), non-car (0) |
Descriptive statistics for discrete variables used in the model is shown
in Tables 3 and 4, respectively. Other variables were not significant enough
for use in the model.
Tab. 3
Discrete variables used in the model
|
Variable |
n |
Range |
Minimum |
Maximum |
Mean |
Std. dev. |
Variance |
|
Age |
426 |
68 |
10 |
78 |
34.51 |
14.71 |
216.33 |
|
FreqNonCommuteInDistrict |
426 |
15 |
0 |
15 |
3.02 |
1.88 |
3.52 |
|
FreqNonCommuteOutside |
426 |
18 |
0 |
18 |
1.75 |
2.10 |
4.41 |
|
NonCommuteTotal |
426 |
26 |
0 |
26 |
3.41 |
3.37 |
11.36 |
Tab. 4
Continuous variables used in the model
|
Variable |
Option |
Overall Sample |
Kurdwanów |
Piasek Północ |
|||
|
Count |
Column N % |
Count |
Column N % |
Count |
Column N % |
||
|
DailyActivity |
work/study |
386 |
90.6% |
196 |
90.3% |
190 |
90.9% |
|
no work/study |
40 |
9.4% |
21 |
9.7% |
19 |
9.1% |
|
|
DistrictShoppingPlace |
district |
281 |
66.0% |
138 |
63.6% |
143 |
68.4% |
|
farther |
145 |
34.0% |
79 |
36.4% |
66 |
31.6% |
|
|
AttractiveShops |
yes |
293 |
68.8% |
149 |
68.7% |
144 |
68.9% |
|
no |
133 |
31.2% |
68 |
31.3% |
65 |
31.1% |
|
|
DomModeOutside |
car |
148 |
34.7% |
92 |
42.4% |
56 |
26.8% |
|
non-car |
278 |
65.3% |
125 |
57.6% |
153 |
73.2% |
|
2.2. Model fit
As shown in Table 5, for the overall sample, the strongest impact over
number of the non-commute travels has the number of non-commute travels outside
the district (FreqNonCommuteOutside), which is 0.650. It means that for
a one-point increase of non-commute travels outside the district is an increase
of 0.650 non-commute travels overall. Less significant variables are the
frequency of shopping in the district (FreqNonCommuteInDistrict), which
is 0.247, and Age, which is -0.200. For frequency of shopping in the district,
it is 0.247 change of dependent variable per one travel increase, and for Age,
it is -0.200 change of non-commute travels per one-year increase of age. The
rest of the independent variables are the least significant. These are daily activity
(DailyActivity), main district of shopping (DistrictShoppingPlace),
presence of attractive shops in the district (AttractiveShops) and dominant
mode outside the district (DomModeOutside).
Fig. 10. Continuous variables in relation to frequency of non-commute
travels and curves with the best R2
Fig. 11. Dummy variables in relation to frequency of non-commute travels
Tab. 5
Model parameters for the frequency of
non-commute travels in the overall sample
|
Variable |
Unstandardised
Coefficients |
Standardised Coefficients |
t |
P |
|
|
B |
Std. Error |
Beta |
|||
|
Intercept |
2.854 |
0.721 |
0.000 |
3.956 |
<0.001 |
|
Age |
-0.046 |
0.009 |
-0.200 |
-4.883 |
<0.001 |
|
DailyActivity |
-0.915 |
0.464 |
-0.079 |
-1.971 |
0.049 |
|
DistrictShoppingPlace |
-0.576 |
0.281 |
-0.081 |
-2.049 |
0.041 |
|
FreqNonCommuteInDistrict |
0.445 |
0.067 |
0.247 |
6.657 |
<0.001 |
|
AttractiveShops |
0.463 |
0.261 |
0.064 |
1.777 |
0.076 |
|
FreqNonCommuteOutside |
1.043 |
0.061 |
0.650 |
17.117 |
<0.001 |
|
DomModeOutside |
-0.390 |
0.255 |
-0.055 |
-1.528 |
0.127 |
Achieved model fit is shown in Table 6 - R2 is equal 0.496,
being decent according to linear regression analysis method, explaining 50% of
the variability of the response data around its mean.
Tab. 6
Model validation for overall sample
|
Measure |
Sum of Squares |
df |
F |
P |
|
Regression |
2395.6 |
7 |
58.78572968 |
<0.001 |
|
Residual |
2433.5 |
418 |
||
|
Total |
4829.1 |
425 |
||
|
Multiple R |
0.704 |
|||
|
R Square |
0.496 |
|||
|
Adjusted R Square |
0.488 |
|||
It is notable that the impact of independent variables in both districts
is different, as shown in Tables 7 and 8 for Kurdwanów and Piasek
Północ, respectively. While the frequency of non-commute travels
outside the district (FreqNonCommuteOutside) has a very strong impact in
the Kurdwanów sample (0.877), in the Piasek Północ sample,
it is less than a half of that (0.418). The other significant difference
between the two samples is for the frequency of non-commute travels in the
district (FreqNonCommuteInDistrict) – 0.094 for Kurdwanów
and 0.357 for Piasek Północ. In the case of dependent variable Age, there is compliance between two
districts, however, they differ in numbers – in Kurdwanów, the
impact of variable Age is higher than in Piasek Północ
(-0.213 and -0.140). Other
standardised coefficients of independent variables of both districts also
comply in sign but in some cases, the numbers are different. Independent
variable AttractiveShops does not have considerable impact in
Kurdwanów as it has in Piasek Północ (0.017 and 0.101) and
similarly for other independent variables. Results show how big the differences
are between the two districts. For Kurdwanów, there are different
variables affecting the dependent variable than in Piasek Północ.
Tab. 7
Model parameters for frequency of
non-commute travels in Kurdwanów sample
|
Value |
Kurdwanów |
||||
|
Unstandardised
Coefficients |
Standardised
Coefficients |
t |
P |
||
|
B |
Std. Error |
Beta |
|||
|
Intercept |
3.030 |
0.576 |
0.000 |
5.259 |
<0.001 |
|
Age |
-0.043 |
0.007 |
-0.213 |
-5.711 |
<0.001 |
|
DailyActivity |
-0.792 |
0.382 |
-0.077 |
-2.070 |
0.040 |
|
DistrictShoppingPlace |
-0.292 |
0.241 |
-0.046 |
-1.211 |
0.227 |
|
FreqNonCommuteInDistrict |
0.163 |
0.063 |
0.094 |
2.600 |
0.010 |
|
AttractiveShops |
0.109 |
0.226 |
0.017 |
0.482 |
0.630 |
|
FreqNonCommuteOutside |
1.051 |
0.045 |
0.877 |
23.390 |
<0.001 |
|
DomModeOutside |
-0.275 |
0.209 |
-0.045 |
-1.314 |
0.190 |
Tab. 8
Model parameters for frequency of
non-commute travels in Piasek Północ sample
|
Value |
Piasek
Północ |
||||
|
UnstandardisedCoefficients |
Standardised
Coefficients |
t |
P |
||
|
B |
Std. Error |
Beta |
|||
|
Intercept |
1.602 |
1.482 |
0.000 |
1.081 |
0.281 |
|
Age |
-0.036 |
0.020 |
-0.140 |
-1.818 |
0.070 |
|
DailyActivity |
-0.149 |
0.952 |
-0.012 |
-0.157 |
0.876 |
|
DistrictShoppingPlace |
-0.848 |
0.516 |
-0.107 |
-1.644 |
0.102 |
|
FreqNonCommuteInDistrict |
0.655 |
0.114 |
0.357 |
5.752 |
<0.001 |
|
AttractiveShops |
0.779 |
0.473 |
0.101 |
1.647 |
0.101 |
|
FreqNonCommuteOutside |
1.013 |
0.155 |
0.418 |
6.553 |
<0.001 |
|
DomModeOutside |
-0.253 |
0.502 |
-0.032 |
-0.504 |
0.615 |
For Kurdwanów sample, model fit is significantly better than for
Piasek Północ Sample, as shown in Tables 9 and 10. While 77% of
cases can be explained for Kurdwanów Sample, only 35% can be explained
for Piasek Północ Sample.
Tab. 9
Model fit for Kurdwanów sample
|
Measure |
Sum of Squares |
df |
F |
P |
|
Regression |
1533.5 |
7 |
97.964 |
<0.001 |
|
Residual |
467.4 |
209 |
||
|
Total |
2000.9 |
216 |
||
|
Multiple R |
0.875 |
|||
|
R Square |
0.766 |
|||
|
Adjusted R Square |
0.759 |
|||
Tab. 10
Model fit for Piasek Północ
sample
|
Measure |
Sum of Squares |
df |
F |
P |
|
Regression |
980.4 |
7 |
15.812 |
<0.001 |
|
Residual |
1789.2 |
202 |
||
|
Total |
2769.6 |
209 |
||
|
Multiple R |
0.595 |
|||
|
R Square |
0.354 |
|||
|
Adjusted R Square |
0.332 |
|||
3. DISCUSSION
The findings of this study provide some
basic ideas on how to manage non-commute travels within the Polish or
Central/Eastern European large cities. It is often intended to decrease the number of
commute trips, however, due to the psychological needs for mobility, this is
not the aim for non-commute trips. However, it is meant to decrease the levels of car dependency on these
trips. For that, it is necessary to have a clear understanding of the relations
between the frequency of non-commute travels with several perceived,
socio-demographic and built environment factors. These interrelations and
associations are hypothesised to be under the influence of the geographic and
cultural context. The context can have influences on mobility behaviours such
as the decision to go for shopping or entertainment in case there are limited
facilities for doing these activities in the vicinity of the living place. Such
a decision may or may not be a context-sensitive one. Nevertheless, very
limited studies have tested this hypothesis in the case of travel generation,
particularly non-commute trips.
There are examples that show the presence
of such cultural differences. For instance, age is not a significant descriptor of non-work trip
generation in Southern California [5] but it is in Cracow according to the findings of this study. In contrast, gender is a significant
descriptor in California but it is not in Cracow (it was eliminated from the
model because of its insignificance). Moreover, the presence of more retail in
the living area is marginally associated (in 10 per cent level) with less
non-commute trips in Southern California, while in Cracow, it is marginally
significant but the direction is opposite, in other words, more retail is
correlated with more non-commute trips. Such contextual differences in travel
behaviour are also observable between Cracow and Nigeria as a representative of
developing countries. In
a semi-urban industrial cluster of southwest Nigeria, a significant positive
correlation was found between monthly income and car ownership with a non-work
trip, while in Cracow, these variables were eliminated from the models because
of their insignificance.
These examples show how non-commute travel
behaviours are context-specific, but such comparisons are usually difficult to
conduct, because of the methodological inconsistency of non-work travel
investigations. However, the above two comparisons can slightly prove the
hypothesis of the existence of such cultural differences. However, more similar
studies are needed in order for it to be accepted or rejected.
The most influencing factor
determining the generation of non-commute travel in the two studied areas
(Piaski Północ and Kurdwanów) is the frequency of non-work
related activities (entertainment, shopping) within the analysed urban unit.
Social and cultural issues also affect the analysed model, however, to a lesser
extent. First of all, it concerns age; the older the respondents were, the less
non-commute travels they did. In the case of the Kurdwanów, the daily
activity of the respondents and the choice of the dominant mode of transport,
which they use to make purchases outside the area of residence, have a major
impact on the generation of non-work-related journeys. However, in the case of
the Piaski Północ estate, the frequency of shopping in the vicinity
of the place of residence and the availability. Attractive stores in the area
also played a large role. The presence of attractive service premises near the
place of residence for both analysed areas does not affect non-commute travel
significantly. However, from the point of view of spatial planning, this is one
of the most important determinants. This emphasises the role of urban and
spatial planning in providing attractiveness in urban form and local
facilities. This confirms the hypothesis that the attractiveness of spaces and
destinations can encourage people to change their mobility patterns and
behaviours.
Piaski Północ, due to its historical compact
urban layout, is difficult to modernise. However, some small free spaces can be
found in it to improve the attractiveness, especially combined with active
transportation routes and tracks. Quarters in the form of a frontage are a
spatial barrier that is difficult to circumvent. To respect its history and
character, it is worth using in this area instead of hard infrastructural
instruments – “soft” measures instruments. Above all, it is
worth focusing on better mobility management in this area, by creating good
conditions for travelling with pedestrian trips, public transport, bicycles, it
is also worth focusing on the promotion of sustainable transport. In the case
of bus transport, Piaski Północ has good access to public
transport, so improving the public transport service in the form of the launch
of a new bus or tram is unnecessary. It is worth focusing on cycling, which is
in poor condition in the estate. It may be valuable creating a one-way street
or removing parking spaces for a designated cycle route. Moreover, in the place
of the gaps between the side buildings, create a multi-storey car park, whose
façade will harmonise with the character of the area. As a result, there
will be more space for cyclists and pedestrians on the street, and the space
will be less chaotic. It is worth entering a cycling route between city bike
stations and Łobzowska Street. The introduction of attractive pedestrian
routes between public transport stops and large traffic generators is also
worthy of notice. Pedestrian access, varied with small architecture and
greenery in the form of rows of trees, shrubs and low noise level, increases
non-motorised trips. It is also advisable to pay attention to people with
reduced mobility - mothers with prams, people with disabilities, elderly people
or tourists with suitcases. The topography of the estate indicates that the
area is flat, so there is no need for any additional ramps, but it is necessary
to lower the sidewalks and ensure that the pavement surface is as good as
possible – without any curves or convexities.
The situation is different in the
second analysed area (Kurdwanów), where there are large differences in
altitude in the southern part. There are stairs, which are not enough that in
many cases are not adapted for people with limited mobility. In the older,
southern part, there is a lack of access for disabled people, and the sidewalks
are in a poor technical condition - with visible losses, bumps and
irregularities. The entire estate should be adapted to this group of people,
because many older people, families with children and prams or shoppers move
around the place. The space itself is well-designed, there is a park, alleys
designed only for walking and cycling, hiking trips take place among greenery
and the noise is low. Due to the occurrence of many crimes against the
pseudo-football background, the entire facility should be better lit, and
additional city monitoring system should be introduced at stops and access
points. In the case of bicycle traffic in the analysed area, there are no
higher-order roads than local and collective roads (except for roads that are
the boundaries of the housing estate), which is the reasoning cycling is
carried out on streets without designating additional bicycle lane. It would be
better to separate bike traffic from pedestrians and cars on the busiest
streets - such as Herberta, Stojałowskiego, Halszki or Witosa Street.
Public transport in the form of bus and tram transport is also in good
condition. It would be a good idea to introduce an accelerated route to the city
centre. Presently, from the “Os. Kurdwanów” stop (the
southern boundary of the estate) to the city centre is about 45 minutes, which
is twice as long as in the case of the tram suburb located in the north. It is
also worth introducing an accelerated bus line that would lead through the
interior of the estate. The road should have a meander-like character, that is,
it should take as many people as possible, it could be led through Bojki and
Wysłołuchów streets, which would make the middle of the estate
better communicated. In the case of spatial planning, there should be at the
bus stops, buildings with the greatest building intensity, so that the stops
will be able to handle the appropriate number of passengers. However, it should
be remembered that too high building intensity and too high building density
can reduce the quality of life of residents. It is also worth introducing a
greater functional diversity, which will increase the amount of pedestrian
travel over car journeys because the distance between the source and the
destination will be reduced.
In general, the feedback of this
study to spatial planning for the purpose of affecting non-work travels is to
provide more attractive local facilities such as shops and retail. According to
the findings of this paper, this will lay influence on the number of
non-commute trips of older people in the vicinity of their houses. Since these
travels are done in short distances, it is probable that they are
non-motorised. If so, spatial planning can have causal impacts on the sustainability
of urban mobility.
When considering the contribution to
knowledge, this study has identified the impact of various factors on the
commute and non-commute travel generation. A major limitation of this study is
the inability of the available data to capture dynamic changes. The
investigation is limited by self-reported travel behaviours. Furthermore,
employment status and job type are important contributors in determining
residential location, neighbourhood preference, and mode of travel to work, and
these were not examined in any detail in this study. Neighbourhoods were
defined based on administrative units. This synthetic use of aggregating
administrative spatial units into neighbourhoods may not reflect how
respondents define their neighbourhood. It could be more meaningful to try to
find ways to improve the match. In future works, it is recommendable to
generate more urban form variables to find more built environment-related
significant variables. This was not done at a satisfactory level, due to
scarcity of resources and time.
In Europe and around the world,
research is being carried out into travel for work, services and entertainment
with results that may be surprising. The above research was conducted in
Kurdwanów and Piaski Północ districts. People met were asked
about things related to travel so that they could create a more accurate travel
model. In this study, we focused on non-work travel; these places are where
people go on the same road and therefore, have no alternative. When travelling
to services or entertainment, people have a choice of where, which way and how
to go. This study reveals that age, daily activity, place of shopping,
frequency of shopping near homes, and frequency shopping activities outside in
farther places significantly correlates with the frequency of non-work trips in
Cracow. Moreover, the availability of attractive shops is marginally
significant in the overall model. However, the differences made for the two
districts of different urban forms, show that the decentralised district of
Kurdwanów, which has several large residential buildings marked as
socialist urban form, produces more outbound non-work trips to other districts,
which may be more or less connected with higher levels of car use. This means
the more compact and central district of this study generates low outbound but
more domestic non-commute trips. The findings of this study suggest the
provision of more attractive shops and retail for keeping non-work urban
travellers, especially older ones, within the vicinity of their living place.
Implementing urban and spatial planning measures are suggested by this paper to
strengthen the concept of short distances within the city.
References
1.
„1935 –
Cracow's latest plan”. Available at: https://dawnemapyCracowa.pl/map/1935-najnowszy-plan-Cracowa/#15/50.0634/19.9450/1935_Cracow-osm_podklad_czb.
2.
Bhat Chandra. 1997. ,,Work Travel Mode Choice and Number of Non-Work Commute Stops”.
Researcher work. University of Massachusetts at Amherst, Department of Civil
and Environmental Engineering.
3.
bip.Cracow. „Comprehensive Traffic Research in
2013”. Available at:
https://www.bip.Cracow.pl/?sub_dok_id=96964&vReg=1.
4.
bip.Cracow. „Cracow in numbers
2017”. Available at:
https://www.bip.Cracow.pl/zalaczniki/dokumenty/n/215089/karta.
5.
Boarnet Marlon, Sharon Sarmiento. 1998. “Can
Land-use Policy Really Affect Travel Behaviour? A Study of the Link between Non-work
Travel and Land-use Characteristics”. Urban
Studies 35(7). DOI:10.1080/0042098984538.
6.
Cervero Robert. 2003. ,,The built
environment and travel: Evidence from the United States”. European Journal of
Transport and Infrastructure Research 3(2): 119-137.
7.
Churchamn Arza, 1999. ,,Disentangling the Concept of
Density”. Journal of Planning Literature 13(4): 389-411 DOI:
10.1177/08854129922092478.
8.
„Comprehensive Traffic Research in
Wrocław and the surrounding area 2018”. Available
at: https://www.wroclaw.pl/srodowisko/wyniki-kompleksowego-badania-ruchu-we-wroclawiu-i-aglomeracji-2018.
9.
„Cracow enlargement in 1941”. Available at: https://niemieckiCracowblog.wordpress.com/2017/03/30/rozszerzenie-Cracowa-w-1941-roku/.
10. „Cracow in 1891”. Available at: https://dawnemapyCracowa.pl/map/1891-Cracow/#15/50.0592/19.9409/1891_Cracow-osm_podklad_czb.
11.
Dumba Smart. 2017.
“Informal public transport driver behaviour and regulatory policy
linkage: An expose”. Journal of
Transport and Supply Chain Management 11(a315): 1:16. ISSN: 2310-8789.
12. Handy
Susan, Marlon Boarnet, Reid Ewing, Richard Killingsworth. 2002. “How
the butli environment affects physical activity: Views from urban
planning”. American Journal of
Preventive Medicine 23(2): 64-73. DOI: 10.1016/S0749-3797(02)00475-0.
13. „How
Built Environment Affects Travel Behavior“. Available at: https://www.researchgate.net/publication/280719159_How_Built_Environment_Affects_Travel_Behavior_A_Comparative_Analysis_of_the_Connections_between_Land_Use_and_Vehicle_Miles_Traveled_in_US_Cities.
14.
Jacyna M. 1998. “Some
aspects of multicriteria evaluation of traffic flow distribution in a
multimodal transport corridor”. Archives
of Transport 10(1-2): 37-52.
15.
„Plan of Cracowa and the
surrounding area during the Four-Year Sejm”. Available at: https://dawnemapyCracowa.pl/map/1788-plan-miasta-Cracowa-i-okolic-w-dobie-sejmu-czteroletniego/#14/50.0682/19.9422/1788_Cracow-osm_podklad_czb.
16. „Plan of Cracow T. Żebrawskiego”. Available at:
https://dawnemapyCracowa.pl/map/1866-plan-Cracowa-t-zebrawskiego/#14/50.0587/19.9430/1866_Cracow-osm_podklad_czb.
17.
Rostafiński Józef. 1891. Guide to Cracow and surroundings. Cracow: University
Printing House.
18.
Schmidt Marie, Stefan Voss.
2017. „Advanced systems in public transport”. Public Transport 9(1-2) Special Issue: 3-6. ISSN: 1866-749X.
19.
Silver S.D. 2018. „Multivariate methodology for
discriminating market segments in urban commuting”. Public Transport 10(1): 63-89. ISSN: 1866-749X.
20. Szarata A. 2014.
„Comprehensive travel survey in Krakow – chosen results”. Logistyka 6: 13798-13805.
21. „The Warsaw
Traffic Study 2015 together with the development of the traffic model. Report
from stage III. Development of research results”. Available at:
http://transport.um.warszawa.pl/sites/default/files/WBR%202015.%20Etap%20III.%20Raport.%20Wersja%2006_2016.pdf.
22. „The Warsaw Traffic Study in 2015 along with the development of a
traffic model. Synthesis”. Available at: http://transport.um.warszawa.pl/sites/default/files/WBR%202015%20SYNTHESIS%20EN.pdf.
23.
Walters Jackie. 2014.
“Public transport policy implementation in South Africa: Quo
vadis?”. Journal of Transport and
Supply Chain Management 8(a134): 1:16. . ISSN: 2310-8789.
24. „Wroclaw Traffic Research 2010”. Available
at:
http://www.transportation.overview.pwr.edu.pl/UPLOAD/BAZA-ARTYKULOW/PL/2011/07/A_PL_11_07_02.pdf.
Received 18.10.2019; accepted in revised form 29.12.2019
![]()
Scientific
Journal of Silesian University of Technology. Series Transport is licensed
under a Creative Commons Attribution 4.0 International License