Article
citation information:
Mindur, L., Mindur, M. Technological advances
in the development of the US railways against the competitiveness of the
economy in the years 2000-2017. Scientific
Journal of Silesian University of Technology. Series Transport. 2019, 104, 119-135. ISSN: 0209-3324. DOI: https://doi.org/10.20858/sjsutst.2019.104.11.
Leszek MINDUR[1],
Maciej MINDUR[2]
TECHNOLOGICAL ADVANCES IN THE DEVELOPMENT OF THE
US RAILWAYS AGAINST THE COMPETITIVENESS OF THE ECONOMY IN THE YEARS 2000-2017
Summary. The overall
contribution of the railway sector in the American economy is substantial.
Since 2000, the volume of rail freight transport services in the United States
has remained on a balanced and invariably high level, even though the total
length of the railway network has declined. Over the recent years, owing to the
deployment of advanced software and state-of-the-art technologies, rail freight
transport has been performing more effectively than ever. This article
addresses a study of the rate of GDP changes compared with measures reflecting
the transport services performed in the years 1995-2015. This study comprised
the transport performance achieved by means of railways (in billion tkm)
against other transport sectors within 2000-2016 and addresses the volume of
freight transport services performed in the American transport network. The
authors discussed the mechanism functioning of rail freight transport, which is
becoming an increasingly attractive means of transport, with reference to the
intermodal freight transport, including the double-stack system. They have analysed the share of intermodal transport
in the structure of domestic and non-domestic freight transport services in
2017. Furthermore, the latest observed trends in the American railway network
in the sphere of the use and implementation of the state-of-the-art
technologies supporting railway traffic management was brought to light with
regard to the improvement of safety and assisting the relevant authorities.
Keywords: US economy, rail transport, technological
advancement, safety.
1. INTRODUCTION
The dynamic advancement of American rail transport is
determined by the continuous development of the economy. American railways
transport more than two billion tonnes of raw materials and finished products
annually using nearly 130,000 miles of railway lines that cut through 49
states. The increasing demand for the supply of goods to a wide range of
industries and consumers in the country, as well as to global markets, has
contributed to linking the internal market from the east to the west coast and
connecting it with the rest of the world.
The overall contribution of the railway sector in the
American economy is quite substantial, creating more than 1 million jobs,[3]
and increasing tax revenues and the gross
domestic product. Suppliers and service providers operating in the railway
directly employ more than 125,000 people in production, repair, maintenance and
leasing. Moreover, for every worker directly employed by the railway sector, further
4.2 jobs are supported by the business environment in its broad understanding,
which means that 650,000 jobs are linked with goods suppliers and railway
service providers, as well as their supply chains or the expenses of those whom
these companies employ[4].
American railways were originally established and still
currently operated on a nearly exclusive basis of private capital. Railway
entrepreneurs who own both the infrastructure and the rolling stock are
responsible for their maintenance, upgrading and repairs, while ensuring the
flow capacity of the routes they manage. In most lines, advanced technologies
are either already supported or presently being implemented, which has made it
possible to increase traffic safety over recent years as well as to partially
relieve roads of heavy vehicle traffic.
2. MAIN TRENDS IN THE DEVELOPMENT OF THE US
ECONOMY
The United States of America is the largest and most
important economy in the world. Its GDP value was USD 19.4 billion in 2017,
which accounted for over 18% of the world’s gross domestic product[5].
The United States has maintained its position of world economic leader for many
decades, leaving far behind both the dynamically developing China (with its
2017 GDP of USD 12.0 billion), Japan (USD 4.9 billion) and Germany (USD 3.7
billion). In terms of GDP per capita, the United States was ranked 8th
in 2017 (USD 59.9 thousand per capita), being second only to smaller countries
such as Luxembourg, Switzerland, Macao, Norway, Iceland, Ireland and Qatar.
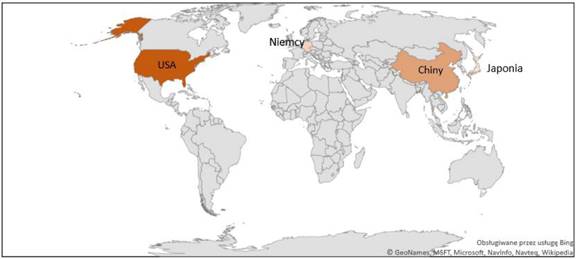
Fig. 1. Countries with the highest GDP worldwide
Source:
https://inzynieria.com/wpis-branzy/rankingi/10/52442,najwieksze-gospodarki-swiata-2018,pozycja-rankingu-4-niemcy-3-68-bln-usd
The USA is the largest (single country) free-market economy
in the world[6].
Compared to the economies of the European Union, it is characterised by
significantly higher liberalism, lower taxes and absence of extensive social
security schemes.
Fig. 2. Trends in the American GDP in the years 2000-2017
Source: https://tradingeconomics.com/united-states/gdp
The US economy is dominated by a highly developed and
technologically advanced service sector, which accounts for nearly 80% of the
GDP. Production is equally important, as it accounts for ca. 19% of the GDP[7].
The United States is the world’s second largest producer and leader
in the automotive, aviation and
aerospace, machine building, telecommunications and chemicals industries [8].
Following the global economic crisis of 2009, owing to the
massive government financial support, the US economy started recovering from
the recession. Its economic growth has also benefited from such activities as
research, implementation of innovation and capital investments. One cannot
disregard the fact that the US possesses and extracts vast natural resources
(including crude oil, natural gas and hard coal). December
2017 saw the implementation of a tax reform which, starting from 2018,
effectively reduced the tax rates binding for companies from 35 to 21%.
Individuals are also subject to lower taxes, and many other tax reliefs and
deductions were changed[9].
The reduced corporate tax rates have been introduced for good, while the
reliefs for individuals are expected to expire past 2025.
Despite the fact that the United States currently enjoys very
good economic conditions, the country still faces numerous significant
challenges. These include deteriorating infrastructure, stagnation in wages,
growing income inequalities and costs of universal health insurance coverage,
as well as a growing current account deficit and budget deficit[10].
Further potential threats include the
recent changes in the foreign trade policy, which have undoubtedly had an
impact on economic growth. The current state policy which entails imposing
duties on imported goods is intended to encourage US consumers to purchase
domestic products. Customs duties have been imposed on imports of certain goods
from China, Mexico, Canada and the European Union, and it should be noted that
all these countries have taken retaliatory action. In January 2017, the US
representation broke negotiations concerning the Transatlantic Trade and
Investment Partnership (TTIP) between the European Union and the United States.
Experts are not in a position to predict whether and when talks on the adoption
of this agreement will resume[11].
Faced with the current situation and the declining export volumes, US companies
are anxious about the growing political and regulatory risks, especially since
emerging markets are facing their own issues and the eurozone is experiencing
economic growth deceleration.
Such an economic situation affects the condition of
transport, as it is closely associated with other economic sectors. An increase
in production translates into an increase in demand for transport services, as
shown in Fig. 3. The 2018 share of transport and warehousing in the GDP was
nearing USD 546 million (2.8% of total GDP)[12].
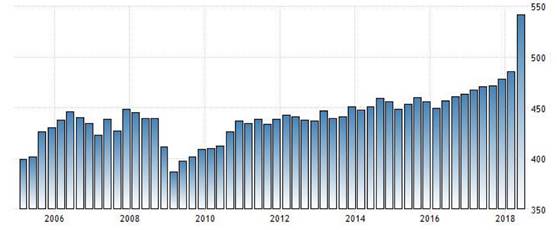
Fig. 3. Share of transport and warehousing in the US GDP in
the years 2006-2018
Source: https://tradingeconomics.com/united-states/gdp-from-transport
3. ECONOMIC GROWTH VS. FREIGHT AND PASSENGER TRANSPORT
SERVICES
The actual growth of the economy and transport services is
well described by the polynomial curves, and confirmed by the R2
coefficients. Figure 4 shows the growth of the US economy and transport
services in the years 1995-2015. The variables included in the figure have been
compiled with reference to real data based on the polynomial curve.
Macroeconomic variables and transport measures are
characterised by steady growth, and the highest growth is demonstrated by the
polynomial curve describing the GDP, the second highest being that of the
passenger transport curve, while the lowest level trend is one which describes
freight transport performance. The rate of changes in the GDP compared to the
measures reflecting transport services within the period subject to analysis,
has been steadily increasing (with the only abrupt decline observed in 2009),
which implies that the economy grew faster than the transport sector, and that
the share of transport services in the American GDP has been decreasing.
4. DEVELOPMENT OF THE US RAILWAYS
The US rail transport is
dominated by freight services, while passenger services, once a large and
important part of the domestic rail transport, now plays a limited role
compared to many other countries in the world.
Fig. 4. Macroeconomic indices
characterising the economy (GDP) and measures of transport services (tkm and
pkm) in the United States of America
Source: North American Transportation
Statistics Database 2007-2015, available at:
http://www.rita.dot.gov/bts/data_and_statistics
The history of the development of the US railways dates
back to the years 1762-1764, when the first railway line was built by British
military engineers in areas near the Niagara Falls in Lewiston, to be used by a
vehicle known as a mechanised tram[13].
In 1826, the 4.8 km long Granite Railway line was opened to transport stone
blocks from the local quarry to the port on the Neponset River near Boston. In
the construction of this line, 1,524 mm gauge wooden rails with iron overlay
were used. The first (unsuccessful) attempt to use the Stourbridge Lion steam
locomotive took place on the railway line from Carbondale to Honesdale,
Pennsylvania, in 1829. In 1830, a 21 km long B&O railway section connecting
Baltimore and Ellicott’s Mills was commissioned, featuring horse
traction. The same year saw the opening of the
Tuscumbia–Courtland–Decatur RR (Alabama) horse railway, established
to transport cotton, and it was the first railway west of the Appalachians,
later to become a part of the SOU network. Other important events included the
opening of a section of the first regular steam traction line in January 1831
(with the Best Friend of Charleston steam locomotive) near Charleston, operated
by the South Carolina Canal & RR Co., extended in 1833 to Hamburg, running
on a track of the 1,524 mm gauge. The railway was built at a great pace and
with great savings, using flat and wooden rails, and track substructure instead
of embankments. It was later gradually adapted to normal standards[14].
The first transcontinental line, 3,067 km in
length, was built in the 1860s, connecting the existing eastern railway network
in Omaha (Nebraska) with the Pacific coast in Oakland Long, San Francisco Bay[15].
This investment laid the foundation for the creation of a modern transport
system in the United States. Much of the original route is still used today.
The railway line construction investments of the second half of the 19th
century had the greatest impact on the American transport system of the time.
Following the standard historical interpretation, railway lines were crucial
for the development of the domestic market in the United States and served as a
model for the organisation, financing and management of a large corporation[16].
The contemporary US railway network is the longest in the
world (Fig. 2). In 2017, its total length came to 126,195 miles,[17]including
93,339 miles (data of 2016) of class I lines, with 21,358 miles managed by the
main rail passenger transport operator, Amtrak, with the US federal government
as the major shareholder.
American freight railways are divided into three classes
based on the distances they cover and the wages, and so there are seven large
class I railway lines, 21 regional class II lines, and 547 short class III
lines. Class I railways were operated using more than 26,000 locomotives. Ca.
1,500,000 freight cars are currently used in the United States, and they are
broken down according to technical specifications as follows:[18]:
-
open cars –
540,000 units
-
box cars –
360,000 units
-
tank cars –
255,000 units
-
platform cars –
210,000 units
-
refrigerator cars
– 135,000 units
The
main carriers operating class I lines are[19]:
-
Burlington Northern
and Santa Fe Railway (BNSF), established in 1996 by the merger of ATSF and BN,
currently one of the largest railway companies
-
CSX Transportation
(CSXT): established in 1987 by the merger of Chessie System (former C&O of
B&O) with Seaboard Air Line RR, Atlantic Coast Line RR, Louisville &
Nashville RR; presently, one of two railway systems functioning east of
Mississippi
-
Norfolk Southern
Combined Railroad Subsidiaries (NS): railway company established in 1990,
mainly on the basis of the SOU railway network, the first Norfolk Southern
Rly., Virginian Rly., Norfolk & Western RR, half of the Conrail network;
along with the CSXT railway, it services the east of the country
-
Union Pacific RR (UP)
-
Grand Trunk Corp
-
Soo Line Railroad
-
Kansas City Southern
Railway (KCS)
Fig. 5. Percentage share of cars in freight transport
services according to body types
Source: authors’ own study based on:
https://www.bts.gov/sites/bts.dot.gov/files/docs/browse-statistical-products-and-data/transportation-statistics-annual-reports/215041/tsar-2017-rev-2-5-18-full-layout.pdf
Next to the aforementioned major corporations, the US rail
freight market is also served by regional railway operators, local railways as
well as railway companies providing shunting and terminal services.
Since 2000, the volume of rail freight transport
services in the United States has remained on a balanced and high level, even
though the total range of the railway network has declined. Between 1990 and
2013, the length of class I railways decreased by almost 30%, and many sections
were transformed into short lines or simply abandoned,[20]however,
this reduction has not undermined the high growth rate of freight transport
(Fig. 6). The volume of railway transport performance has been compared with
other modes of transport in Table 1, while the cargo volume in tonnes
transported by rail between 2000 and 2016 is illustrated in Fig. 7.
Transport services in the United States are dominated by
road transport. Congested and frequently in poor condition (since a passenger
car is by far the most popular means of transport for Americans), road have not
been sufficiently subsidised for many years, and are becoming increasingly
dangerous. On average, 1/3 less transport is carried out by rail. The exception was 2014, when the rail and road transport
performance was at a similar level. The volume of transport services was
affected by the global economic crisis of 2009 and the economic slowdown of
2012 in the aftermath of the significant reduction in federal spending, mainly on
defence[21].
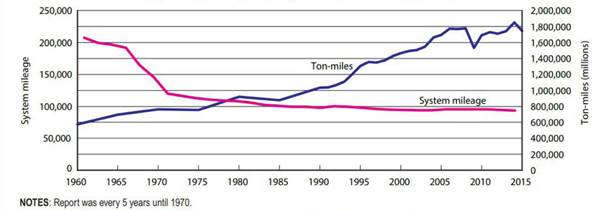
Fig. 6. Changes in the mileage of means of rail transport
and transport performance in the years 1960-2015 in tonne-miles
Source:
https://www.bts.gov/sites/bts.dot.gov/files/docs/browse-statistical-products-and-data/transportation-statistics-annual-reports/215041/tsar-2017-rev-2-5-18-full-layout.pdf
Tab. 1.
Transport performance by transport modes in the years
2000-2016, in millions of tonne-miles
|
Year |
Transport mode |
||||
|
Road |
Rail |
Pipeline |
Air |
Total |
|
|
2000 |
2,326,524 |
1,546,319 |
967,819 |
14,983 |
5,501,444 |
|
2001 |
2,362,063 |
1,599,332 |
924,162 |
13,069 |
5,520,312 |
|
2002 |
2,427,693 |
1,605,532 |
880,504 |
13,370 |
5,539,180 |
|
2003 |
2,478,740 |
1,603,564 |
875,570 |
15,231 |
5,579,251 |
|
2004 |
2,427,170 |
1,683,895 |
870,635 |
16,451 |
5,619,322 |
|
2005 |
2,453,347 |
1,696,425 |
865,700 |
15,002 |
5,621,751 |
|
2006 |
2,405,811 |
1,771,897 |
860,766 |
14,702 |
5,614,804 |
|
2007 |
2,495,786 |
1,770,545 |
855,831 |
14,612 |
5,689,924 |
|
2008 |
2,752,658 |
1,777,236 |
981,323 |
13,133 |
6,044,871 |
|
2009 |
2,449,509 |
1,532,214 |
947,252 |
11,503 |
5,417,599 |
|
2010 |
2,512,429 |
1,691,004 |
955,986 |
12,026 |
5,673,656 |
|
2011 |
2,643,567 |
1,729,256 |
1,018,082 |
11,590 |
5,902,243 |
|
2012 |
1,890,797 |
1,712,567 |
856,873 |
11,836 |
4,946,,830 |
|
2013 |
1,941,029 |
1,740,687 |
842,392 |
11,883 |
5,001,082 |
|
2014 |
1,993,456 |
1,851,229 |
867,379 |
12,273 |
5,228,831 |
|
2015 |
2,002,544 |
1,738,283 |
876,456 |
12,519 |
5,120,429 |
|
2016 |
2,022,879 |
1,585,440 |
896,320 |
13,157 |
4,995,657 |
Source:
https://www.bts.gov/sites/bts.dot.gov/files/docs/bts_program_resources.pdf
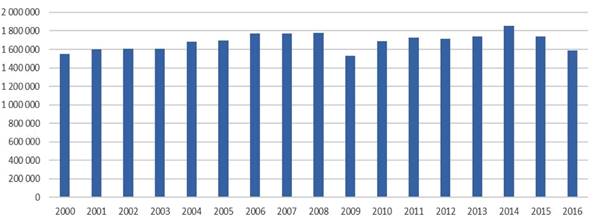
Fig. 7. Volume of cargo transported by rail in the years
2000-2016, in tonne-miles
Source: https://www.bts.gov/sites/bts.dot.gov/files/docs/bts_program_resources.pdf
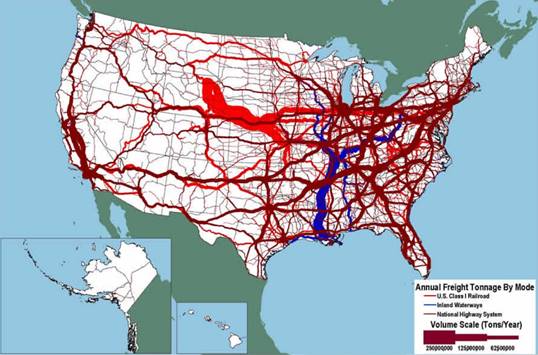
Fig. 8. Freight transport volumes in the US transport
network
Source: US Intermodal Network; available at:
http://www.worldshipping.org/industry-issues/transportation-infrastructure/u-s-intermodal-network
5. TECHNICAL PROGRESS OF THE US RAILWAYS
Intermodal transport is the most rapidly
growing segment of the rail market in the United States, as the volume of
intermodal transport services has tripled over the last 25 years[22]. In 2018, freight railways carried 14.5 million
intermodal units[23]. Intermodal transport services are perfect for
enabling cooperation between long-distance railways and door-to-door road
transport.
Intermodal transport plays a crucial role
in building significantly more efficient logistics by suppliers and sellers,
while its high efficiency translates into enormous competitive advantage of the
United States in the global economy. The US intermodal network forms a common
system of government agencies (owners of roads, bridges and ports) and private
companies (managing or operating other system components, including heavy
vehicles, trains, tracks and most port terminals).
The share of intermodal transport in the structure of
domestic and non-domestic freight transport services in 2017 was analysed in
Table 2.
Tab. 2.
Share of intermodal transport in the
structure of domestic and export freight transport services in 2017.
|
Cargo type |
Domestic |
Non-domestic |
||
|
QTY |
% |
QTY |
% |
|
|
Intermodal |
14,256,000 |
48.7% |
14,729,000 |
48.0% |
|
Coal |
4,738,000 |
16.2% |
4,623,000 |
15.1% |
|
Other goods not elsewhere classified |
2,352,000 |
8.0% |
2,933.000 |
9.6% |
|
Non-metallic minerals |
1,782,000 |
6.1% |
1,773,000 |
5.8% |
|
Chemicals |
1,725,000 |
5.9% |
1.920.000 |
6.3% |
|
Agricultural products |
1,283,000 |
4.4% |
1,305,000 |
4.3% |
|
Food products |
879,000 |
3.0% |
942,000 |
3.1% |
|
Metal ores |
719,000 |
2.5% |
699,000 |
2.3% |
|
Crude oil |
662,000 |
2.3% |
767,000 |
2.5% |
|
Basic metal products |
457,000 |
1.6% |
52.700 |
0.2% |
|
Glass and stone |
409,000 |
1.4% |
444,000 |
1.4% |
|
Total |
4,623,000 |
100% |
30,663,000 |
100% |
Source: https://www.aar.org/data-center/railroads-states/
The US intermodal transport system is predominantly based
on strategically located railway terminals (Fig. 9). In the recent years,
railways have invested billions of dollars to build and expand intermodal
terminals and furnish them with the state-of-the-art equipment and
instrumentation, including emission-free electric cranes with GPS units,
capable of moving intermodal containers between trains, heavy vehicles and
ships within minutes, while reducing pollution at the same time. Introducing
optical scanners and automated gantries enable cars to reach railway facilities
faster, thus reducing idle time and increasing safety. The network of
“smart routes” featuring detectors provides real-time feedback on
the condition of the railway infrastructure and equipment. The strategic
locations of these terminals (there are more than 180 intermodal facilities all
over the United States) have made railways highly competitive with regard to
domestic freight services. Intermodal transport currently accounts for ca. 23%
of railways’ total revenue[24].
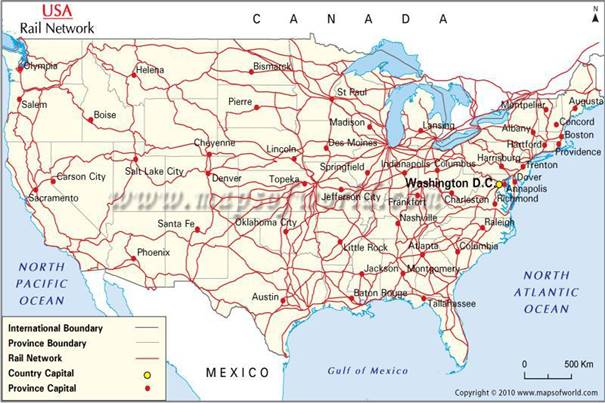
Fig. 9. Logistic and technical hubs in the US railway
network
Source: https://www.mapsofworld.com/usa/usa-rail-map.html
Since the 1980s, transport of containerised cargo
using the double-stack system has been growing in popularity. In its intermodal form, cargo containers are stacked
on a railway platform, one on top of the other in two layers (Fig. 10).
Using the double-stack solution translates into significantly improved
efficiency of a standard railway set, which is the reason it is used in most
North American railway lines. The requirement
for the deployment of this mode of railway traffic is the redevelopment of many
routes in major lines, including bridges and tunnels, in order to adapt them to
very high loads and dimensions. The double-stack transportation system
currently uses 20’, 40’, 48’ (14.63 m) and 53’ (16.15
m) long containers[25]. They are placed on
pocket-type railway platforms, which reduce vibrations while the train is
running, by their swinging motion, thus protecting the cargo against damage or
opening of the container door. Over the years, lighter and more durable
aluminium structures have been redesigned, including platforms used to
transport coal to power plants, and the traditional timber transport rolling
stock has been upgraded to facilitate loading and unloading.
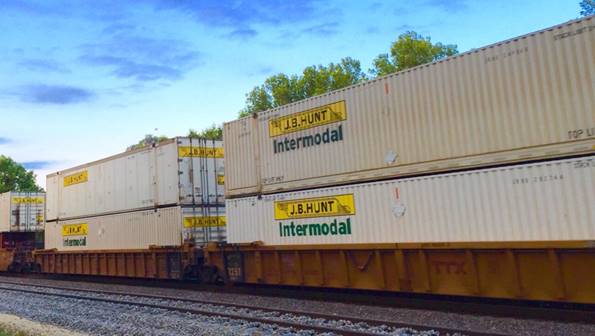
Fig. 10. Transport of containerised cargo using the
double-stack system
Source:
https://www.sdcexec.com/transportation/news/20986754/us-intermodal-rail-volume-on-recordsetting-track
Certain aspects of the transport of containerised
cargo in the double-stack system have been revolutionised by recent
communication technology. The railway company operating the Union Pacific line
has implemented a computer system enabling direct communication between the
crew and the marketing department, making it possible to report vehicles
approaching the unloading point or returning to the depot in real time. Such a
solution also translates into flexibility in sending service orders to a train
when en route. In Roanoke, Virginia, the huge Norfolk Southern cargo hub is
equipped with a technology enabling remote control of the trans-shipment
process. The computers set the brake lever and braking pressure, and control
the switches on board the vehicles in the sorting plants. The operators working
in a strategically positioned tower can change the frequency at which
locomotives are made ready by adjusting the rate of cars moving through the
service yard[26].
6. SAFETY AND COMPETITIVENESS GROWTH FACTORS
The current federal legislation on
rail transport is largely prescriptive and does not encourage railway
corporations to freely introduce technologies to improve safety and efficiency.
In order to increase railway safety, particularly in light of the growing
number of fatal accidents between 2002 and 2008, the US Congress adopted the
Rail Safety Improvement Act in 2008, introducing new regulations to control the
various spheres related to railway safety, such as hourly requirements towards
railway workers, interoperability of rail transport, track inspection
standards, locomotive certification system and level crossing safety. The very
same year saw the government obligating railway carriers to implement the PTC
(Positive Train Control) system, a modern technology supporting railway traffic
management while providing subsidies from the state budget at the same time (in
2017 only, USD 199 million was allocated for this purpose). The PTC system
enables automatic deceleration of trains or stopping them completely when
facing a high probability of derailment or collision. According to the
applicable laws passed by the Congress and the provisions of the arrangements
with the Association of American Railroads, PTC is currently being tested on 83.2%
of the target railway routes. The system is expected to be fully operational by
31 December 2020. By the end of December 2018, class I railway operators had
invested USD 10.5 billion in the expansion, installation and implementation of
PTC. All lines feature 100% of the necessary technical facilities (roadside
equipment, office facilities, locomotives) and have completed all the necessary
personnel training required by law[27].
According to data concerning railway safety,
between 2008 and 2017, the rate of accidents involving trains dropped by 40%.
These were the safest years in the history of the railway sector. This result
was undoubtedly influenced by the investments made by private operators over
the stated period in the deployment of advanced technologies on railway lines,
averaging more than USD 25 billion per annum[28].
Train accidents caused by the
technical condition of the rolling stock account for 14% of all accidents.
Their number has declined by 16% since 2008. Wagon upgrades, advanced equipment
control technology and company-wide asset management programmes have all
contributed to the improvement of safety, while the human-induced accident
rate, whose share in the total number of rail accidents is typically the
highest (38% in 2017), dropped by 20% since 2008. In order to curb such
incidents, employees are required to participate in mandatory rigorous training
and fatigue management programmes.
Rail freight carriers transport many hazardous
materials. In order to maintain the highest possible safety in transport,
carriers cooperate in this respect with forwarders of hazardous substances,
suppliers of railway lines and the government’s partners in preparing
highly specialised initiatives, regulations and standards. Combined with the
railway sector’s ongoing commitment to infrastructural investments,
technological innovation, rigorous employee training, self-imposed operational
practices and community safety efforts, all these initiatives have made freight
railway lines, the avant-garde of safety improvement endeavours undertaken in
the United States.
Highly specialised IT systems monitor the technical
condition of railway equipment in real time using smart sensors, advanced
analytics software and solutions for sharing data across the entire railway
sector. Detectors installed along railway tracks use a wide array of different
technologies, such as infrared and lasers, to assess the condition of bearings,
axles, wheels and springs as trains travel at speeds of up to 60 MPH.
Specialised software analyses images and warns the railway staff of anomalies
requiring further analysis.
Other technologies used on
the US railways to analyse the technical condition of the track superstructure
include ultrasounds and drones. Similarly, electromagnetic ground-penetrating
radars allow railway workers to detect any abnormalities, such as the presence
of water in the ballast, which may cause degradation of rails, particularly at
welds. Railway operators use these solutions to identify potential problems and
plan maintenance.
7. CONCLUSIONS
The development of the US railways over the recent decades
has been driven by a number of factors, which includes economic progress, the
diversity in the demand of individual regions extending over vast territories
for specific goods, and the dynamic international trade. The economic
attractiveness of railways rests upon the foundation of increasingly
competitive prices, not imposed by any monopolist.
Rail transport plays an important
role in the US economy, particularly in terms of the movement of imported and
exported containerised cargos alongside coal and crude oil supplies. The most
rapidly growing segment of the rail market has recently been the intermodal
transport sector, whose volume has tripled over the last 25 years. The efficiency
of intermodal transport provides the United States with an enormous competitive
advantage in the global economy context.
The progress observed in the rail transit of goods
results from the considerable capital expenditures for investments in and
operation of railway infrastructure and rolling stock. It involves upgrading of
traffic organisation, and application of strict rules concerning the operation
and maintenance of rolling stock and traffic control. Ensuring safe and
efficient operation enables railway operators to maintain their competitive
advantage. Thanks to the use of highly advanced software and state-of-the-art
technologies, rail freight transport has been performing more effectively than
ever.
Since 1980, the density of rail traffic has increased
by about 300% without substantial growth in the railway network size, while the
efficiency of locomotives has increased by 93% and the average cargo
transported per train, by 63%. The improvement in the operating efficiency of
railways is also a source of dividend for rail freight forwarders, and
consequently, helps it maintain prices on a low level. In fact, freight
forwarders can now move around twice as many goods for almost the same price as
in 1980.
Since 2006, the US Congress has
consistently implemented a research and development (R&D) programme by
allocating approximately USD 35 million annually[29]
in various research institutions, universities
and consulting companies, to be utilised for the purposes of research and
development efforts towards addressing current technological challenges tackled
by railways. The methodical approach to the financing activity over the recent
years has allowed the Federal Railroad Administration, the official party in
charge of spending the allocated funds, to build a strong scientific base, a
key important factor to the programme’s success. The stability of
the financing scheme increases the programme’s efficiency making it
possible to run multiannual projects, invest in test facilities and equipment,
such as those used in high-speed intercity passenger trains, in addition to
building and maintaining highly specialised expertise. Universities can develop
educational programmes to provide qualified personnel for the industry and
build partnership with industry stakeholders. However, most importantly, the
regular funding of the research and development activity constitutes a means of
direct support for the efforts aimed at continuous improvement of railway
safety.
References
1. Alfred D. Chandler Jr. 1977. The Visible Hand: The Managerial Revolution
in American Business. The Belknap Press of Harvard University Press
Cambridge, Massachusetts and London, England.
2. Association of American
Railroads. Available at: https://www.aar.org/article/preparing-future-intermodal-freight-rail/.
3. Association of American
Railroads. Available at: https://www.aar.org/data-center/railroads-states/.
4. Association of American
Railroads. Available at: https://www.aar.org/issue/freight-rail-intermodal/.
5. Association of American
Railroads. Available at: https://www.aar.org/railroad-101/.
6. Bureau of Transportation
Statistics. Available at: https://www.bts.gov/.
7. Bureau of Transportation
Statistics. Available at:
https://www.bts.gov/sites/bts.dot.gov/files/docs/browse-statistical-products-and-data/transportation-statistics-annual-reports/215041/tsar-2017-rev-2-5-18-full-layout.pdf.
8. Bureau of Transportation
Statistics. Available at:
https://www.bts.gov/sites/bts.dot.gov/files/docs/bts_program_resources.pdf.
9. CNN Business. Available at:
https://money.cnn.com/2013/01/30/news/economy/gdp-report/index.html.
10. CNN Business. Available at:
https://money.cnn.com/2018/07/25/news/economy/state-of-the-economy-gdp/index.html.
11. CSX Corporation. Available at:
https://www.csx.com.
12. Federal Railroad Administration.
Available at: https://www.fra.dot.gov/.
13. Federal Railroad Administration.
Available at: https://www.fra.dot.gov/Page/P0151.
14. First railway in America Built in
Lewiston. Spring 2010. Available at: http://historiclewiston.org/wp-content/uploads/2016/06//the_cradles_tramway_placemat.pdf.
15. Focus Economist. Available at:
https://www.focus-economics.com/countries/united-states.
16. Available at:
https://inzynieria.com/wpis-branzy/rankingi/10/52442,najwieksze-gospodarki-swiata-2018,pozycja-rankingu-4-niemcy-3-68-bln-usd.
17. Available at:
http://mikes.railhistory.railfan.net/r013.html.
18. European Commission. Available at:
https://ec.europa.eu/poland/events/170608_TTIP_pl.
19. Mindur M. (ed.). 2017. LOGISTYKA Nauka-Badania-Rozwój. [In
Polish: LOGISTICS
Science-Research-Development]. ITE-PIB. 633 p.
20. North American Transportation Statistics
Database 2007-2015. Available at:
http://www.rita.dot.gov/bts/data_and_statistics.
21. RailFreight.com. Available at:
https://www.railfreight.com/railfreight/2019/02/15/almost-all-railways-in-us-operate-positive-train-control/?gdpr=accept.
22. Railway Supple Institute. Available at:
https://www.rsiweb.org/-25sept18.
23. Statista. Available at:
https://www.statista.com/statistics/268173/countries-with-the-largest-gross-domestic-product-gdp/.
24. The World Factbook. Available at:
https://www.cia.gov/library/publications/the-world-factbook/geos/us.html.
25. Tradingeconomist. Available at:
https://tradingeconomics.com/united-states/gdp-from-transport.
26. Trains Magazine, Why no double stacks
outside of North America? Available at:
http://cs.trains.com/trn/f/111/p/204998/2244756.aspx.
27. U.S. Bureau of Economic Analysis.
Available at: https://www.bea.gov/news/glance.
28. US Intermodal Network. Available at:
http://www.worldshipping.org/industry-issues/transportation-infrastructure/u-s-intermodal-network.
29. Available at:
http://www.mapsofworld.com/usa/usa-rail-map.html.
30. Available at:
http://www.sdcexec.com/transportation/news/20986754/us-intermodal-rail-volume-on-recordsetting-track.
31. Vernon, Edward (ed.). Travelers’
Official Railway Guide of the United States and Canada, Philadelphia: The
National General Ticket Agents’ Association. June, 1870, Tables 215 and
216.
Received 03.06.2019; accepted in revised form 29.08.2019
![]()
Scientific
Journal of Silesian University of Technology. Series Transport is licensed
under a Creative Commons Attribution 4.0 International License