Article
citation information:
Krasuski, K., Kirschenstein, M. Designation of
meteorological parameters using GPS satellite technique in a flight experiment
at the Dęblin military aerodrome. Scientific
Journal of Silesian University of Technology. Series Transport. 2019, 103, 69-79. ISSN: 0209-3324. DOI: https://doi.org/10.20858/sjsutst.2019.103.6.
Kamil
KRASUSKI[1], Małgorzata KIRSCHENSTEIN[2]
DESIGNATION
OF METEOROLOGICAL PARAMETERS USING GPS SATELLITE TECHNIQUE IN A FLIGHT
EXPERIMENT AT THE DĘBLIN MILITARY AERODROME
Summary. This paper presents research results on the
determination of meteorological parameters utilising the GPS satellite
technique. The meteorological parameters were designated using Standard
Atmosphere (SA) and UNB3m empirical models. The research experiment was
realised during a flight test at the Dęblin military aerodrome. In the
flight test, the Cessna 172 plane was used. The values of meteorological
parameters (for example, temperature, pressure and relative humidity) from the
troposphere empirical models were presented and compared in the paper. In
addition, the values of the meteorological parameters were estimated at flight
attitude. The range of the flight attitude was between 150 and 700 m. The
precision position of the aircraft in vertical frame was determinated using the
RTK-OTF differential technique. The mean difference of temperature between the
SA and UNB3m models is equal to -5.7°C with the RMS bias approximately
0.2°C. The mean difference of pressure between the SA and UNB3m models
equals -1.0 hPa with the RMS bias of approximately 0.3 hPa. The mean difference
of relative humidity between the SA and UNB3m models equals 25.5%, with the RMS
bias approximately 0.6%. On paper, the values of meteorological data from the
SA and UNB3m models were compared with true results interpolated from SYNOP
message. In research, the three SYNOP stations, that is, Kozienice,
Deblin/Irena and Lublin Radawiec were used for interpolation of the real
meteorological data. The difference between empirical and interpolated
meteorological data were presented in this paper. The accuracy of the
designation of temperature is better in the SA model rather than the UNB3m
model. The accuracy of the designation of pressure was relatively low in both
models, SA and UNB3m. On the other hand, the accuracy of the designation of
relative humidity was better in the UNB3m model than the SA model.
Keywords: GPS, meteorological
parameters, SA model, UNB3m model, accuracy
1. INTRODUCTION
The meteorological
parameters are applied in the GPS satellite technique for a recovery of such
troposphere delay products as Zenith Wet Delay (ZWD) and Zenith Hydrostatic
Delay (ZHD). The three major meteorological parameters (that is, temperature,
pressure and relative humidity) are necessary for the determination of the
troposphere delay [2]. The meteorological parameters can be determined on the
basis of data from meteorological stations or equipment. If the measurement
data from the meteorological sensors are not available, then meteorological
parameters are estimated using empirical models of troposphere. The empirical
models include the average value and seasonal variation of meteorological
parameters from previous years [9]. The empirical models such as Standard
Atmosphere (SA), UNB3m, MOPS, GPT or GPT-2 are implemented in the GPS satellite
technique [4]. These empirical models are extremely important in the safety
aspect of air navigation. The meteorological parameters from the empirical
models can be updated if a GPS receiver is installed in the cockpit. Moreover,
the meteorological parameters are corrected based on the aircraft coordinates
from an onboard GPS receiver. The corrected meteorological parameters are
useful for pilots in order to assess changes in the atmosphere.
In this paper, the
meteorological parameters (that is, temperature, pressure and relative
humidity) are estimated using the SA and UNB3m empirical troposphere models.
The meteorological parameters are designated during the flight test of a Cessna
172 aircraft at Dęblin aerodrome. During the test, the aircraft position
was recovered based on GPS observations from a Topcon HiperPro receiver. In the
paper, the research results from the SA and UNB3m models were also compared
with a true value of the meteorological data of SYNOP data.
2. METHODOLOGY
The meteorological
parameters were developed using the SA and UNB3m empirical models. The
meteorological parameters in the SA model are expounded thus [2, 4]:
 (1)
(1)
where:
![]() - temperature at required height.
- temperature at required height.
![]() .
.
![]() - required height.
- required height.
![]() .
.
![]() - pressure at required height.
- pressure at required height.
![]() .
.
![]() - relative humidity at required height.
- relative humidity at required height.
![]() .
.
The
meteorological parameters in the UNB3m model are estimated using the
mathematical formulas as follows [5, 8]:
 (2)
(2)
where:
![]() - temperature, pressure and relative humidity at required
height.
- temperature, pressure and relative humidity at required
height.
![]() - required height.
- required height.
![]() - gas constant for dry air.
- gas constant for dry air.
![]() - standard acceleration of gravity.
- standard acceleration of gravity.
![]() - interpolated meteorological parameters.
- interpolated meteorological parameters.
![]() - interpolated temperature, the temperature
- interpolated temperature, the temperature ![]() is interpolated
based on day of year, receiver latitude, average and seasonal variation of
temperature from previous years.
is interpolated
based on day of year, receiver latitude, average and seasonal variation of
temperature from previous years.
![]() - interpolated pressure, the pressure
- interpolated pressure, the pressure ![]() is interpolated
based on day of year, receiver latitude, average and seasonal variation of
pressure from previous years.
is interpolated
based on day of year, receiver latitude, average and seasonal variation of
pressure from previous years.
![]() - interpolated relative humidity, the relative humidity
- interpolated relative humidity, the relative humidity ![]() is interpolated
based on day of year, receiver latitude, average and seasonal variation of
relative humidity from previous years.
is interpolated
based on day of year, receiver latitude, average and seasonal variation of
relative humidity from previous years.
![]() - interpolated temperature lapse rate, the temperature lapse
rate
- interpolated temperature lapse rate, the temperature lapse
rate ![]() is interpolated
based on day of year, receiver latitude, average and seasonal variation of
temperature lapse rate from previous years.
is interpolated
based on day of year, receiver latitude, average and seasonal variation of
temperature lapse rate from previous years.
![]() - interpolated water vapour lapse rate, the water vapour
lapse rate
- interpolated water vapour lapse rate, the water vapour
lapse rate ![]() is interpolated
based on day of year, receiver latitude, average and seasonal variation of
water vapour lapse rate from previous years.
is interpolated
based on day of year, receiver latitude, average and seasonal variation of
water vapour lapse rate from previous years.
3. RESEARCH EXPERIMENT AND RESULTS
In the research experiment, the meteorological
parameters (that is, temperature, pressure and relative humidity) were
estimated using the SA and UNB3m models. The meteorological parameters were
calculated based on the navigation coordinates of the Cessna 172 aircraft. The
aircraft position in the geodetic BLh frame (B- Latitude, L- Longitude and h-
ellipsoidal height) was recovered based on GPS observations from a Topcon
HiperPro receiver [3]. The aircraft coordinates were determined for the RTK-OTF
double differential positioning technique for code and phase measurements. The
solving of the aircraft position was conducted in the RTKLIB software in
RTKPOST library for “Moving Baseline” module [10]. The final
coordinates of the aircraft position in the geodetic frame (that is,
ETRF’89) are presented in Figure 1. The flight mission was realised
between 09:39:03 and 10:35:03 of the GPS time.
Figure
2 presents values of temperature based on the SA and UNB3m empirical models.
The average value of temperature reached 15.1°C in the SA model,
and 9.6°C in the UNB3m model, respectively. The minimum value of
temperature is close to 13.4°C in the SA model and 8.1°C
in the UNB3m model, whereas the ellipsoidal height of the aircraft reaches
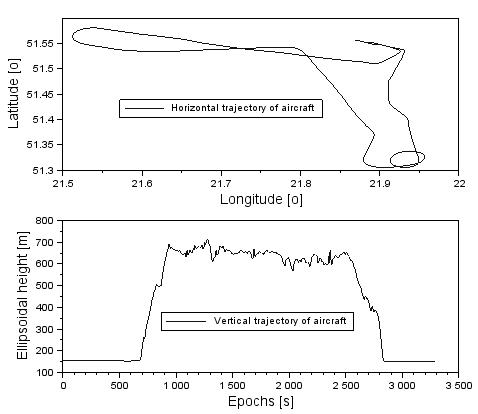
Fig. 1. The coordinates of the
aircraft in geodetic frame BLh
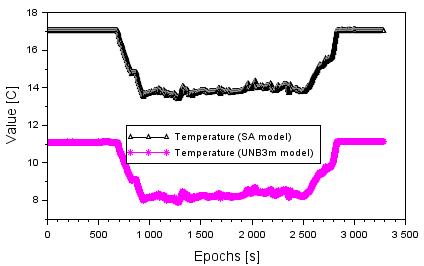
Fig. 2.
Values of temperature based on SA and UNB3m models
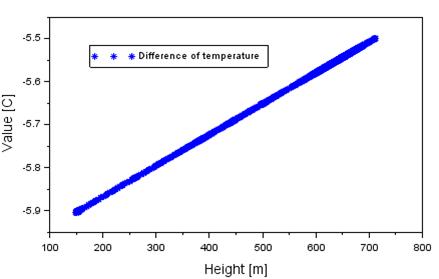
Fig. 3.
Difference of temperature between SA and UNB3m models
The
difference in temperature between the UNB3m and SA models is presented in
Figure 3. The mean difference of temperature equals -5.7°C
with the RMS bias of approximately 0.2°C. The range of the
temperature difference, based on the values from Figure 3, ranges between -5.9
and 5.5°C, respectively. The value of -5.9°C is
determined when the height of flight equals
Figure
4 presents the values of pressure based on the SA and UNB3m empirical models.
The average value of pressure equals 961.8 hPa in the SA model, and
960.9 hPa in the UNB3m model, respectively. The minimum value of pressure is
close to 940.0 hPa in the SA model and 929.5 hPa in the UNB3m model, whereas
the ellipsoidal height of aircraft grows up to
The
difference of pressure between the UNB3m and SA models is presented in Figure
5. The mean difference of pressure equals -1.0 hPa with the RMS bias of
approximately 0.3 hPa. The range difference is between -1.4 and -0.6 hPa,
respectively. The value of -0.6 hPa is determined when the height of flight
equals
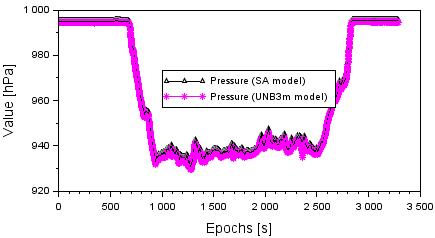
Fig. 4.
Values of pressure based on SA and UNB3m models
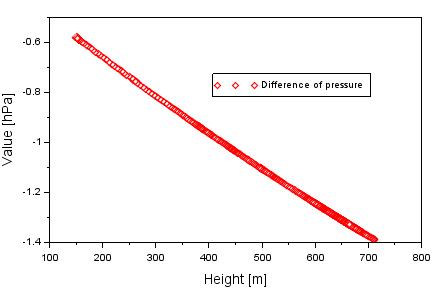
Fig. 5.
Difference of pressure between SA and UNB3m models
Figure 6 presents values
of relative humidity parameter based on the SA and UNB3m models. The average
value of relative humidity term from the SA model equals 38.1%, with a range
between 31.7 and 45.5%. The average value of the relative humidity term from
the UNB3m model equals 63.1%, with a range between 55.9 and 71.1%. The median
value of relative humidity parameter reaches 34.2% from the SA model and 58.5%
from the UNB3m model, respectively.
The
differences in relative humidity between the results from the SA and UNB3m
models are presented in Figure 7. The average value of difference of relative
humidity is approximately -25.5%, with magnitude order between -25.9 and
-24.9%, respectively. The RMS bias of difference of relative humidity term
equals 0.6%. In addition, the median value of difference of relative humidity
equals approximately -25.4%. The value of -25.9 hPa is determined when the
height of flight equals
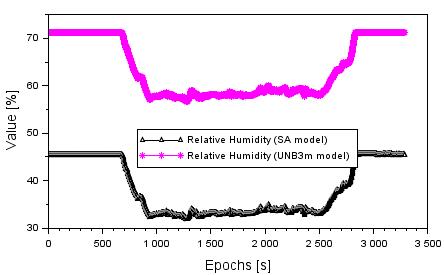
Fig. 6.
Values of relative humidity based on the SA and UNB3m models
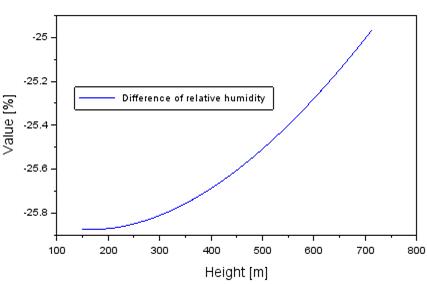
Fig.
7. Difference of relative humidity between the SA and UNB3m models
4. DISCUSSION
A comparative presentation of
the research results with model readings of meteorological parameters based on
data from the SYNOP message is given. In the research, the authors used the
actual measurement data of the SYNOP stations, belonging to the IMGW in Warsaw.
In particular, the authors used meteorological data from the following
stations:
*) SYNOPS from 12488, Kozienice (Poland) | 51-34N |
021-33E |
**) SYNOPS from 12490, Deblin / Irena
(Poland) | 51-33N | 021-51E |
***) SYNOPS from 12495, Lublin Radawiec
(Poland) | 51-13N | 022-24E |
The metrological data SYNOP for the station Kozienice,
Deblin/Irena and Lublin Radawiec were downloaded from the web service,
www.ogimet.com [11]. The meteorological stations Kozienice, Deblin/Irena and
Lublin Radawiec were the closest to the flight trajectory of the aircraft,
which resulted in their selection in the flight test. In the first order, the
distribution of meteorological parameters at the SYNOP stations was specified
for the interval of the observation time during the duration of the flight test.
Thus, it was possible to determine the values of the meteorological parameters
over the stations of Kozienice, Deblin/Irena and Lublin Radawiec, in accordance
with the data contained in the message SYNOP. Thereafter, an interpolation of
meteorological parameters was made from the level of reference elevation of
Kozienice, Deblin/Irena and Lublin Radawiec stations to the Cessna 172 flight
altitude. In the calculations, the authors used the interpolation of
meteorological data, in accordance with the mathematical formulas discussed in
this study [1].
Within the discussions, it was
possible to determine the accuracy of the exploited models, SA and UNB3m, in
the designation of metrological parameters. The accuracy of the models, SA and
UNB3m, was found in relation to the metrological parameters, determined by
means of the interpolation method based on the data from the message SYNOP. In
this way, the difference in metrological parameters was designated, as below:
 (3)
(3)
where:
![]() - temperature from the SA
and UNB3m model, based on equations (1) and (2).
- temperature from the SA
and UNB3m model, based on equations (1) and (2).
![]() - pressure from the SA and
UNB3m model, based on equations (1) and (2).
- pressure from the SA and
UNB3m model, based on equations (1) and (2).
![]() - relative humidity from the
SA and UNB3m models, based on equations (1) and (2).
- relative humidity from the
SA and UNB3m models, based on equations (1) and (2).
![]() - temperature interpolated
from SYNOP data.
- temperature interpolated
from SYNOP data.
![]() - pressure interpolated from
the SYNOP data.
- pressure interpolated from
the SYNOP data.
![]() - relative humidity
interpolated from the SYNOP data.
- relative humidity
interpolated from the SYNOP data.
Figure 8 shows the
accuracy of determining temperature based on the SA and UNB3m models in
relation to the interpolated readings from the SYNOP station. The temperature
accuracy from the UNB3m model ranges from18.6 to -4.1°C. In
addition, the average accuracy value of the temperature from the model UNB3m
equals -5.7°C, whereas the RMS error is equal to 1.1°C.
The temperature accuracy from the SA model ranged from -1.6 to +1.9°C.
In addition, the average accuracy value of the temperature of the SA model is
+0.1°C, whereas the RMS error is equal to 1.3°C.
Figure 9 shows the
accuracy of determining pressure from the SA and UNB3m models, in relation to
the interpolated readings from the SYNOP station. The accuracy of temperature
from the model UNB3m ranges from -61.3 to +4.3 hPa. In addition, the mean value
of the temperature accuracy from the UNB3m model equals -29.3 hPa, whereas the
RMS error is equal to 26.6 hPa. The accuracy of pressure from the SA model
ranges from -59.9 to +4.8 hPa. Moreover, the mean value of temperature accuracy
from the SA model equals -28.3 hPa, whereas the RMS error is equal to 25.9 hPa.
Figure 10 shows the
accuracy of determining relative humidity from the SA and UNB3m models, in
relation to the interpolated readings from the SYNOP station. The accuracy of
relative humidity of the UNB3m model is between -28.6 and -9.1%. In addition,
the mean value of the relative humidity value from the UNB3m equals -20.3%,
with the RMS error being equal to 8.1%. The accuracy of relative humidity of
the SA model is between -53.5 and -35.1%. Furthermore, the mean value of the
relative humidity value from the SA equals -45.9%, whereas the RMS error is
equal to 7.8%.
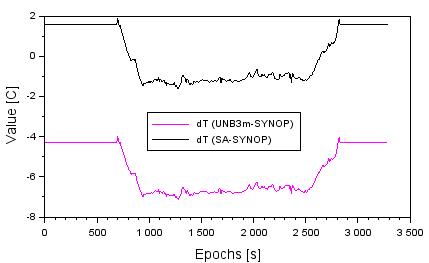
Fig. 8. The accuracy of
temperature from SA and UNB3m models
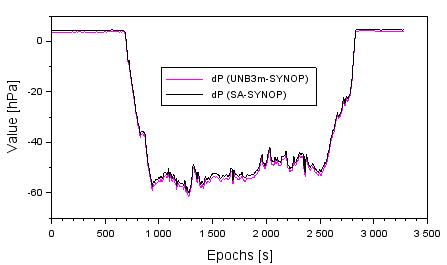
Fig. 9.
The accuracy of pressure from SA and UNB3m models
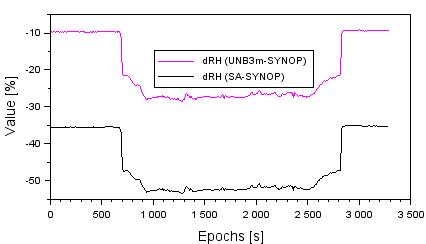
Fig. 10.
The accuracy of relative humidity from SA and UNB3m models
5. CONCLUSIONS
The article presents
practical applications of the empirical troposphere models in order to determine
the meteorological parameters, that is, temperature, pressure and relative
humidity. The article uses two troposphere models: the SA model and the UNB3m
model. The article presents two algorithms of meteorological parameters, in the
SA and UNB3m models. Investigations were conducted within the test flight
performed by the aircraft Cessna 172 for the military aerodrome EPDE in
Dęblin. The designated meteorological parameters for the SA and UNB3m
models were determined for the Cessna 172 flight trajectory. In addition, this
paper determines the accuracy of determined meteorological parameters in
relation to the actual readings from the SYNOP message. The actual values of
the meteorological parameters were designated by means of interpolation, on the
basis of data from the SYNOP stations of Kozienice, Deblin/Irena and Lublin
Radawiec. The accuracy of the designation of temperature is better in the SA
model than the UNB3m model. The accuracy of the designation of pressure is
relatively low in both the SA and UNB3m models. On the other hand, the accuracy
of the designation of relative humidity is better in the UNB3m model than the
SA model. It is worth adding that the models of the meteorological parameters
from the SA and UNB3m models are used in GPS satellite measurements and
exploited in aviation.
Acknowledgement
The authors would like to thank the
OGIMET service for making its meteorological data available.
References
1.
Bosy
J., A. Borkowski. 2005. Troposphere
modeling in local GP network. Paper presented at: EUREF Symposium 2005
Vienna, length of paper: 11.
2.
Bosy J. 2005. Precise processing of satellite GPS
observations in local networks located in mountain areas. Publisher of the
Agricultural University in Wroclaw. No 522. ISSN 0867–7964.
3.
Ciećko A., G. Grunwald, R. Kaźmierczak, M.
Grzegorzewski, J. Ćwiklak, S. Oszczak, M. Bakuła. 2014. „Analysis of the accuracy and availability of ASG-EUPOS
services in air navigation and transport”. Logistyka 3: 1091-1100.
4.
Dach
R., U. Hugentobler, P. Fridez, M. Meindl. 2007. Bernese GPS software version 5.0. Astronomical Institute,
University of Bern.
5.
Isioye
O.A., L. Combrinck, J. Botai. 2015. “Performance evaluation of Blind
Tropospheric delay correction models over Africa”. South African Journal of Geomatics 4(4): 502-525.
6.
Kowalski
M. 2012. “Phase mapping in the diagnosing of a turbojet engine”. Journal of theoretical and applied mechanics
50(4): 913-921.
7.
Kozakiewicz
A., M. Kowalski. 2013. “Unstable operation of the turbine aircraft
engine”. Journal of theoretical and
applied mechanics 51(3): 719-727.
8.
Leandro
R.F., R.B. Langley, M.C. Santos. 2008. “UNB3m_pack: a neutral atmosphere
delay package for radiometric space techniques”. GPS Solutions 12: 65-70. DOI: 10.1007/s10291-007-0077-5.
9.
Sanz
Subirana J., Juan Zornoza J.M., Hernández-Pajares M. 2013. GNSS
Data Processing, Volume I: Fundamentals and Algorithms. Publisher: ESA Communications. ESTEC,
Noordwijk, Netherlands. ISBN 978-92-9221-886-7, 2013.
10.
Takasu
T. 2013. RTKLIB ver. 2.4.2 Manual, RTKLIB:
An Open Source Program Package for GNSS Positioning. Available at:
http://www.rtklib.com/prog/manual_2.4.2.pdf.
11.
OGIMET.
Available at: http://www.ogimet.com.
12.
Zieja
Mariusz, Paweł Gołda, Mariusz Żokowski, Paweł Majewski.
2017. „Vibroacoustic technique for the fault diagnosis in a gear
transmission of a military helicopter”. Journal of Vibroengineering 19(2): 1039-1049.
Received 13.01.2019; accepted in revised form 02.05.2019
![]()
Scientific
Journal of Silesian University of Technology. Series Transport is licensed
under a Creative Commons Attribution 4.0 International License