Article
citation information:
Puškár, M., Kopas, M.,
Puškár, D. Influence analysis of detonations
related to output characteristics and to damage level of engine parts in order
to eliminate potential risks and ensure reliability of the HCCI technology. Scientific Journal of Silesian University of Technology. Series
Transport. 2019, 102, 151-163.
ISSN: 0209-3324. DOI: https://doi.org/10.20858/sjsutst.2019.102.13.
Michal PUŠKÁR[1],
Melichar KOPAS[2], Dušan
PUŠKÁR[3]
INFLUENCE ANALYSIS OF DETONATIONS RELATED TO OUTPUT CHARACTERISTICS AND TO DAMAGE LEVEL OF ENGINE PARTS IN ORDER TO ELIMINATE POTENTIAL RISKS AND ENSURE RELIABILITY OF THE HCCI TECHNOLOGY
Summary. The engine output characteristic
offers very important information during the real application of the HCCI
technology. This kind of combustion process significantly influences the
wearing degree of the main engine components or even the engine damage. The
principle of the HCCI combustion is basically beneficial, however, it can also
be destructive. Described in this article are measurements of the engine output
characteristics in the case of an experimental piston combustion engine. These
measurements were performed by means of a data recording system, whereby the
detonation combustion was evaluated using a quantitative method. The real
values of atmospheric conditions and fuel mixture composition were added to the
measured values. The resulting values were visually compared with a degree of
the engine piston damage caused by the detonations. The final result is a limit
value, which represents a maximal number of the detonation units that are
permissible in order to ensure reliable operation of the HCCI engine.
Keywords: analysis, detonation,
reliability, HCCI technology
1.
INTRODUCTION
A normal
combustion is a regulated one of a mixture of fuel and air in a combustion
chamber. It is stable combustion, which develops at a spark plug and continues
in a combustion chamber in a three-dimensional way.
A detonation is
a phenomenon, which is classified as an abnormal combustion. It is an
auto-ignition of a residual mixture of fuel and air in a combustion chamber. It
occurs after a normal combustion. At an initial phase, there is normal mixture
combustion, then under the influence of high pressure and heat, there are the
spontaneous ignitions, hence, detonation combustion [1].
Detonations
induce high pressure in a combustion chamber. This pressure is very short time.
In a combustion chamber, the pressure behaviour seems to be normal with
increasing development and then the pressure increases evidently. The rapid
increase of pressure is indicated as the excesses in comparison with a normal
one. These excesses intensify the pressure which causes detonation combustion.
Also, the rapid increase of pressure amplifies the forces in a combustion
chamber which induces the resonances in the engine design. These resonances are
characterised for detonation combustion. The noise or vibrations present the
phenomenon, which is recorded with a detonation counter [2-10].
It is important
to know that detonation need not be necessarily destructive. Many engines work
with a certain number of detonations. Some engines can stand strong detonations
for a very long time without destruction. The control detonation combustion is
useful because it increases engine output performance. The aim of this
contribution is the measurement of output characteristics of a high-speed
racing engine, which was performed by means of a data-recording system and the
detonation combustion was evaluated using a quantitative method. Next aim was
to find a limit where an examined engine produces the highest performance but
which the detonation combustion does not damage its design components.
Furthermore, there is the consideration of the influence of detonation combustion
on maximum values of an output performance and torque as well as their
behaviours depending on the engine speed.
2. EXPERIMENTAL MODEL
AND MEASURING DEVICES
The detonations
are influenced by the design of the combustion chamber (a shape, a size,
geometry, a replacement of spark plug), compression ratio, proportion of air
and fuel in a combustion mixture, shape of the ignition curve, atmospheric
conditions and the octane number of the fuel [11]. If the surface of a piston
or the combustion space is damaged or destroyed, detonation combustion may
start also in such conditions, which are not critical, but this damage effects
directly as an initiator of detonation combustion. The engines, which are
exposed over time to detonation combustion, tend to overheat themselves which
initiates an avalanche effect. The higher the temperature, the faster the
detonation combustion and consequently, the faster the destruction. The piston
absorbs a great deal of heat, on four sides causing dilatation which can induce
destruction [12]. The combustion temperatures are very high in the moment of
detonation ignition which causes the melting down of the piston and combustion
space materials [13,14].
For this reason,
it is difficult to determine theoretically the limit for detonation combustion
and then prove its authenticity for a petrol engine. Although there is a
software for modelling of the processes operating inside a cylinder and an
exhaust system during combustion, the real results are seriously performed [15,16].
This is the reason the experiment was
used to achieve the main aim. It is necessary to choose the experimental model
for experimental measurements. The development was realised with this
experimental model. Furthermore, there is the need to choose the measurement
devices (to provide feedback; to give information about a real output
proposition for a concrete change in detonation combustion).
The petrol
combustion engine with capacity 125 cm3 was used as the experimental
model. Two testing and measuring devices were
developed for the need of the experimental measurements.
2.1. Engine Watch and Control
System (EW&C)
This is a data-recording system, that is, a device which scans and
stores information during a motorcycle ride (in real conditions, in real loading).
This device makes it possible to diagnose the parameters of a combustion
engine: an output performance, a torque and their behaviours, the temperature
of the exhaust system and its behaviour and other characteristics.
A number and a kind of scanned parameters are related to the types and
the number of sensors, which are installed on the combustion engine.
In Figure 1 there is the block diagram for data measurement, operating
and evaluation. The engine activity record is dependent on time as a result of
this system. The principle of the EW&C system consists of the measurement
of instantaneous engine revolutions; an instantaneous temperature of the
exhaust system and a reading of an active speed gear or throttle position in
the carburettor.
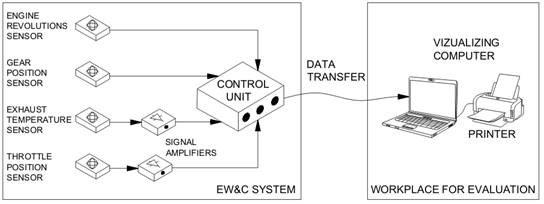
Fig. 1. Block diagram of
the EW&C system
The system does a functional record of the engine activity on the basis
of scanned and entered data (a wheel circumference, gear ratios of individual
speed gears, a curve of air resistance and a motorcycle weight). This record is
stored in the memory of the EW&C system. After concluding the measurement,
it is possible to copy the record into a PC.
2.2. Detonation Counter
For the measurement of detonations, the detonation
counter was used. The detonation counter sensor picks up irregular
combustion, therefore, the detonation of the engine and provides a number of
detonation units. In Figure 2, there is the block
diagram for detonation measurement, operating and evaluation. As
shown in Figure 2, in Range A, detonation occurs at a high load (throttle
opening 50% to 100%), and in Range B, detonation occurs at a light load
(throttle opening close to 50%).
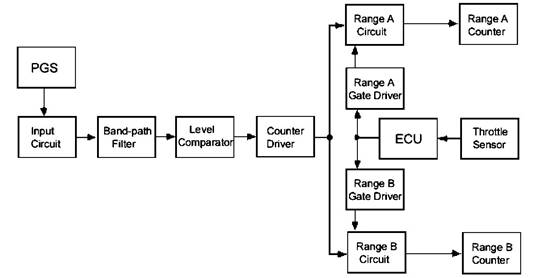
Fig. 2. Block diagram of
detonation counter
The PGS (plug gasket
sensor) is a pressure sensor which is made from a piezoelectric element and
outputs an electric charge according to pressure.
3. RESULTS AND DISCUSSION
The performed
measurements are intent on the analysis of the detonation combustion influence
with an output characteristic in consideration of the defined aim.
The aim of the
consecutive measurements was determined by the limit, expressed in a number of
detonation units per an overridden kilometre, where the combustion is
beneficial and helps to increase the output performance and does not cause
destruction in the design components of the engine.
In the experimental
model, these were applied the diagnostic devices, described in the
above-mentioned paragraph. The measurements were performed for a racing
circuit. The obtained results, which are presented in this paragraph, were
verified with multiple consecutive measurements to prevent any potential random
error.
In the introduction of
the previous paragraph which described the factors which influence detonation
combustion. These factors are the design of a combustion chamber (a shape, a
size, geometry, a replacement of spark plug), compression ratio, the proportion
of air and fuel in a combustion mixture, shape of the ignition curve, the
atmospheric conditions and the octane number of the fuel.
Paragraph 2 describes in
detail the used shape of an ignition curve and the design shape of a combustion
space. These shapes are equal for all measurements. Unleaded petrol with the
octane number 100 was applied as the fuel. In Table 1 are the scheduled
atmospheric conditions for each of the four measurements and as well as the
used compression ratios. In Table 2, there are recorded numerical presentations
of the fuel maps.
Tab. 1
Input Conditions
|
No. |
Atmospheric Conditions |
Compression Ratio |
||
|
Temperature [°C] |
Pressure [Pa] |
Humidity [%] |
||
|
1 |
27 |
97,3·103 |
37 |
14.46 |
|
2 |
21.2 |
98,2·103 |
36 |
14.43 |
|
3 |
17 |
97,5·103 |
65 |
14.67 |
|
4 |
18.8 |
97,2·103 |
44 |
14.71 |
Tab. 2
Fuel Maps
|
No. |
Throttle
Position [%] |
||||||||
|
0÷20 |
30 |
40 |
50 |
60 |
70 |
80 |
90 |
100 |
|
|
1 |
106 |
106 |
132 |
160 |
188 |
215 |
240 |
265 |
289 |
|
2 |
106 |
106 |
132 |
160 |
188 |
215 |
240 |
265 |
289 |
|
3 |
98 |
92 |
130 |
160 |
188 |
215 |
242 |
267 |
292 |
|
4 |
106 |
109 |
137 |
165 |
193 |
219 |
244 |
269 |
293 |
Table 2
contains four fuel maps. In the upper row are the given percentage positions of
the throttle. In the left column there is the consecutive number of measurement,
so every row represents one map. The numerical value, given for the concrete
position of the throttle, represents a flow space. Through this flow space, the
fuel flows into the diffusor of the carburettor. Subsequently, in the diffuser,
there is an in-flow of fuel mixed with air. These values help in the comparison
of various alternatives for fuel maps. If a value is higher then it represents
a more overrich alternative for the concrete injection setup and on the other
hand, if a value is lower then the mixture is weakened. The fuel maps for the measurements No.1 and No.2
are equal. In the case of the map No.3, it is the mixture weaker at the
throttle position up to 40%. At the throttle position over 80%, it is the
mixture more overrich than for the maps No.1 and No.2. The map No.4 is fuel
overrich in the whole range of the opening with the throttle position from 30%.
The fuel volume at the complete opening of throttle position is regulated by
means of the main jet, which was 3% smaller at the measurements No.3 and No.4
than it was at the first two.
The
measurement No.1 was done during the first testing day in the racing circuit.
In Table 1, there are scheduled the input conditions of the measurement and the
fuel maps is given in Table 2. In Figure 3, it is illustrated in the record of
the EW&C system.
In Figure 3, it is shown
in the record of engine activity and the behaviour of engine performance is
dependent on the time axis. The time axis is represented in the bottom part of
the figure. The engine activity record is represented with an upper curve
(saw-tooth type).
On the left axis is the
engine speed (revolutions), which makes it easy to define the range of
operating speed which the engine operates in. The axis of temperature in the
exhaust system is on the right side. The temperature behaviour is represented
in the curve given in the lower section of the figure. In this case, the
illustrated curve is almost a line because the relevant sensor was inactive.
Fig. 3. Activity Record and
Output Behaviour of Engine at Measurement No.1
The concrete extent of
activity engine record was selected. This extent was terminated on both sides
(with dash vertical lines) and then analysed with regards to the output
performance. This analysis is illustrated by the graph on top of this figure.
The horizontal axis belongs to the engine speed (revolutions) and the vertical
axis is for the output performance.
The output
performance analysis was done for all measurements at the fourth speed gear.
From experience, it is this speed gear that has the highest output performance.
In the display of
the detonation counter, it is shown the number of detonation units after the
measurement number 1. The number 1545 indicates a total number of detonation
units during the whole ride. It is necessary to calculate the total number per
one overridden kilometre. In Table 3, there is a re-calculated number of
detonation units per an overridden kilometre for all four measurements.
Analysis of the output data from the EW&C system and the detonation counter
depicted in Table 3 was built up, where the input of the stated number of
detonation units per overridden kilometre as well as all the measured output
values therein. For the measurement, No.1 maximum output performance was 27 kW
and maximum torque 23 N·m.
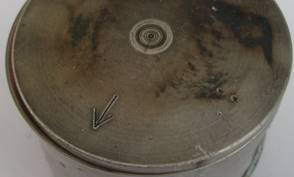
Fig. 4. Undamaged Piston
The number of detonation
units is 8 per one overridden kilometre. After the complete analysis, it is
evident that the detonation combustion is out of the limit at this measurement.
This fact is also obvious in Figure 4 in which a piston is displayed. This
piston has not got any mark of damage or any black deposition. The output
characteristics were stable.
On the next testing day
which was done on measurement No.2 in the same racing circuit. The conditions
for the measurement No.2 are referred in Table 1 and Table 2. In Figure 5 was
the engine activity record. Maximum output performance was 29.5 kW and maximum
torque 27 N·m. The number of detonation units is 30 per one overridden
kilometre. Other measured data are in Table 3. The output parameters were
stable which means that they did not decrease during the testing ride.
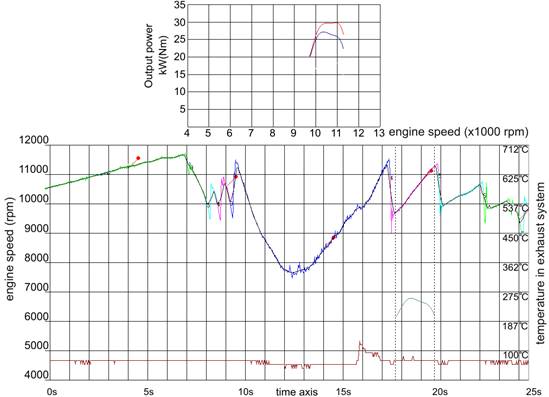
Fig. 5. Activity Record and
Output Behaviour of Engine at Measurement No.2
This setup was
characterised by the large range of exploitable speed. The engine was set much
better than No.1, which is documented with higher maximum output performance
and torque and their ranges as well. After disassembling there was evidently no
significant damage of the piston, Figure 6.

Fig. 6.
Piston with Black Deposition
The
following measurement No.3 was performed with an effort to determine whether it
is possible to load the engine with an even greater rate of detonation
combustion and the extent of influence on the engine output parameters as well
as potential damage.
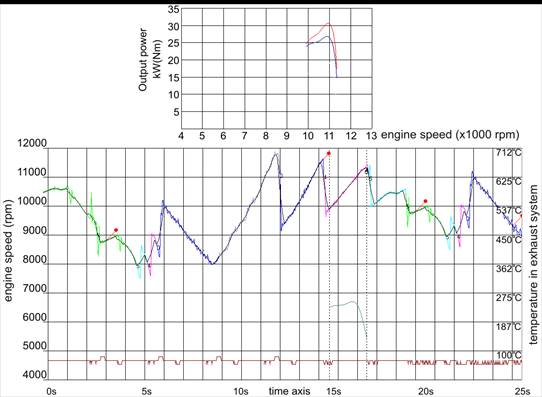
Fig. 7. Activity Record
and Output Behaviour of Engine at Measurement No.3
Likewise,
the testing circuit was the same and the input conditions, as well as the shape
of the fuel map, are stated in Table 1 and Table 2.
In
Figure 7 is the engine activity record. Maximum output performance was 32 kW
and maximum torque 27 N·m. The number of detonation units is 44 per one
overridden kilometre. Other measured data are in Table 3. Maximum output
performance increased in comparison with the previous measurement which was
caused by abnormal detonation combustion. It is important to know that this
performance is transient and the engine reached it only at the beginning of the
measurement. During the next kilometres, there were engine overheating with
small damage of the piston (Figure 8) and the loss of output performance.
Moreover, the range of exploitable speed decreased significantly.
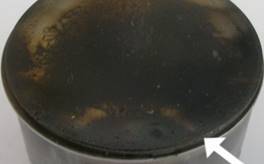
Fig. 8. Piston with
Moderate Damage
In Figure 8 there is the black deposition
of the piston similar to one shown in Figure 6. But the moderate abrasive wear
is evident at the edge of the piston, where a pointer shows. This wear
indicates that the detonation combustion has definitely assumed a destructive
character.
During the measurement No.4, the engine
was exposed to extreme detonation combustion. This measurement was performed in
the same racing circuit. In Table 1 are the conditions for performance of the
measurement No.4, while in Table 2 is the fuel map. In Figure 9 there is the
record from the EW&C system.
Maximum output
performance was 29.5 kW and maximum torque 26 N·m. The number of
detonation units is 56 per one overridden kilometre. Other measured data are in
Table 3. The range of exploitable speed was very short. The engine reached
these values only at the initial phases of the testing ride before significant
overheating and expressive destruction occurred. The output performance was
transient in maximum extent.
Tab. 3.
Measurement results.
|
No. |
Number of
Detonation Units (NDU) [NDU/km] |
Maximum
Output /Engine Speed [kW/rpm] |
Range of
Speed for Output over 25kW [rpm] |
Maximum Torque/Engine
Speed [N·m/rpm] |
Range of
Speed for Torque over 20 N·m [rpm] |
|
1 |
8 |
27 / 11 200 |
700 |
23 / 11 100 |
900 |
|
2 |
30 |
29,5 / 10 800 |
1 300 |
27 / 10 300 |
1 600 |
|
3 |
44 |
32 / 10 900 |
1 200 |
27 / 10 800 |
1 300 |
|
4 |
56 |
29,5 / 11 100 |
500 |
26 / 11 050 |
900 |
In Figure 10 as
illustrated is a piston which is considerably damaged with detonation
combustion. The black deposition is throughout the surface of the piston
bottom. The pointer shows the spot with great damage where the material was
melted down with detonation combustion. Similarly, the combustion space and an
upper section of the cylinder are also damaged. The damaged design components
are not applied in practice anymore.
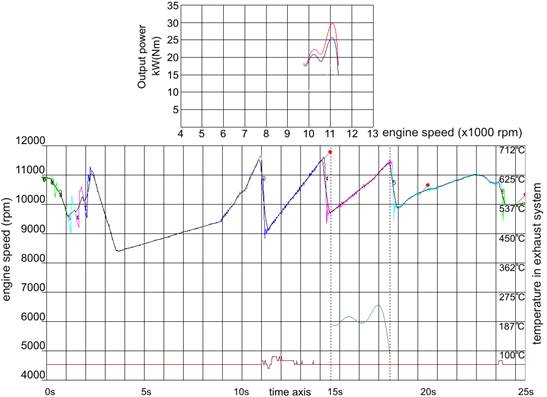
Fig. 9. Activity Record
and Output Behaviour of Engine at Measurement No.4
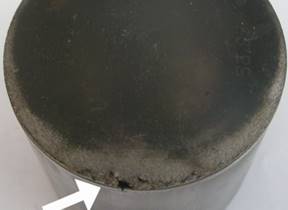
Fig. 10. Piston with
great damage
4. CONCLUSIONS
The measurements and intent on detonation combustion have brought many
interesting observations.
It is possible to theoretically assume that the higher extent of
detonation combustion provides even greater output performance at least in the
initial phase of the testing. However, the results indicate that neither the
output performance nor the torque was increased.
On the contrary, these values were decreased in comparison with
measurement No.3 where detonation combustion was weaker. This phenomenon is
caused by the fact that much energy is consumed for negative work. This work is
spent on a breaking down of resistances such as a high compression ratio. Figure
10 is a piston, which is significantly damaged with detonation combustion.
Throughout the whole surface of the piston bottom is saturate black deposition.
The pointer shows the spot with great damage caused by detonation combustion.
Similarly, the combustion space and an upper section of the cylinder are
already inapplicable.
Resulting from data of the measurements, it is necessary to keep
detonation combustion at a certain level. According to these results, there are
30 detonation units per overridden kilometre. This value is possible to reach
in various ways and the combinations of elements have influence on the
detonation combustion.
At this value, the engine permanently reached high output performance,
the large range of exploitable speed and detonation combustion did not cause
engine destruction. The utilisation of detonation combustion for the increase
of output performance is consider hazardous. Therefore, the measurements show
that through means of a change of atmospheric conditions that combustion can
occur. However, the combustion will be destructive. Detonation combustion has
got great significance which is also evident from the difference between the
measurement No.1 and No. 2 (Table 3). By means of detonation combustion for the
measurement No.2, the maximum output performance and torque in principle
is higher than for the measurement No.1.
Acknowledgements
This work was supported by the Slovak Research and Development Agency
under contract No. APVV-16-0259.
The article was written in the framework of Grant Projects: APVV-16-0259
“Research and development of combustion technology based on controlled
homogenous charge compression ignition in order to reduce nitrogen oxide
emissions of motor vehicles”, VEGA 1/0473/17 “Research and
development of technology for homogeneous charge self-ignition using
compression in order to increase engine efficiency and to reduce vehicle
emissions” and KEGA 041TUKE-4/2017 “Implementation of new
technologies specified for solution of questions concerning emissions of
vehicles and transformation of them into the educational process in order to
improve quality of education.”
References
1.
Toman R., M. Polóni, A. Chríbik. 2017. “Preliminary study on
combustion and overall parameters of syngas fuel mixtures for spark ignition
combustion engine”. Acta
Polytechnica 57(1): 38-48. ISSN 1210-2709. DOI:
http://dx.doi.org/10.14311/AP.2017.57.0038.
2.
Chríbik A., M. Polóni, J. Lach, B. Ragan. 2014. “The effect of adding hydrogen
on the performance and the cyclic variability of a spark ignition engine
powered by natural gas”. Acta
Polytechnica 54(1): 10-14. ISSN 1210-2709. DOI:
http://dx.doi.org/10.14311/AP.2014.54.0010.
3.
Czech
P., An Intelligent approach to wear of piston-cylinder assembly diagnosis based
on entropy of wavelet packet and probabilistic neural networks, 11th
International Conference on Transport Systems Telematics (TST 2011), Katowice
Ustron, Poland, October 19-22, 2011, Modern Transport Telematics,
Communications in Computer and Information Science, 2011, Vol. 239, P. 102-109.
4.
Czech
P., Determination of the course of pressure in an internal combustion engine
cylinder with the use of vibration effects and radial basis function -
preliminary research, 12th International Conference on Transport Systems Telematics
(TST), Katowice, Poland, October 10-13, 2012, Telematics in the Transport
Environment, Communications in Computer and Information Science, 2012, Vol.
329, P. 175-182.
5.
Czech
P., Diagnosing a car engine fuel injectors' damage, 13th International Conference
on Transport Systems Telematics (TST), Katowice, Poland, October 23-26, 2013,
Activities of Transport Telematics, Communications in Computer and Information
Science, 2013, Vol. 395, P. 243-250.
6.
Mikulski M., S. Wierzbicki, M. Smieja, J.
Matijosius. 2015.
„Effect of CNG in a fuel dose on the combustion process of a
compression-ignition engine”. Transport
30(2): 162-171.
7.
Ubartas M., V.
Ostasevicius, S. Samper, V. Jūrėnas, R. Daukševičius. 2011.
“Experimental investigation of vibrational drilling”. Mechanika 17(4): 368-373.
8.
Figlus T., M.
Stańczyk. 2014. “Diagnosis of the wear of gears in the gearbox using
the wavelet packet transform”. Metalurgija 53(4): 673-676.
ISSN: 0543-5846.
9.
Sebok M., M.
Gutten, J. Adamec, A. Glowacz, J. Roj. 2018. “Analysis of the electronic
fuel injector operation”. Komunikacie
(Communications - Scientific Letters of the University of Zilina) 20(1): 32-36.
10.
Kosicka
E., E. Kozłowski, D. Mazurkiewicz. 2015. „The use of stationary tests for analysis of monitored residual
processes”. Eksploatacja i Niezawodnosc – Maintenance and
Reliability 17(4): 604-609. DOI: http://dx.doi.org/10.17531/ein.2015.4.17.
11.
Magdolen
L., M. Masaryk. 2012. “Flywheel storage energy”. Conference
Gepeszet 2012, May 24-25, 2012, Budapest, Hungary. Conference proceedings, Budapest University of Technology and Economy
BME Budapest. ISBN 978-963-313-055-1.
12.
Blištan
P. et al. 2012. “Renewable energy sources and risk management”. SGEM 2012: 12th International
Multidisciplinary Scientific GeoConference. Conference proceedings: Volume
4. Albena, Bulgaria - Sofia: STEF92 Technology Ltd. P. 587-594.
13.
Medvecká-Beňová
S., Ľ. Miková, P. Kaššay. 2015. “Material
properties of rubber-cord flexible element of pneumatic flexible
coupling”. Metalurgija 54(1):
194-196. ISSN: 0543-5846.
14.
Ostasevicius V.,
I. Milasauskaite, R. Dauksevicius, V. Baltrušaitis, V. Grigaliūnas,
I. Prosyčevas. 2010. “Experimental characterization of material
structure of piezoelectric PVDF polimer”. Mechanika 86(6): 78-82.
15.
Kopilčáková
L., A. Pauliková. 2008. “Technický metabolizmus v
rámci orientovaného konštruovania”. [In Slovak:
“Technical metabolism within oriented design”]. Environmental management. 8th
Foreign Participation Conference (Review Proceedings). Bojnice, 5-6
December 2008. Žilina: STRIX. P.55-57. ISBN 978-80-89281-34-3.
16.
Puskar M., M.
Kopas, D. Puskar. 2018. “Diagnostic and management system specified for
control of engine equipped with the HCCI combustion technology”. Diagnostyka 19(4): 39-44.
DOI: 10.29354/diag/94808.
Received 24.10.2018; accepted in revised form 10.01.2019
![]()
Scientific
Journal of Silesian University of Technology. Series Transport is licensed
under a Creative Commons Attribution 4.0 International License