Article
citation information:
Drobny, M., Sobota, A.,
Żochowska, R. Analysis of the transport service of airports in selected European
metropolitan areas. Scientific Journal of
Silesian University of Technology. Series Transport. 2019, 102, 29-39. ISSN: 0209-3324. DOI: https://doi.org/10.20858/sjsutst.2019.102.2.
Marek
DROBNY[1], Aleksander SOBOTA[2], Renata ŻOCHOWSKA[3]
ANALYSIS OF THE
TRANSPORT SERVICE OF AIRPORTS IN SELECTED EUROPEAN METROPOLITAN AREAS
Summary. The article presents the characteristics of
transport systems in European metropolitan areas, providing a transport service
of airports. The authors presented an analysis of statistical data and
operating means of transport and compared the ways of servicing the airports.
The process of transport service of an airport is influenced by the number of
passengers handled, by the way, transport is organised in a given area and by
infrastructural conditions. The article uses correlation analysis, regression
models and linear correlation indices.
Keywords: metropolitan areas,
transport service of an airport, public transport
1. INTRODUCTION
Transport is one of the most
important and complex branches of a nation’s economy [1-3]. As part of
many interdependent systems, it offers the basis for their functionality and
ensuring of proper handling in terms of the movement of goods and persons. In
the complex transport processes occurring in many agglomeration centres, with
public transport as one of its branches,
that is generally accessible and
also ensures the possibility of the distribution of people to fixed
destinations, along specific transport lines.
The dynamically developing aviation
market in Europe, and the rest of the world and the increasing number of
passengers served determines the need to provide efficient transportation
connections between urban centres and the airports [4-6]. In most metropolitan
areas, they are realised by properly functioning public transport systems. The
main aim of the transport service is to provide means by which airports may be
reached quickly and competitively while being an integral part of the transport
system in the region. Depending on the nature of the area and the conditions of
the infrastructure, transport services are provided through different modes of
transport, such as buses, trams, metro and railways. The article presents the
analysis of the transport service of airports in selected metropolitan areas in
Europe.
1. CHARACTERISTICS OF SELECTED EUROPEAN METROPOLITAN
AREAS IN TERMS OF PUBLIC COLLECTIVE TRANSPORT SERVICES
The notion of the metropolis
and the metropolitan area in literature is defined in various ways. There are
many types of classification of metropolitan functions, in which the term
should refer not to urban areas but to centres meeting the following criteria [4]:
-
be relatively large (minimum 0.5-1.0 million inhabitants).
-
have significant economic potential and highly developed tertiary
service sector.
-
be characterised by a high innovative potential (scientific and research
and development units).
-
perform metropolitan functions,
that is, central functions of a high hierarchical order of at least
national scope.
-
play the role of a node in the system (networks) of communication,
organisational and information links and be characterised by high accessibility
at various spatial scales, as well
as on an international scale.
-
stimulate the development of a network economy and management model.
The basic functionality of each
metropolitan area is providing well-organised and functional public transport system
[7-10]. Depending on the circumstances, in most cases, the role of the public
transport manager in the region is played by an organiser bringing together
several dozens of different carriers. The most common means of transport are
city buses running on several hundred lines, as well as regional and city
railway, metro and trams. Table 1 shows selected metropolitan areas in Europe,
taking into account the number of population and types of public transport
modes in operation. Selected European metropolitan areas were adopted for the
study according to the following criteria:
-
metropolitan areas with the largest airports by number of passengers
served.
-
metropolitan areas where more airports operate, some of them have been
adopted.
-
only the operation of airports by public transport is taken into
account.
-
Polish airports are not included.
The purpose of
collecting the data presented in Table 1 was to identify the relationships
between the potential of a given area expressed by the population of residents
and the transport offer for this area expressed by the number of lines of
particular transport systems.
Tab. 1
Population and number of
lines in selected metropolitan areas.
|
Country |
Metropolis |
Population |
Mode of transportation - number of lines |
||||
|
Bus |
Train |
Metro |
Tram |
Trolley |
|||
|
France |
Paris |
10,950,000 |
1480 |
13 |
16 |
9 |
|
|
United Kingdom |
London |
10,470,000 |
673 |
16 |
11 |
||
|
Germany |
Ruhr |
6,670,000 |
811 |
50 |
23 |
44 |
6 |
|
Spain |
Madrid |
6,310000 |
643 |
9 |
13 |
4 |
|
|
Italy |
Milan |
5,280,000 |
297 |
12 |
4 |
17 |
4 |
|
Spain |
Barcelona |
4,790,000 |
683 |
11 |
11 |
6 |
|
|
Germany |
Berlin |
4,105,000 |
872 |
62 |
10 |
47 |
|
|
Italy |
Rome |
3,950,000 |
338 |
11 |
3 |
6 |
1 |
|
Greece |
Athens |
3,475,000 |
35 |
5 |
3 |
3 |
19 |
|
Portugal |
Lisbon |
2,700,000 |
146 |
9 |
4 |
5 |
|
|
United Kingdom |
Manchester |
2,685,000 |
638 |
26 |
7 |
||
|
Hungary |
Budapest |
2,500,000 |
245 |
6 |
4 |
35 |
16 |
|
Czech Republic |
Prague |
2,300,000 |
310 |
36 |
3 |
30 |
|
|
Belgium |
Brussels |
2,120,000 |
60 |
21 |
4 |
18 |
|
|
Germany |
Hamburg |
2,105,000 |
613 |
28 |
8 |
||
|
Germany |
Munich |
2,025,000 |
301 |
24 |
8 |
13 |
|
|
Germany |
Frankfurt |
1,950,000 |
334 |
55 |
9 |
9 |
|
|
Austria |
Vienna |
1,785,000 |
127 |
4 |
5 |
29 |
|
|
Netherlands |
Amsterdam |
1,650,000 |
957 |
22 |
4 |
17 |
|
|
Sweden |
Stockholm |
1,565,000 |
456 |
3 |
7 |
9 |
|
|
Denmark |
Copenhagen |
1,290,000 |
470 |
25 |
2 |
||
|
Finland |
Helsinki |
1,280,000 |
503 |
70 |
24 |
13 |
|
|
Ireland |
Dublin |
1,158,000 |
122 |
17 |
1 |
31 |
|
|
Spain |
Malaga |
725,000 |
80 |
2 |
2 |
||
|
Switzerland |
Zürich |
620,404 |
60 |
27 |
15 |
6 |
|
|
Spain |
Palma de Mallorca |
550,000 |
103 |
3 |
2 |
||
Figure 1 shows the
number of population in selected metropolitan areas. It is observed that metropolises
located almost all over Europe were selected for the analysis. Moreover, the
focus was on the most important urban centres of a given country. The analysis
of the population of the inhabitants in the considered areas indicates that the
largest of them are located in north-western Europe (Germany, France and, Great
Britain). The metropolitan areas of southern and central-eastern Europe are
less populated
Figure 2 shows the
dependence of the population and the means of transport lines in selected
metropolitan areas. Figures 3 and 4 present the number of lines and the share
of the mode of transportation in selected metropolitan areas.
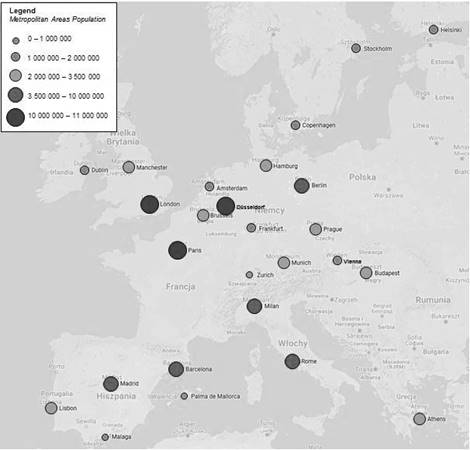
Fig. 1. Number of the
population in selected metropolitan areas
Fig. 2. Population and means of
transport lines in selected metropolitan areas
Fig. 3. Mode of transportation
and number of lines in selected metropolitan areas
Fig. 4. Share of mode of
transportation in selected metropolitan areas
Presentation of data
summarised in Table 1 and Figures 2 to 4 gives a full picture of the transport
offers in all metropolises. Considering the data presented in Figure 1, it is
not possible to clearly state what the relationship between the inhabitant
population and the number of public transport lines.
The largest number of
public transport lines exist in Paris. This metropolis is also characterised
with the largest population. About 1,000 lines serve Berlin and Amsterdam. At
the same time, the second metropolis is characterised with more than half a
smaller population. The smallest number of public transport lines was recorded
in Athens, Brussels and Malaga. However, the population of Athens is about
1,000,000 more than Brussels and over 2,500,000 more than Malaga.
The analysis of the data
presented in Figure 2 indicates that buses are the mode of transport most often
used in metropolitan transport services. This is obviously natural because this
means of transport is characterised by the greatest accessibility. However,
there are metropolises, where the share of other transport means other than
buses are high. This is particularly true for Athens, Brussels and Zurich. In
the first metropolis, the share in question is about 46%, of which the
trolleybuses are the most. In Zurich, it is around 44% of which the largest
number of public transport lines offers a train, similar to Brussels, where the
number of railway and tram lines are at a similar level.
2. THE TRANSPORT SERVICE OF AIRPORTS IN SELECTED EUROPEAN
METROPOLITAN AREAS
The airports are the integral parts
of most European metropolitan areas. An important element of their proper
function is the adaptation of transport services with the main urban centres of
the metropolis.
Figure 5 shows the number of
passengers served in 2017 in selected European airports.
Table 2 shows selected metropolitan
areas with the airports serving them, the number of passengers served in 2017
and the modes of transport enabling the connection. In the table the following
abbreviations are used for means of transport: B – Bus, T – Train, M
– Metro. Tram connections are not included as only two airports have this mode of
transportation.
Tab. 2
Selected European
airports with a mode of public transport connections.
|
Country |
Metropolis |
Airport IATA Code |
PAX 2017 |
Mode of transportation |
||
|
B |
T |
M |
||||
|
United Kingdom |
London |
LHR |
78 013 771 |
|
ü |
ü |
|
France |
Paris |
CDG |
69 473 157 |
|
ü |
|
|
Netherlands |
Amsterdam |
AMS |
68 515 425 |
ü |
ü |
|
|
Germany |
Frankfurt |
FRA |
64 500 386 |
ü |
ü |
|
|
Spain |
Madrid |
MAD |
53 388 044 |
ü |
ü |
ü |
|
Spain |
Barcelona |
BCN |
47 262 826 |
|
ü |
ü |
|
Germany |
Munich |
MUC |
44 577 241 |
|
ü |
|
|
Italy |
Rome |
FCO |
40 968 756 |
|
ü |
|
|
Ireland |
Dublin |
DUB |
29 582 468 |
ü |
|
|
|
Switzerland |
Zürich |
ZRH |
29 345 153 |
|
ü |
|
|
Denmark |
Copenhagen |
CPH |
29 134 235 |
ü |
ü |
ü |
|
Spain |
Palma de Mallorca |
PMI |
27 968 521 |
ü |
|
|
|
United Kingdom |
Manchester |
MAN |
27 901 040 |
ü |
ü |
|
|
Sweden |
Stockholm |
ARN |
26 683 732 |
|
ü |
|
|
Portugal |
Lisbon |
LIS |
26 663 385 |
ü |
|
ü |
|
Belgium |
Brussels |
BRU |
24 751 493 |
ü |
ü |
|
|
Germany |
Ruhr |
DUS |
24 640 564 |
ü |
ü |
|
|
Austria |
Vienna |
VIE |
24 392 705 |
|
ü |
|
|
Italy |
Milan |
MXP |
22 160 090 |
|
ü |
|
|
Greece |
Athens |
ATH |
21 705 312 |
ü |
ü |
ü |
|
Germany |
Berlin |
TXL |
20 459 995 |
ü |
|
|
|
Finland |
Helsinki |
HEL |
18 892 386 |
ü |
ü |
|
|
Spain |
Malaga |
AGP |
18 628 876 |
ü |
ü |
|
|
Germany |
Hamburg |
HAM |
17 616 455 |
ü |
|
|
|
Czech Republic |
Prague |
PRG |
15 415 001 |
ü |
|
|
|
Hungary |
Budapest |
BUD |
13 097 239 |
ü |
|
|
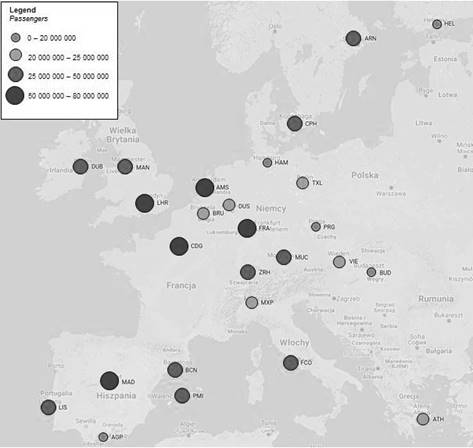
Fig. 5. Number of passengers in
selected European airports
The train is used 19 times in the
transport service presented in Table 2 of airports, bus 17 times and metro - 6. Thirteen airports are served by one means of transport,
including 7 using railways. Thirteen airports use at least 2
means of transport. In this second set, 10 airports are served by 2 means of
transport (mostly by train and bus). Three
airports use bus, train and metro for transport.
3. THE ANALYSIS OF CORRELATION
In order to analyse the transport
service of airports in selected European metropolitan areas, the Pearson
correlation coefficient method was applied. The coefficient allows to
determining the level of linear dependence between random variables. The
application of the method allowed to determine the relationships between the
number of passengers served at selected airports and the population of selected
European metropolitan areas. Next, the relationship between the number of
passengers served at selected airports and the number of journeys of particular
means of transport serving these airports were determined. Figure 6 shows the
relationship between the number of passengers and the population of selected
European metropolitan areas.
Figures 7, 8 and 9 show the
relationship between the number of passengers and the different modes of transport
serving airports.
Figure 6 shows the
relationship between the number of inhabitants and the number of passengers
served at the airports. It may be seen that the larger the number of
inhabitants, the more passengers the airports have to serve. However, the
correlation between these variables is not very strong. Therefore, there are
other factors affecting the number of passengers served. It seems that it may
be terminal capacity, the nature of the area in which the airport operates
(economic, tourist) and others. The study of these dependencies will constitute
the basis for future research.
Fig. 6. Relationship between
the number of passengers and population in selected metropolitan areas
Fig. 7. Relationship between
the number of passengers and number of bus lines
Fig. 8. Relationship between
the number of passengers and number of train lines
Fig. 9. Relationship between
the number of passengers and number of metro lines
The data presented in
Figures 7, 8 and 9 are the confirmation of the earlier thesis on the difficulty
in determining the nature of the relationship between the population of
residents and the number of public transport line. The analysis of the
relationships showed the following dependencies:
-
correlation between PAX and population (R2 = 0,560) is
moderate and positive.
-
correlation between PAX and bus lines (R2 = 0,001) is weak
and positive.
-
correlation between PAX and train lines (R2 = 0,106) is weak
and negative.
-
correlation between PAX and metro lines (R2 = 0,436) is
moderate and negative.
4. CONCLUSIONS
The article presents the results of the analysis regarding the transport service of selected
airports in Europe. The results of the analysis indicate that it is different
and this is shown in Table 2. It is also difficult to
find a relationship between the number of passengers served and the number or
type of transport means used to operate airports.
The bus offers the
richest transport offer in terms of the number of lines serving the given
airport. In each of the analysed airports, at least 50% of the courses are
served by this means of transport.
The analysis of the
relationship between the number of passengers served and the number of lines of
a given means of transport indicates that these variables are not correlated.
This is confirmed by Figures 7, 8 and 9. Therefore, the selection of the
transport means to operate in an airport depends on factors other than the
number of passengers served. It seems that they may be spatial management (the distance of the
airport from the centre), available transport resources in a given area and
others. This probe will be the area for
further research.
References
1. Koźlak A. 2011. „Perspektywy włączenia
transportu kolejowego w obsługę portów lotniczych w
Polsce”. [In Polish: „Perspectives of airport rail links in Poland”].
Logistyka 6: 4279-4290.
2. Nielsen O.A., J.B.
Ingvardson. 2018. “How urban density, network
topology and socio-economy influence public transport ridership: Empirical
evidence from 48 European metropolitan area”. Journal of Transport Geography 72: 50-63.
3.
Sobota A., R. Zochowska, E. Szczepanski, et al. 2018. “The
influence of tram tracks on car vehicle speed and noise emission at
four-approach intersections located on multilane arteries in cities”. Journal of
Vibroengineering 20(6): 2453-2468.
4.
Markowski T., T.
Marszał. 2006. Metropolie, Obszary metropolitalne, metropolizacja.
Problemy i pojęcia podstawowe. [In Polish: Metropolises, Metropolitan areas, metropolization. Basic problems and
concepts]. PAN: Warsaw.
5.
Ilnicki D. 2003. „Miasta
polskie jako potencjalne metropolie o znaczeniu kontynentalnym (próba
identyfikacji)”. [In
Polish: „Polish cities as potential metropolises of continental
importance (identification attempt)”]. In: Jażdżewska I. (ed.). Funkcje
metropolitalne i ich rola w organizacji przestrzeni. [In Polish: Metropolitan functions
and their role in the organisation of space]. University of
Łódź: Łódź.
6.
Śleszyński
P. 2016. „Naukowe podstawy i praktyczne problemy klasyfikacji i
delimitacji obszarów metropolitalnych”. [In Polish: „Scientific basis
and practical problems of classification and delimitation of metropolitan
areas”]. Metropolitan 2(6):
14-25.
7.
UITP, the International Association of Public
Transport. “Travel for All”. The
commitment of European Public Transport. Brussels 2018.
8.
European Metropolitan Transport Authorities. “Light Rail
Explained: Better public transport & more than public transport”. Amsterdam 2014.
9. Singhal V., S.S. Jain,
M. Parida. 2018. “Train sound level detection system at unmanned railway
level crossings”. European
Transport\Trasporti Europei Issue 68, Paper n 3, P. 1-18. ISSN 1825-3997.
10. Gnap J., J.
Kupculjakova, S. Semanova. 2018. “Determination of time savings for
passengers by applying the public passenger transport preference in cities”.
Komunikacie (Communications - Scientific Letters of the University of
Zilina) 20(3): 3-8.
Received 29.11.2018; accepted in revised form 20.01.2019
![]()
Scientific
Journal of Silesian University of Technology. Series Transport is licensed
under a Creative Commons Attribution 4.0 International License