Article citation information:
Michta, A., Haniszewski, T. Traffic noise experienced on buses, trams and cars in the urban agglomeration of the city of Katowice. Scientific Journal of Silesian University of Technology. Series Transport. 2018, 98, 101-109. ISSN: 0209-3324. DOI: https://doi.org/10.20858/sjsutst.2018.98.10.
Agata MICHTA[1], Tomasz HANISZEWSKI[2]
TRAFFIC NOISE
EXPERIENCED ON BUSES, TRAMS AND CARS IN THE URBAN AGGLOMERATION OF THE CITY OF
KATOWICE
Summary. Transport noise is one of the biggest problems faced
by urban agglomerations. Therefore, more and more activities are being
undertaken related to its reduction. The article attempts to investigate the
noise level on public transport vehicles, buses, trams and passenger cars, from
the passenger’s perspective. The assessment is based on the results of field
tests. The study considered wheeled and rail vehicles, including a new
generation of buses and tramways, as well as a car subjected to many years of
operation. The research was carried out in the city of Katowice. The conducted
experiment showed comparable high values for recorded volume levels on trams
and buses, as well as a relatively low noise level in the passenger car.
Keywords: traffic
noise, urban agglomeration, transport
1. INTRODUCTION
When, in 2004, Poland decided to join the EU,
it had to face many restrictive assumptions on the part of every other country
belonging to it. Most areas of human life are regulated, including those that
are intended to improve quality of life in urban agglomerations [10,16].
Great importance is placed on reducing noise,
which is a burdensome environmental and anthropogenic factor, which can
negatively impact the experience of city life among residents and visitors.
Noise is an indispensable phenomenon related to the development of public
spaces in cities and communication within them. It can be divided according to
source, i.e., communication noise, industrial noise, communal noise, domestic
noise and the resultant work environment [14,15,18,23].
Noise is an undesirable excess of emitted
sound, which has a nagging or even harmful effect on human health. This
nuisance is related to the characteristic features of the sound, i.e., the
frequency and intensity of the propagating acoustic waves. We may talk about
this harmfulness when we are exposed to prolonged exposure to the noise source,
when the amplitude of the sound increases to the upper limit, i.e., about 102
W/m2 (pain limit), in which the sound is not an aural impression but
perceived as pain [23].
The human hearing system is designed to receive
a sound wave, which is directed to the eardrum and introduced to vibrations.
These vibrations pass successively between the ossicles, hammer, anvil and
stapes, which bring fluid into the worm tube, in turn irritating the cilia of
the receptor cells and causing electrical impulses. Using the auditory nerve,
they reach the centre of hearing in the cerebral cortex. There, they are read
and interpreted [3].
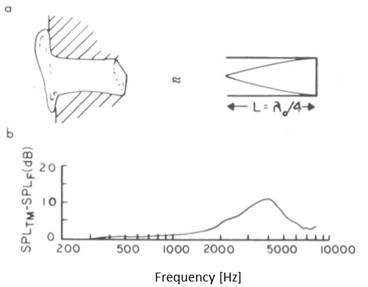
Figure 1. Hearing wire (a) and sound
pressure level (SPL) gain diagram in the ear canal
(b) [23]
The human hearing organ (Figure 1) processes
sounds with frequencies in the 16-20,000 Hz range. The best audible frequencies
are those in the 1,000-4,000 Hz range. At a young age, we are able to receive
these frequencies. As we get older, the body lowers the upper limit of the
sound reception, such that high-frequency sounds are no longer heard (at which
point, the best-heard sounds are those in the 1,000-3,000 Hz range).
The threshold for audible levels is 0 dB, while
the maximum intensity of an audible sound is that with a 140 dB measure (the
higher value causes pain, which is related to the damage inflicted on the
spiral organ). The division of the noise level due to nuisance from the sound
reception (Table 1) is as follows:
• <35 dB: this sound volume is harmless
to people, but it can be burdensome during work that requires us to focus
• 35-75 dB: this volume is bothersome,
makes it difficult to understand the speech of the person standing next to the
hearer and eliminates the rest of the nervous system from the human nervous
system
• 70-85 dB: this causes gradual damage to the hearing organ
• 85-130 dB: this damages people’s
hearing, contributes to diseases of the nervous system and does not allow the
speech of a person standing next to the hearer to be understood
• 130 dB: this sound permanently damages
human hearing and enhances the vibrations of internal organs [4]
Tab. 1
The scale of subjective
nuisance from
communication noise [8]
|
Onerousness |
LAeq (dB) |
|
Small |
<52 |
|
Average |
52-62 |
|
Large |
63-70 |
|
Very large |
>70 |
Traffic
noise is mainly related to vehicle traffic. The most noticeable noise of this
kind is found in highly developed anthropogenically agglomerations, where the
communication diversity along the routes used by cars, trams and railways has
been extended. The article presents an analysis of noise that affects
passengers in a passenger car, bus and tram, which represent the main sources
of public transport in Polish agglomerations [2].
2. RESEARCH PLAN
The aim of the study is to analyse
the occurring noise in public transport vehicles from the passenger’s
perspective. The experiment was carried out in accordance with the
PN-90/S-04052 standard with an acceptable noise level inside the vehicle using the
SON-50 integral sound level meter.
The technical data for the SON-50
are as follows:
• Microphone:
WK-21, capacitive, polarized
• Time
characteristics: SLOW, FAST
• Filters:
centre frequencies: 31.5÷8 kHZ
• Measuring
range: 20-135 dBA
The measurements were carried out on
Correction Curve A and the FAST dynamic characteristic. The device was placed
on the seat where the passenger would sit. The tests were carried out over a
period of time, in which individual vehicles overcame the route between the selected
stops in three measuring rounds [21].
The objects subjected to sound
intensity testing were respectively:
• Volvo 7900 series hybrid bus
• Tram with Konstal 105N HF series wagon
• Renault car
Measurements on three types of
public transport were performed in Katowice on the route between Katowice
Zawodzie Łączna and Katowice Zawodzie Pętla.

Fig. 2. Route between Katowice Zawodzie Łączna and Katowice Zawodzie Pętla
Source: Google Maps
Noise was checked at bus stops when
people were allowed onto vehicles, at the time of starting, during the route
between stops, and during stopping at the next stop. The measurements were
carried out on the section between one stop and the next on three occasions.
The noise level results were convergent, according to PN-90/S-04052, where the
noise of public transport cannot be higher than 85 dB/A.
Tab. 2
Technical data of tested
vehicles
Technical data |
Bus |
Tram |
Car |
|
Dimensions |
Length: 18 mWidth: 2.55 mHeight: 3.28 m |
Length: 13.5 m Width: 2.35 m
Height: 3.35 m |
Length: 4.209 m Width: 1.777 m Height 1.457 m |
|
|
High-pressure: Volvo D5K 240, four-cylinder in-line engine, 240HPElectric: Volvo I-SAM, 150 kW/1,200 Nm |
Asynchronous AC drive |
Petrol: 115 km |
|
Additional data |
Exhaust system: One-piece silencer.
Under normal driving conditions, the DPF is self-regenerating without driver
intervention. |
Weight: 16,500 kg Maximum speed: 70 km/h |
Drive type: for the front axle |
The tests were carried out in the
city between 10.00 and 12.00; hence, the maximum value of vehicle speed did not
exceed 50 km/h. The meter was placed on the passenger seat in order to measure
the passenger’s driving comfort. The study took into account the travel time of
a given route by a public transport vehicle [1].
3. RESEARCH RESULTS
The bus (Volvo hybrid bus; see
Figure 3) considered during the test is a relatively new vehicle, as it was
produced in 2016. The largest noise values were observed at the moment of
leaving and at arriving the bus stop. Nevertheless, the noise level did not exceed
the values included in the PN-90/S-04052 standard, especially since this noise
came from the passenger compartment in which it was tested and was thus also
related to conversations of other vehicle passengers and other disturbances. On
the scale for the subjective feeling of comfort (Table 1), the nuisance
from feeling noise was high [2,5,7,20].
Fig. 3. Averaged (average of three
attempts for the Volvo hybrid bus) noise level in the public bus from the
perspective of the time between the two stops
The tram considered by the test was
manufactured in 2007; thus, it was a relatively new communication vehicle. We
observed the highest noise level while driving. Throughout the route, we could
observe a more or less constant noise value without major amplitudes. As can be
seen on the graph, the values for most of the road oscillated in the 75-85 dB
value range (Figure 4), which gave us a value within the standard’s range; but,
for our auditory system, it was tiring and it is not recommended for places
with such fixed noise values [9,11,12,17].
The noise level was examined in the
passenger space, such that human factors were also superimposed on its
reception. According to the scale of the subjective feeling of comfort, driving
a tram with such a noise level is very burdensome for the passenger. However,
in our case, this evaluation fell within the range of the PN-90/S-04052
standard [1,7,19,21].
Fig. 4. Averaged (average of three
attempts for tram with a Konstal 105N series wagon)
noise level on the public bus from the perspective of the time between the two
stops
Fig. 5. Averaged (average of three
attempts for the Renault car) noise level on the public bus from the
perspective of the time between the two stops.
The passenger car was constructed in
2004 and had a long service life. Nevertheless, the vehicle did not exceed 70
dB. As can be seen on the graph, the noise level fluctuated in the 55-65 dB
value range. The highest noise level occurred when the vehicle accelerated. The
passenger should not feel too tired from the route due to being exposed to the
significant effects of the sounds reaching him/her. This is also connected to
the fact that we did not deal with the load related to the additional noise
caused by other passengers when driving the car. The test was carried out from
the passenger’s perspective in the front cabin of the vehicle [7,13,19].
Fig. 6. Average noise level in three
types of vehicles: bus, passenger car, tram
The graph
shown in Figure 6 presents the averaged noise values for individual vehicles on
the same section of the route. As can be seen, the largest load, in terms of
arrival noise, is experienced by a passenger taking a tram ride, in which the
average was ≈75 dB. The least annoying noise was from the passenger car
(≈54 dB).
4. CONCLUSIONS
Due to the fact that everybody is
exposed to noise, one should be aware that it can have harmful effects in terms
of the length of exposure to the sound reaching us. For the heavily urbanized
and anthropogenically used area of the city in which the study was conducted,
traffic noise is noise that dominates over other sources. In the conducted
experiment, it can be observed that it did not exceed the established norms,
but it was onerous and permanent, which would affect the state of our physical
and mental health [6].
In order to eliminate the nuisance
of traffic noise and ‘mute’ the city, in addition to the standard processes,
the following is advised: capturing vehicles exceeding the noise level,
checking technical conditions, i.e., the value of tyre pressure, introducing
alternative public transport vehicles. In recent years, many innovative,
pro-ecological approaches to reducing or almost eliminating noise levels and
reducing the amount of exhaust gases have been developed, such as airborne
gondolas, trams and electric vehicles. Introducing them involves huge financial
resources; but, in the years to come, we should feel a difference in the
quality of air and a reduction or almost total reduction in the level of
transport noise in the city.
The noise level of vehicles in
comparison with earlier models in the context of public transport has
decreased. The introduction of appropriate standards and initiatives by the
countries in the EU community has also had an impact on reducing noise nuisance,
especially for the benefit of passengers. Companies producing vehicles are
employing increasingly well-educated acoustics that work on soundproofing
sounds emanating from vehicles. More and more attention is being focused on
driving comfort because increased comfort when using public transport will mean
an increase in the number of passengers.
The fight against noise has begun,
and every step of the way we hear about the further development of innovative
ideas. Everything indicates that, in the next few years, the noise level will
change positively, such that not only will the imposed standards be met, but
also the needs of the typical passenger.
References
1.
Bastián-Monarca
Nicolas, Enrique Suárez, Jorge Arenas. 2016. “Assessment of methods for simplified
traffic noise mapping of small cities: casework of the city of Valdivia,
Chile”. Science of the Total Environment
550: 439-448. DOI: 10.1016/j.scitotenv.2016.01.139.
2.
Basztura Czesław.
1998. Sources, Signals and Acoustic
Images. Warsaw: Publishing House
of Communication and Communications.
3.
Czeskin M.S. 1996.
Man and Noise. Warsaw: State
Scientific Publisher.
4.
Czajka J. 2002. Measurements
of Vibrations and Noise at Workplaces in Transport. Warsaw: Publishing
House of Communication and Communications.
5.
Coquel Guillaume,
Corinne Fillol. 2017. “Analysis of ground-borne noise and vibration levels
generated by buses”. Procedia Engineering
199: 2699-2704.
6.
Koton J., B.
Harazin. 2000. Health Effects of
Occupational Exposure to Local Vibrations. Warsaw: Central Institute for
Labour Protection.
7.
Kowalski Piotr.
2007. “Vibrations and noise in road vehicles.”. Work Safety 5: 10-13.
8.
Leśniowska-Matusiak
Ida, Aneta Wnuk. 2014. “The impact of traffic noise on the condition of the acoustic
environment of man”. Car Transport 3.
9.
Molecki A., Gąska
D. 2002. “Calculations of tramway track capacity in the wide area networks”. Transport 27(4): 428-433.
10.
Okokona Enembe O.,
Yli-Tuomia Tarja, Turunena Anu W., Taimistoa Pekka, Pennanena Arto, Vouitsisb
Ilias, Samarasb Zissis, Voogtc Marita, Keukenc Menno, Lankia Timo. 2017.
“Particulates and noise exposure during bicycle, bus and car commuting: a study
in three European cities”. Environmental Research 154: 181-189.
11.
Pnulinova Eva.
2017. “Input data for tram noise analysis”. Procedia
Engineering 190: 371-376.
12.
Pallas M.A., J.
Lelong, R. Chatagnon. 2011. “Characterisation of tram noise emission and
contribution of the noise sources”. Applied
Acoustics 72: 437-450.
14.
Supreme Audit Office. 2013.
Protection of Residents of Large Cities Against Noise.
15.
Office of Analyses and
Documentation. 2012. Noise Hazards: Selected Issues. Warsaw: Senate
Office.
16.
Świertina
Wojciech, Bogusław Łazarz, Piotr Czech, Adam Mańka, Mirosław Witaszek. 2015. “Noise in a strategic bus in public transport”. TTS 12: 1514-1518.
17.
Tomczak Urszula,
Łukasz Mielczarek. 2016. “Two-level structure for tram and road traffic in the
centre of city – Lodz in Poland”. Procedia
Engineering 143: 574-581.
19.
Zając Grzegorz.
2011. “Research on noise and vibrations in trams”. Technical Transactions Technical Magazine 4.
20.
Zannin P. 2008.
“Occupational noise in urban buses”. International
Journal of Industrial Ergonomics 38: 232-237.
21.
PN-ISO 1999 “Acoustics – Determination
of Occupational Exposure to Noise and Estimation of Noise-induced Hearing
Impairment”.
22.
Office of the
Senate of the Republic of Poland. 2012. Noise
Pollution. Warsaw: Office of the Senate of the Republic of Poland.
Available at: https://www.senat.gov.pl/gfx/senat/pl/senatopracowania/30/plik/ot-612_inter.pdf.
23.
“Information about
sound”. Available at: https://sound.eti.pg.gda.pl/student/pp/Ucho_budowa_uzupelnione.pdf.
Received 19.11.2017; accepted in revised form 11.02.2018
![]()
Scientific Journal of
Silesian University of Technology. Series Transport is licensed under
a Creative Commons Attribution 4.0 International License